

Why Framework Choice Shows Up in the Field
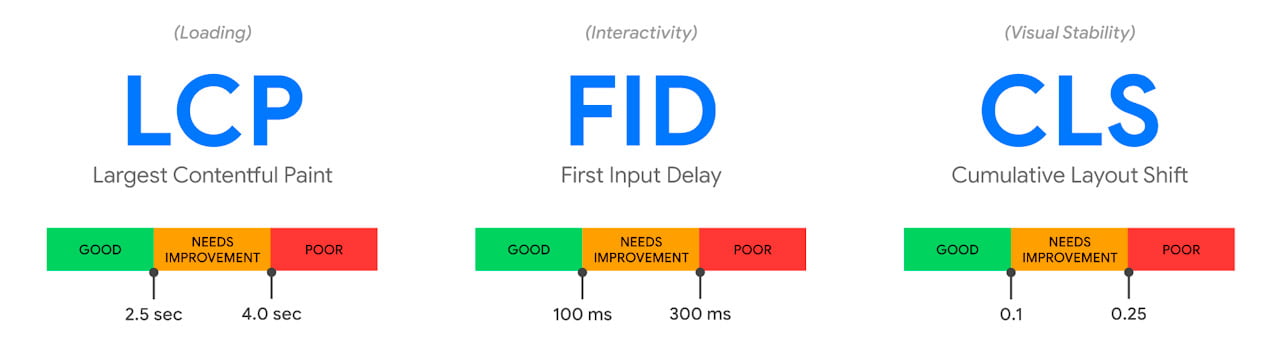
Google’s Chrome User Experience Report (CrUX) collects Real User Measurements from opted-in Chrome sessions worldwide — LCP, FID and CLS, the three Core Web Vitals. Since June 2021, those metrics have also influenced search ranking. The data is free to query, and Google’s related HTTP Archive adds a technology fingerprint for each analyzed page via Wappalyzer. The Core Web Vitals Technology Report, built by Google’s Rick Viscomi on top of both datasets, is the quickest way to compare framework performance from real traffic, and it was the primary tool for the analysis below.
Several structural caveats apply. The report aggregates field data per origin rather than per page, with origins weighted by traffic for metric values but not for the ratio of “good” origins — meaning a low-traffic but qualifying origin counts as much as a very popular one. HTTP Archive technology detection runs only on each origin’s homepage, so framework attribution is tied to that single page while the origin’s other pages are lumped in regardless of what they use. Subdomains also count as separate origins.
Overall Good CWV by Framework
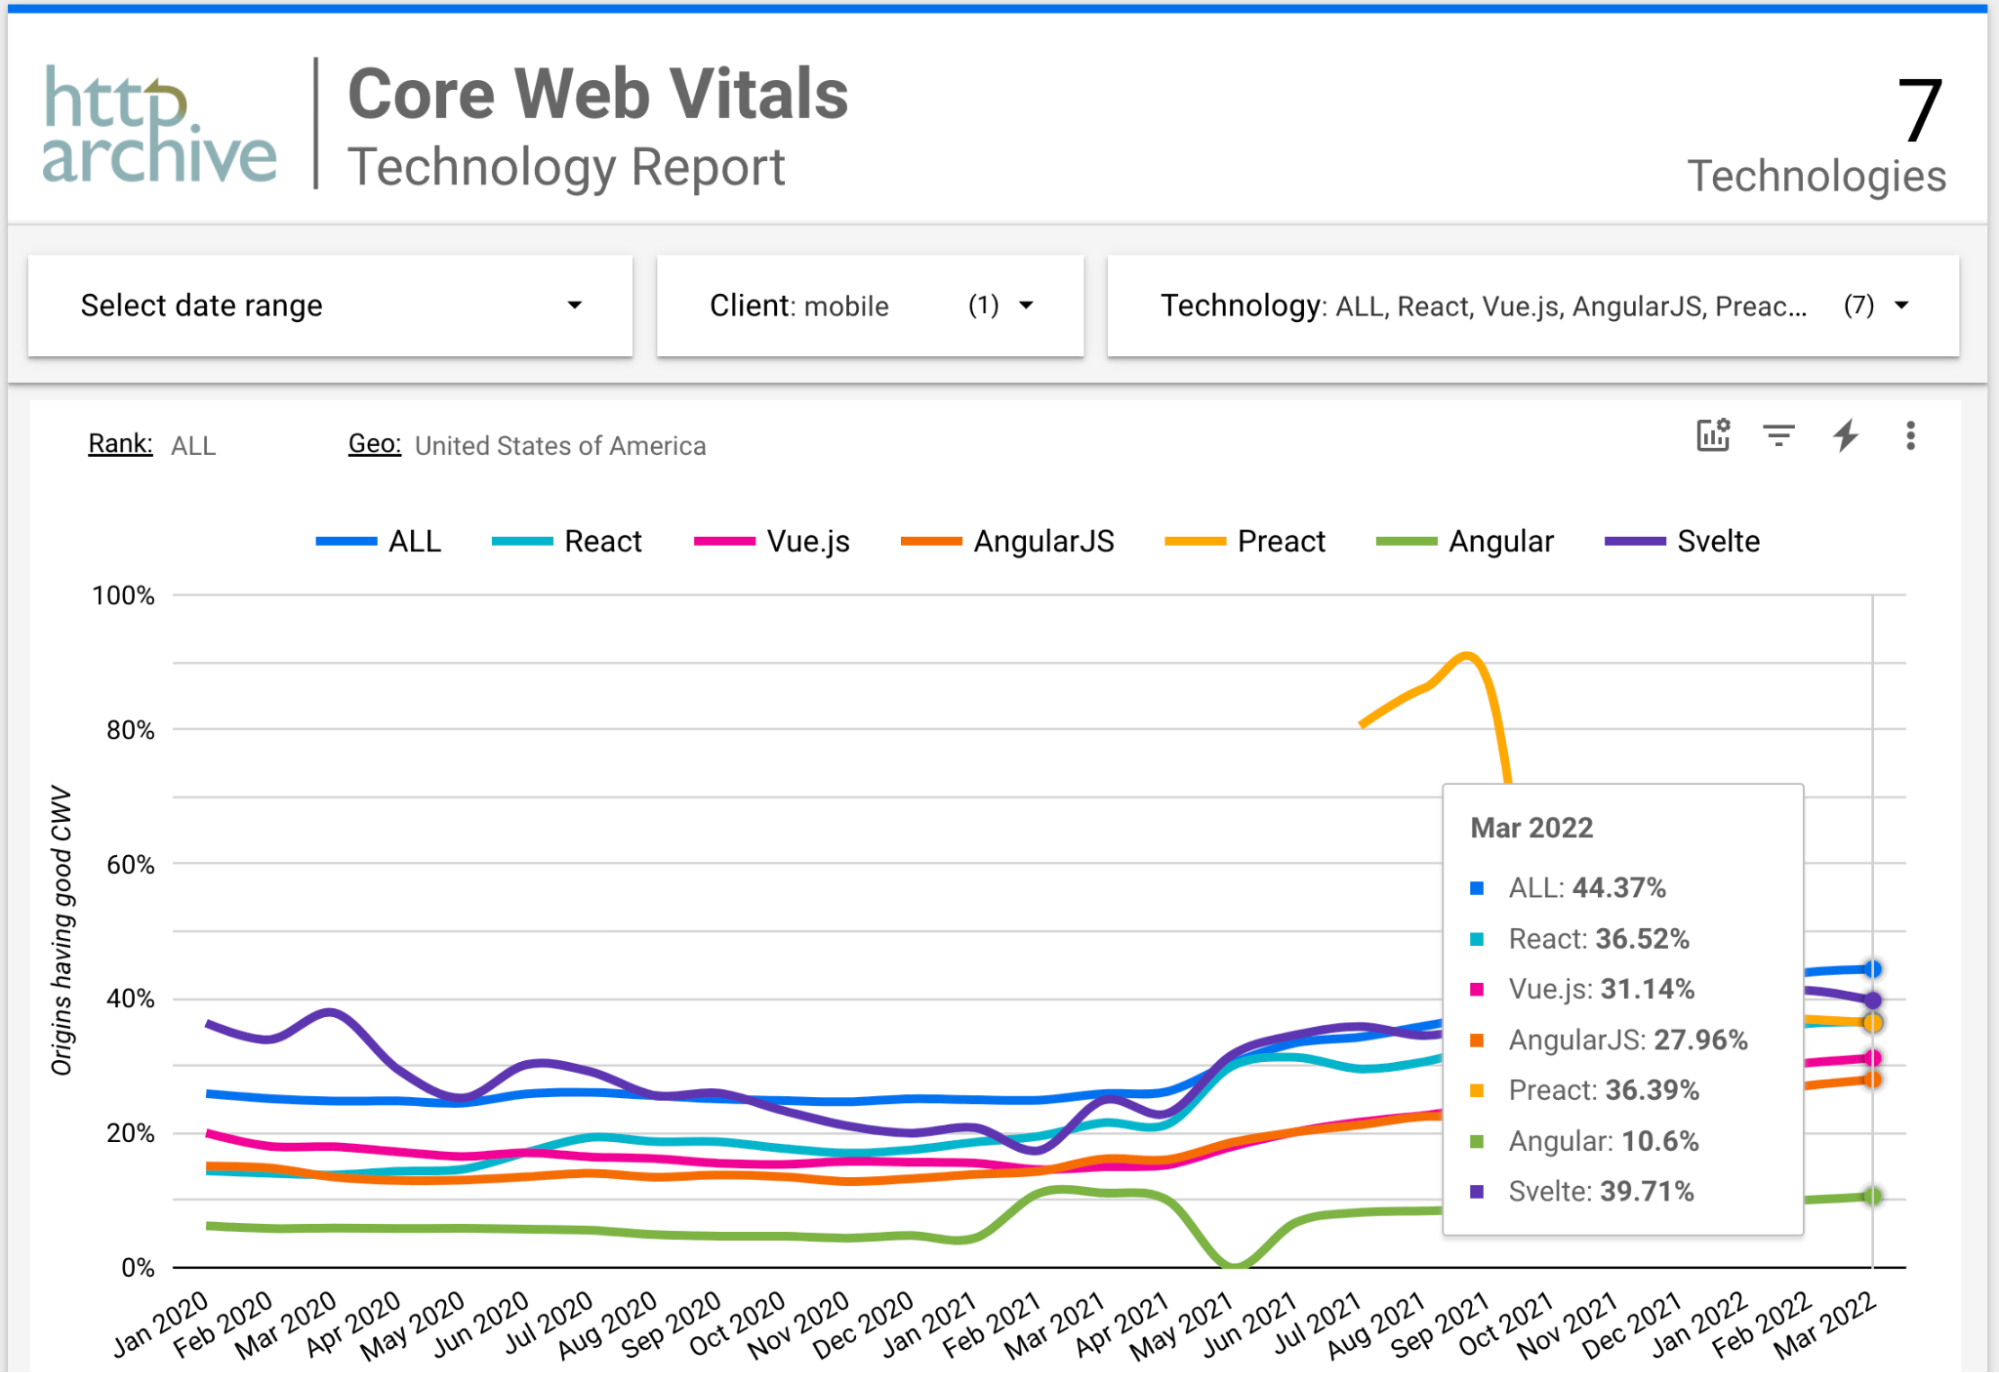
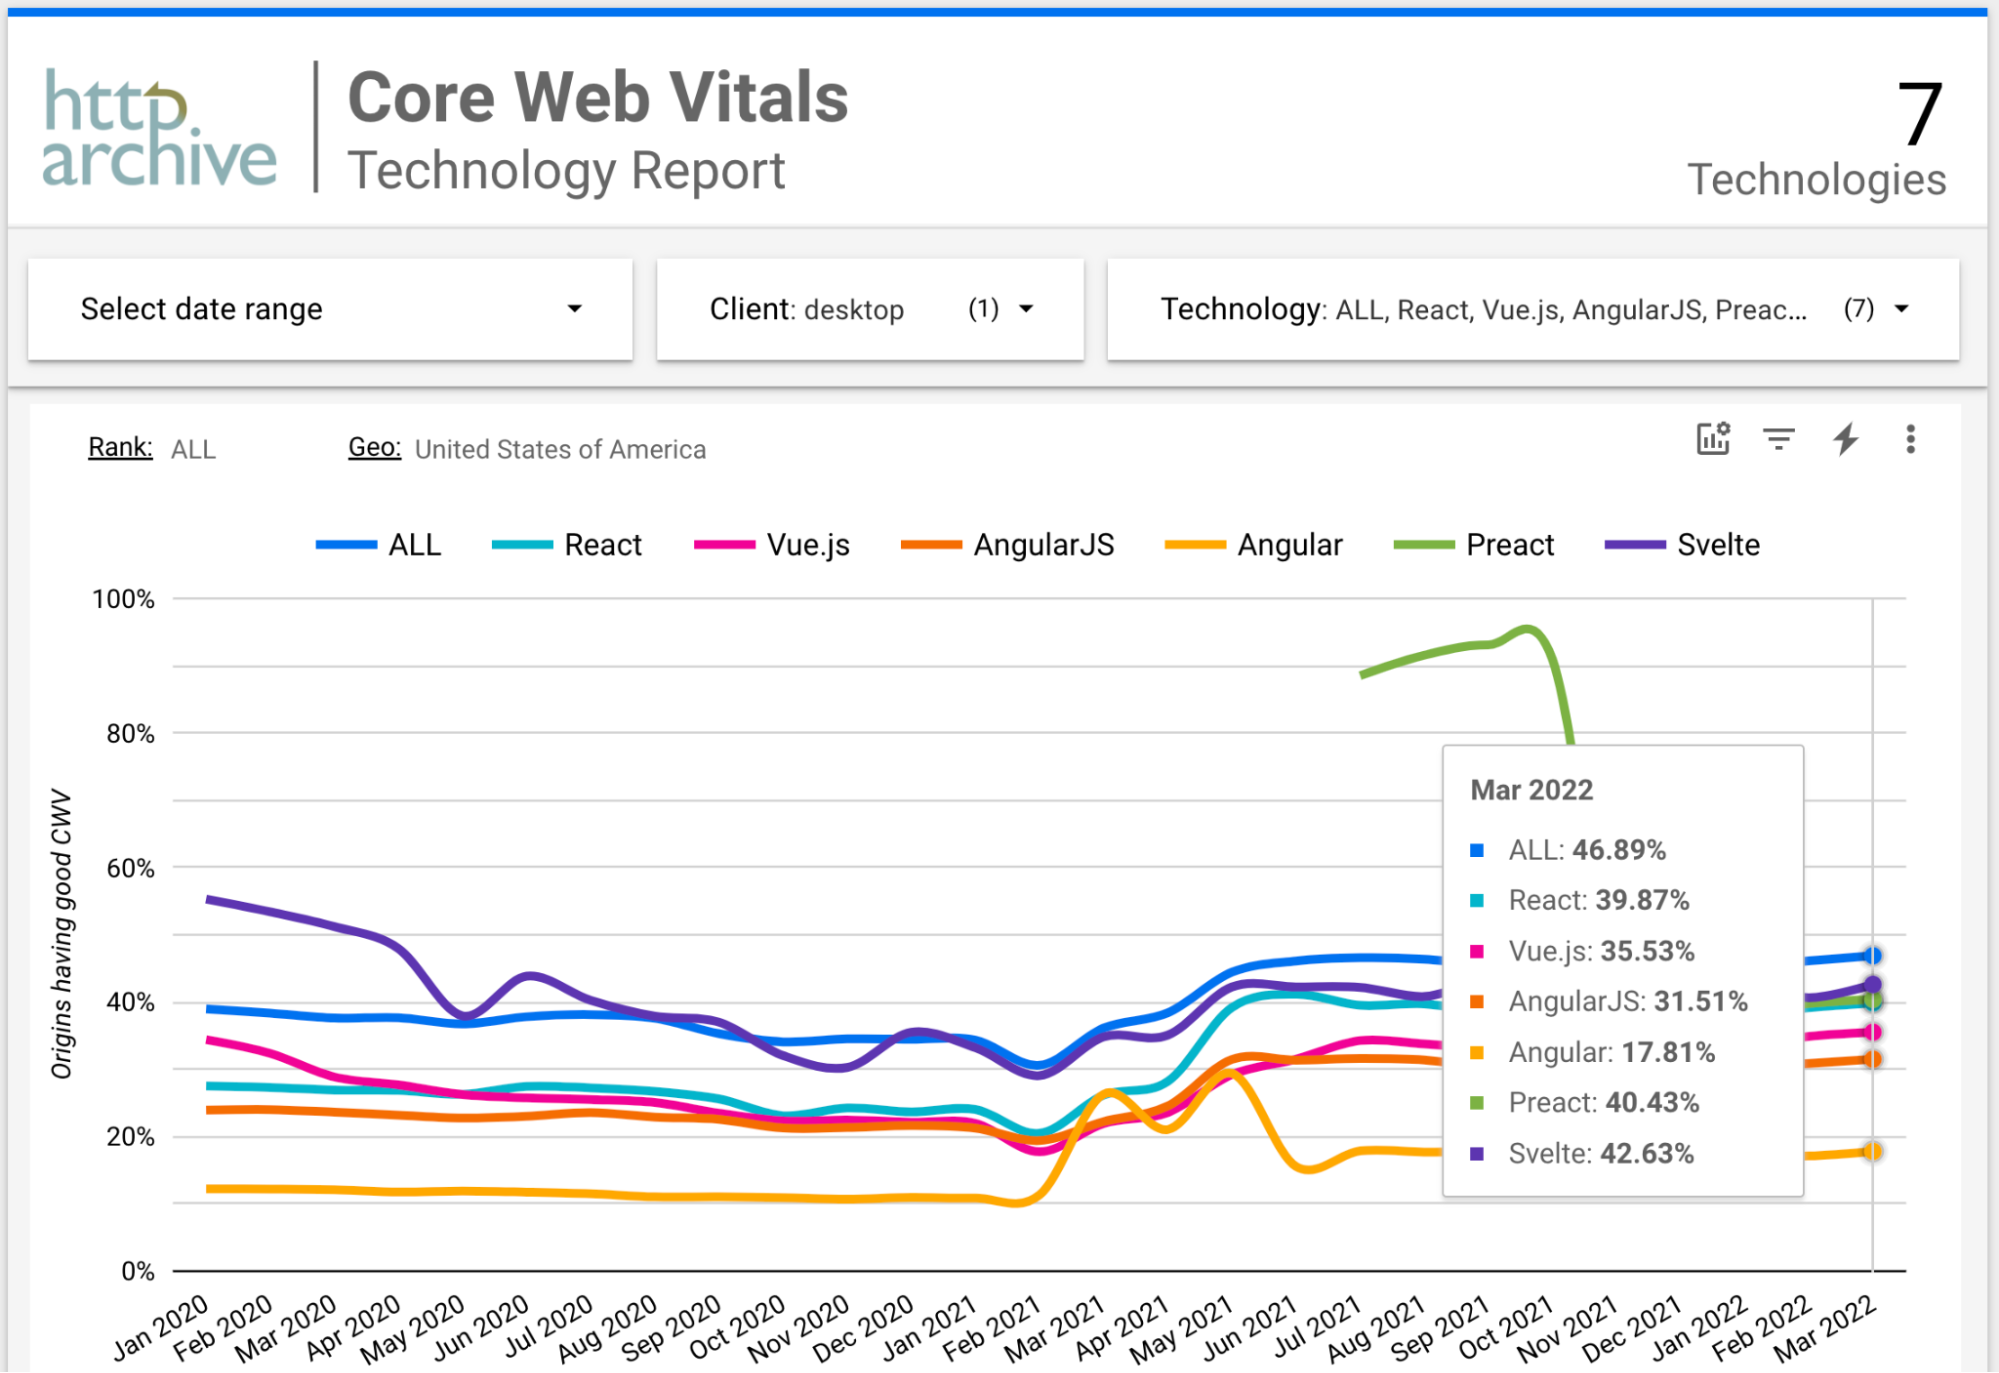
Looking at the percentage of origins passing all three Core Web Vitals at good levels, filtered to US sessions to remove geographic noise, the first takeaway is that frameworks generally underperform the “ALL” baseline, which includes every site in CrUX. React, Preact and Svelte land closest to that average; none beats it. Vue and AngularJS trail more substantially — roughly 20–25% lower good rates on mobile and 15–20% lower on desktop — though Vue has been slowly closing the gap with React.
One notable data quirk explains Preact’s sharp historical dip: Wappalyzer only began reliably detecting Preact in late 2021. Results before that period are invalid, and the variability in Preact’s line is a detection artifact, not a performance regression.
Restricting to Popular Sites
Limiting the set to the top 1,000,000 US origins by traffic changes the picture. Vue’s good-CWV ratio climbs and nearly matches React, whose own numbers dip. The same pattern holds — more strongly — for the top 100,000 origins, where Vue slightly surpasses React. (Narrower cuts lose statistical significance as framework sample sizes shrink.) One explanation consistent with the trend: high-traffic sites are more likely built by teams with deeper framework expertise and better performance-oriented infrastructure.
The more puzzling direction is React’s: more experienced engineering setups producing worse outcomes? That suggests something structural about how high-traffic React sites are assembled, not the framework itself.
Breaking Down by Metric
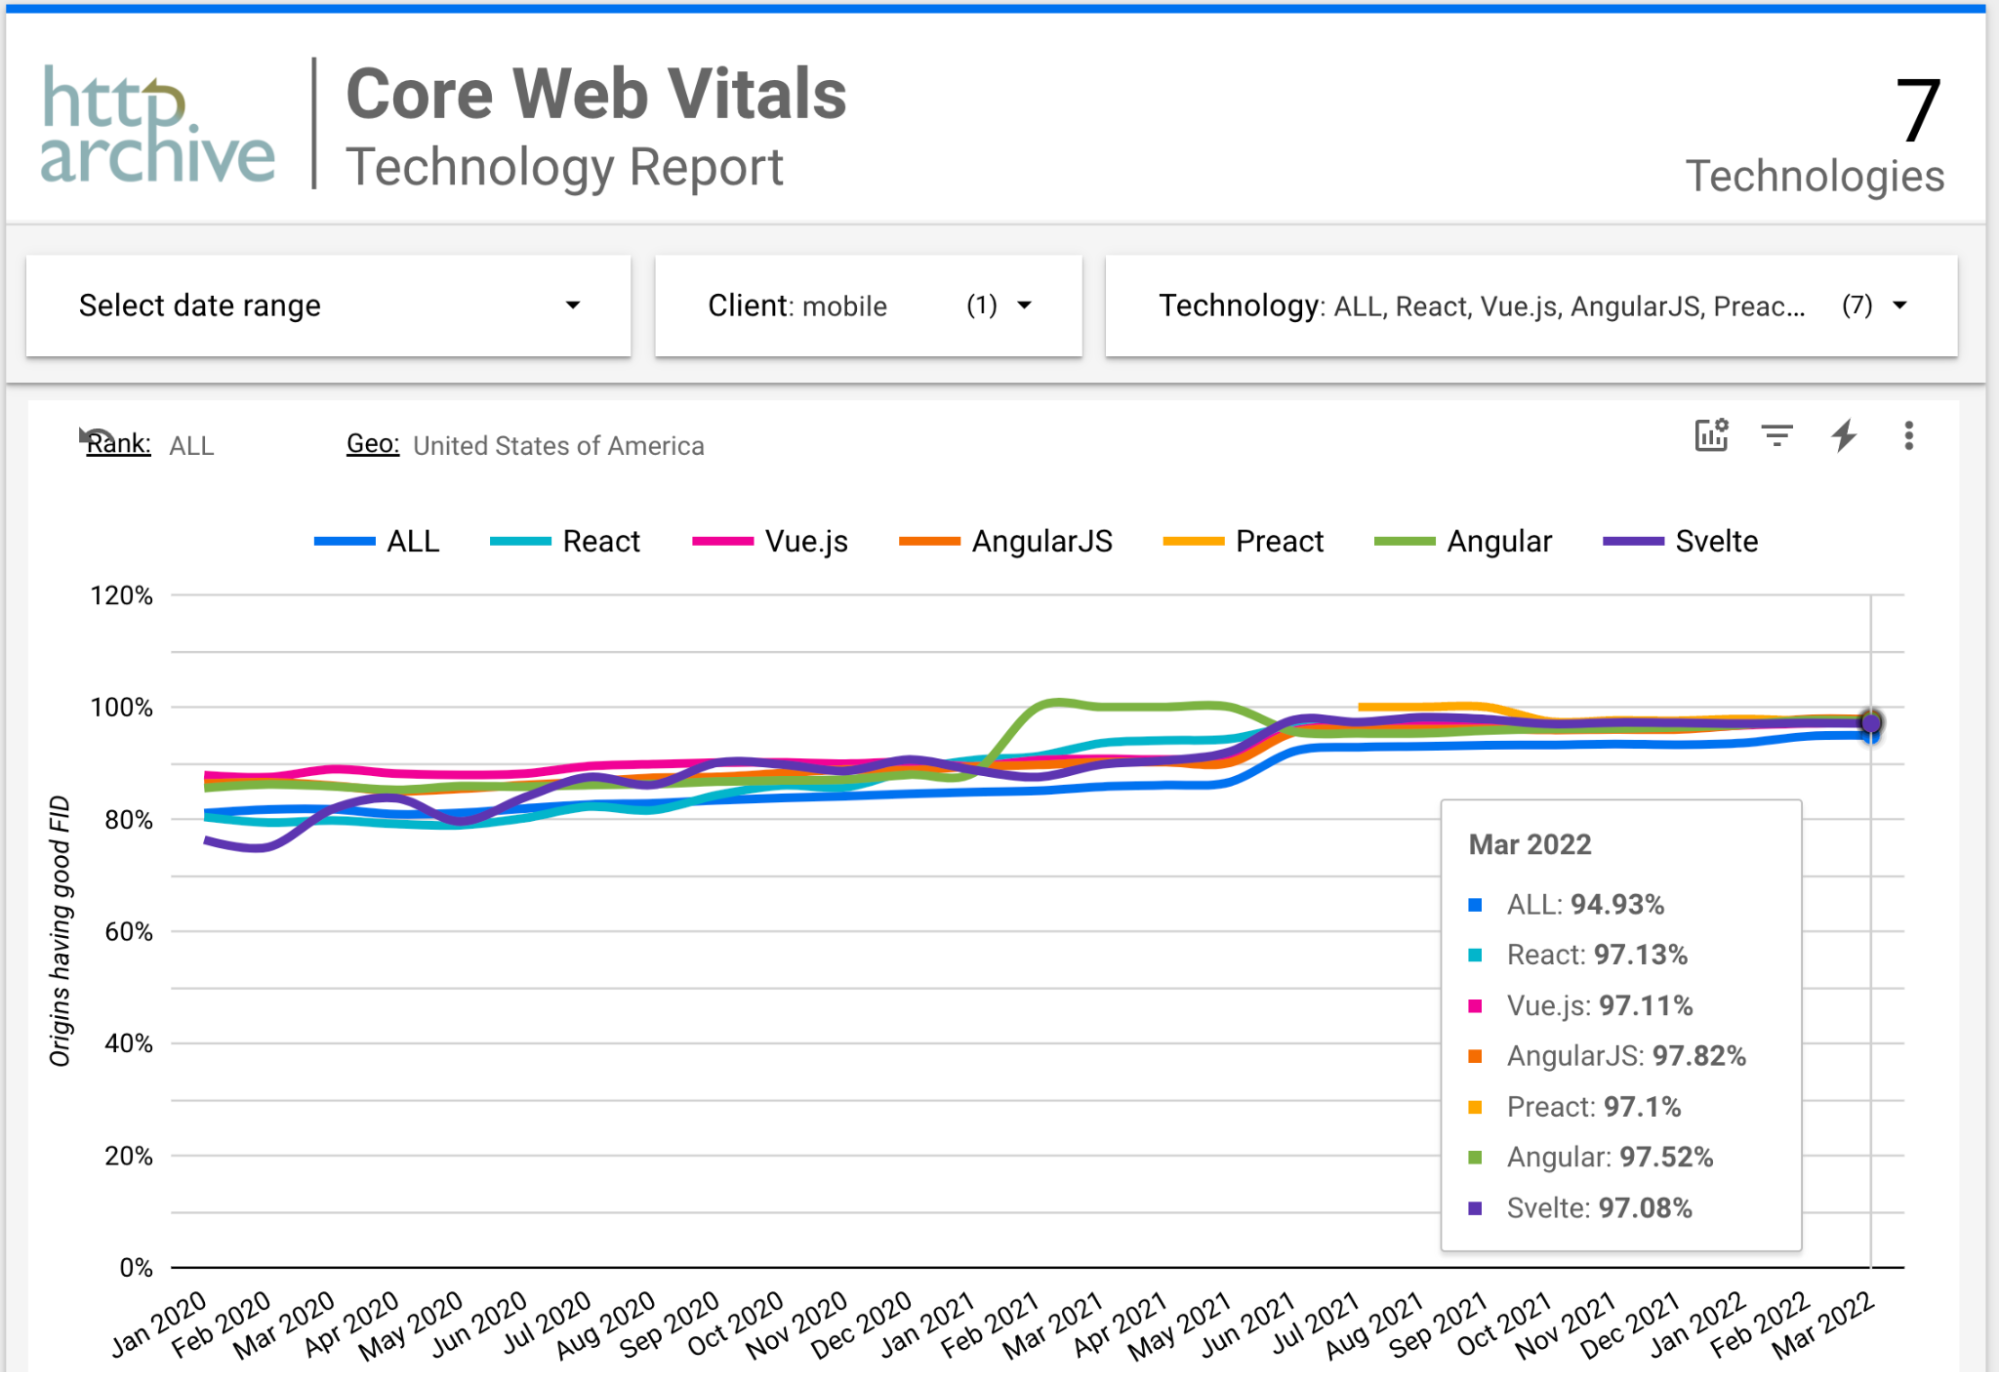
Examining each Core Web Vital separately clarifies where the differences originate. FID shows almost no separation — every framework, and the ALL baseline, sits at an essentially perfect good ratio. The metric is currently too coarse to discriminate.
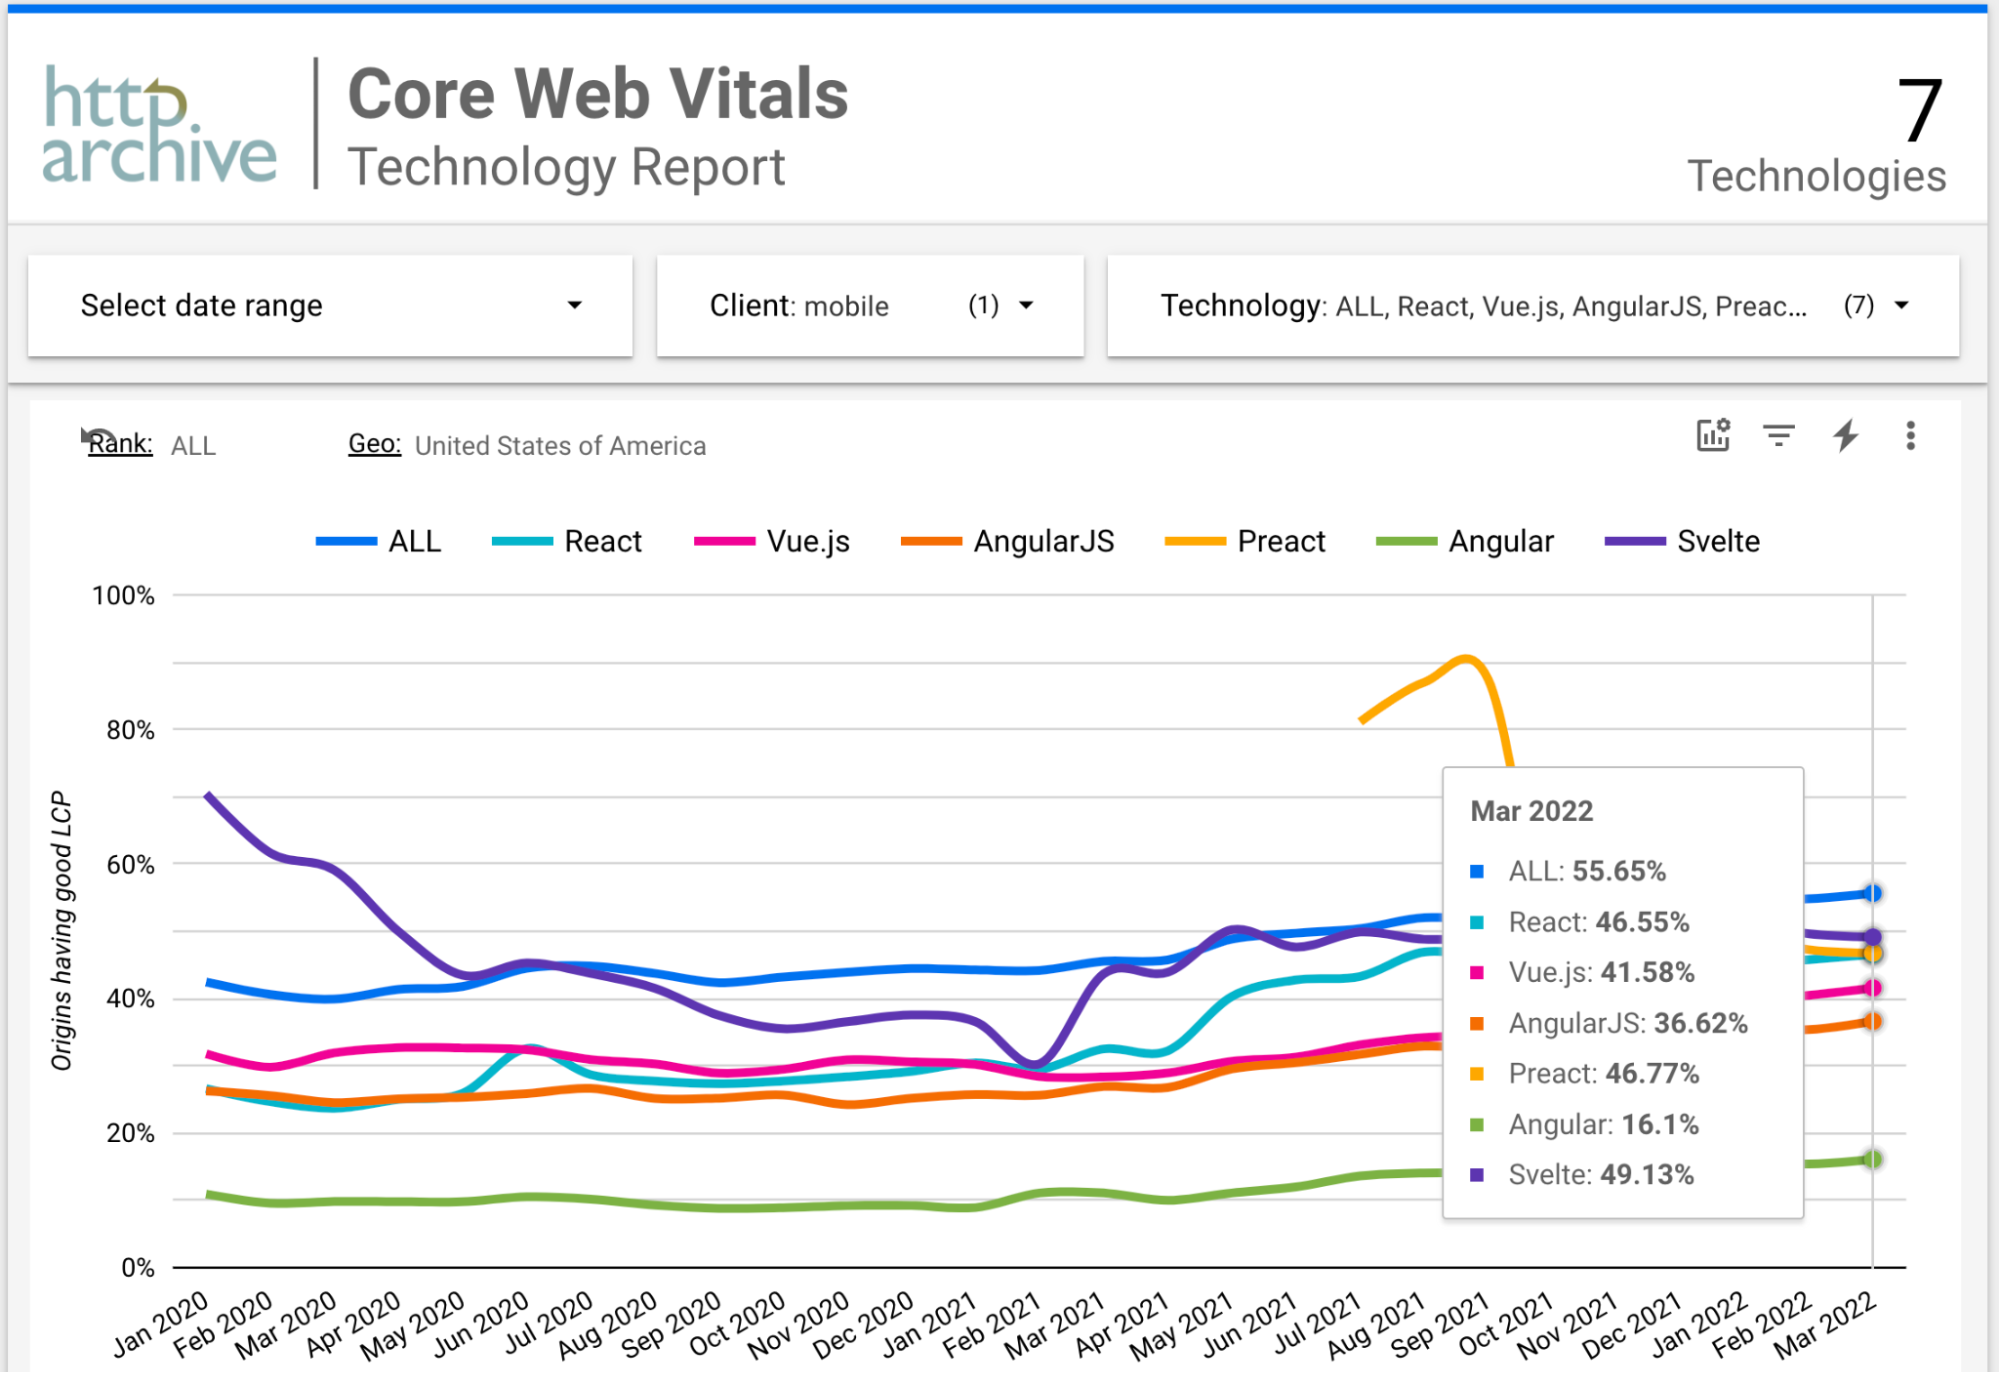
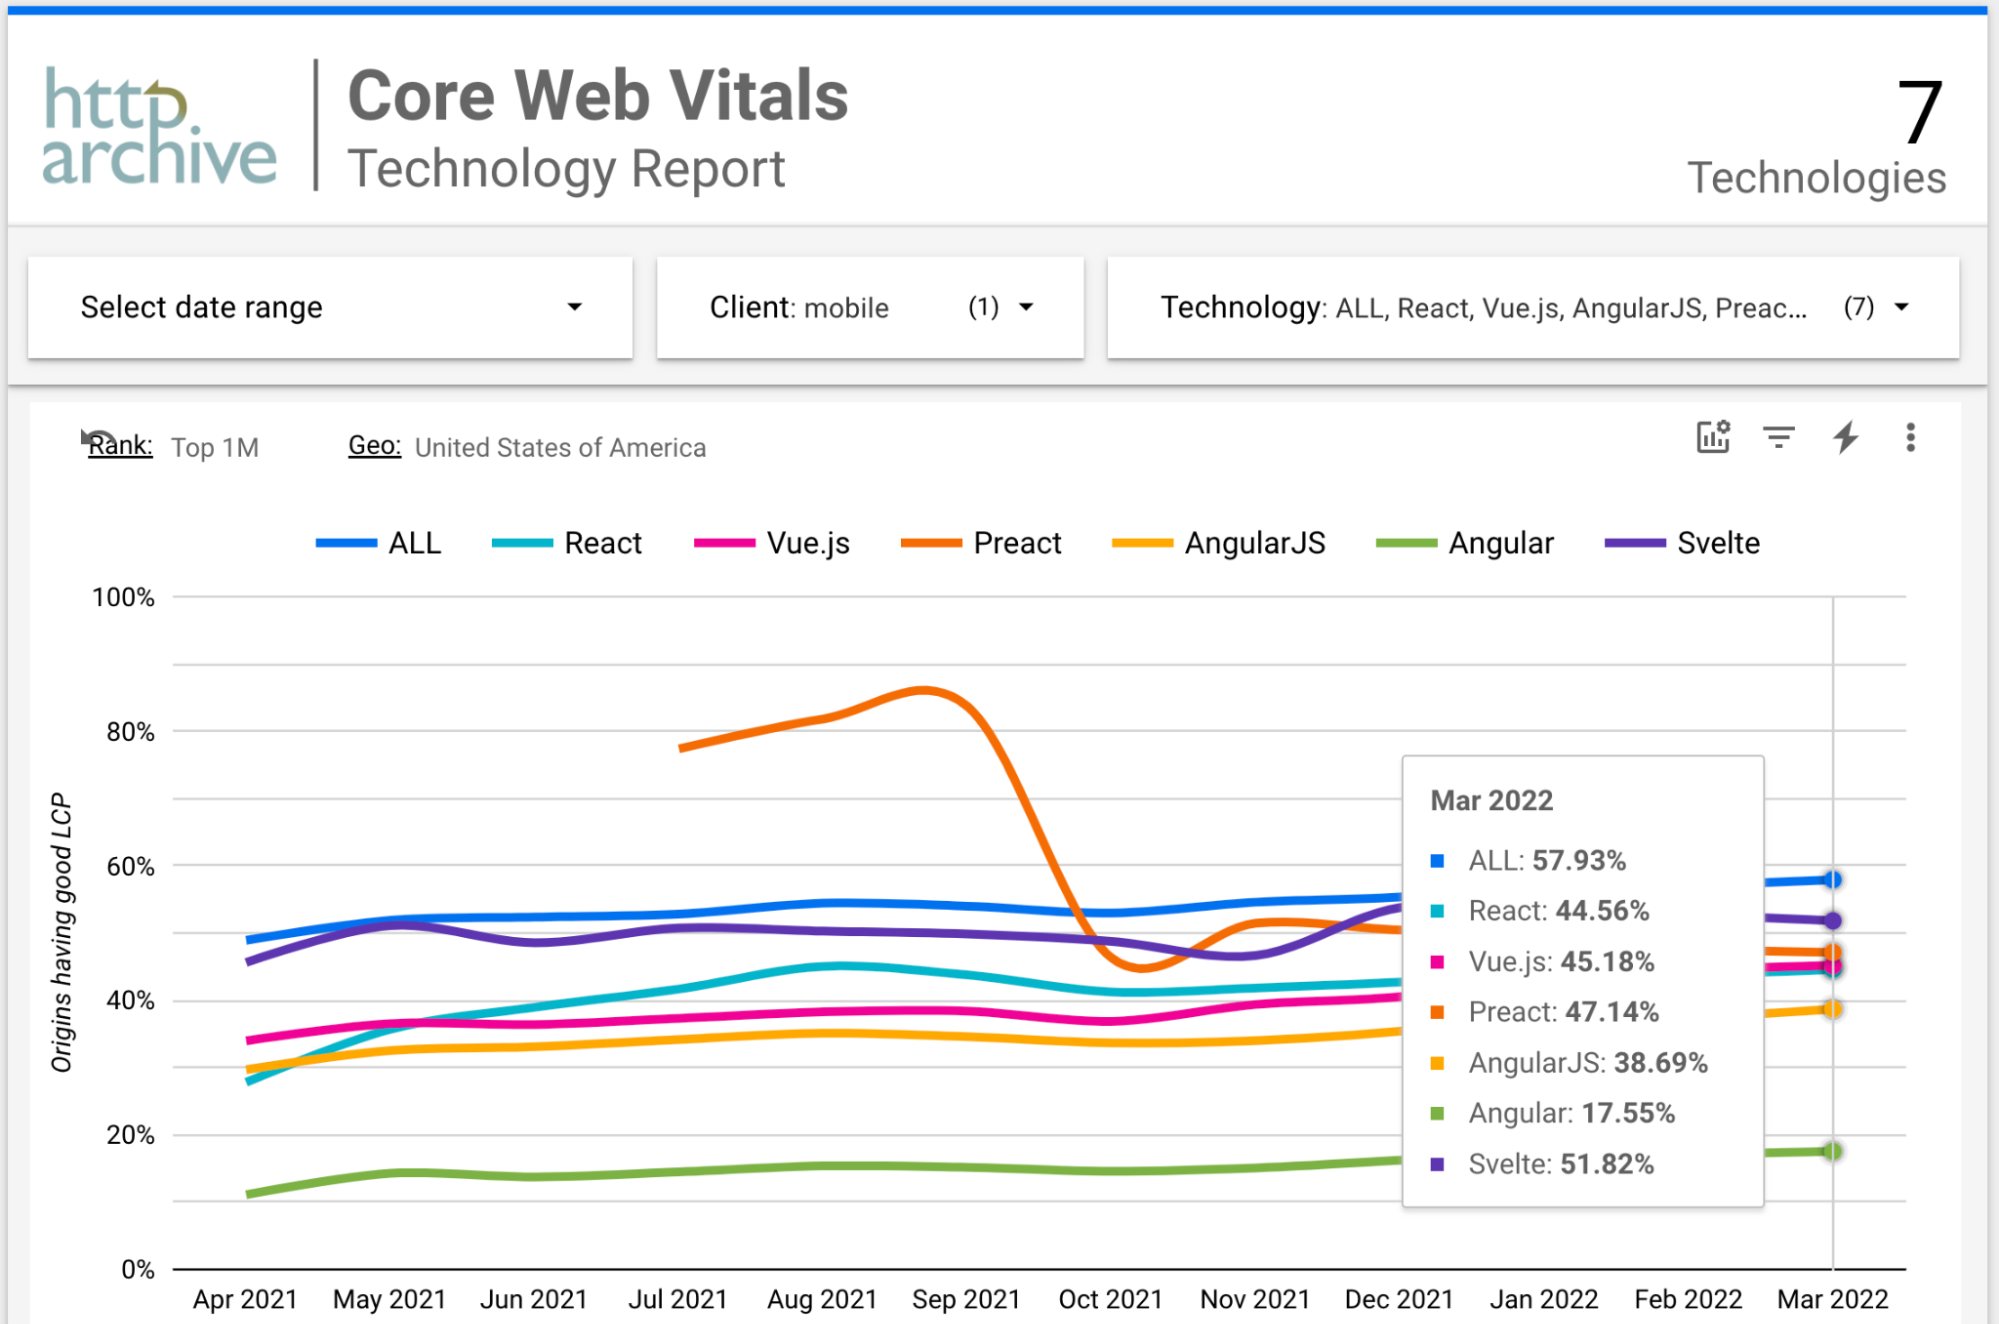
LCP tells a more interesting story. On the full dataset, ALL, React, Preact and Svelte all trend roughly 10% higher than Vue and AngularJS. For the top 1,000,000 sites, Preact and Svelte improve further while React stays flat, letting Vue catch up.
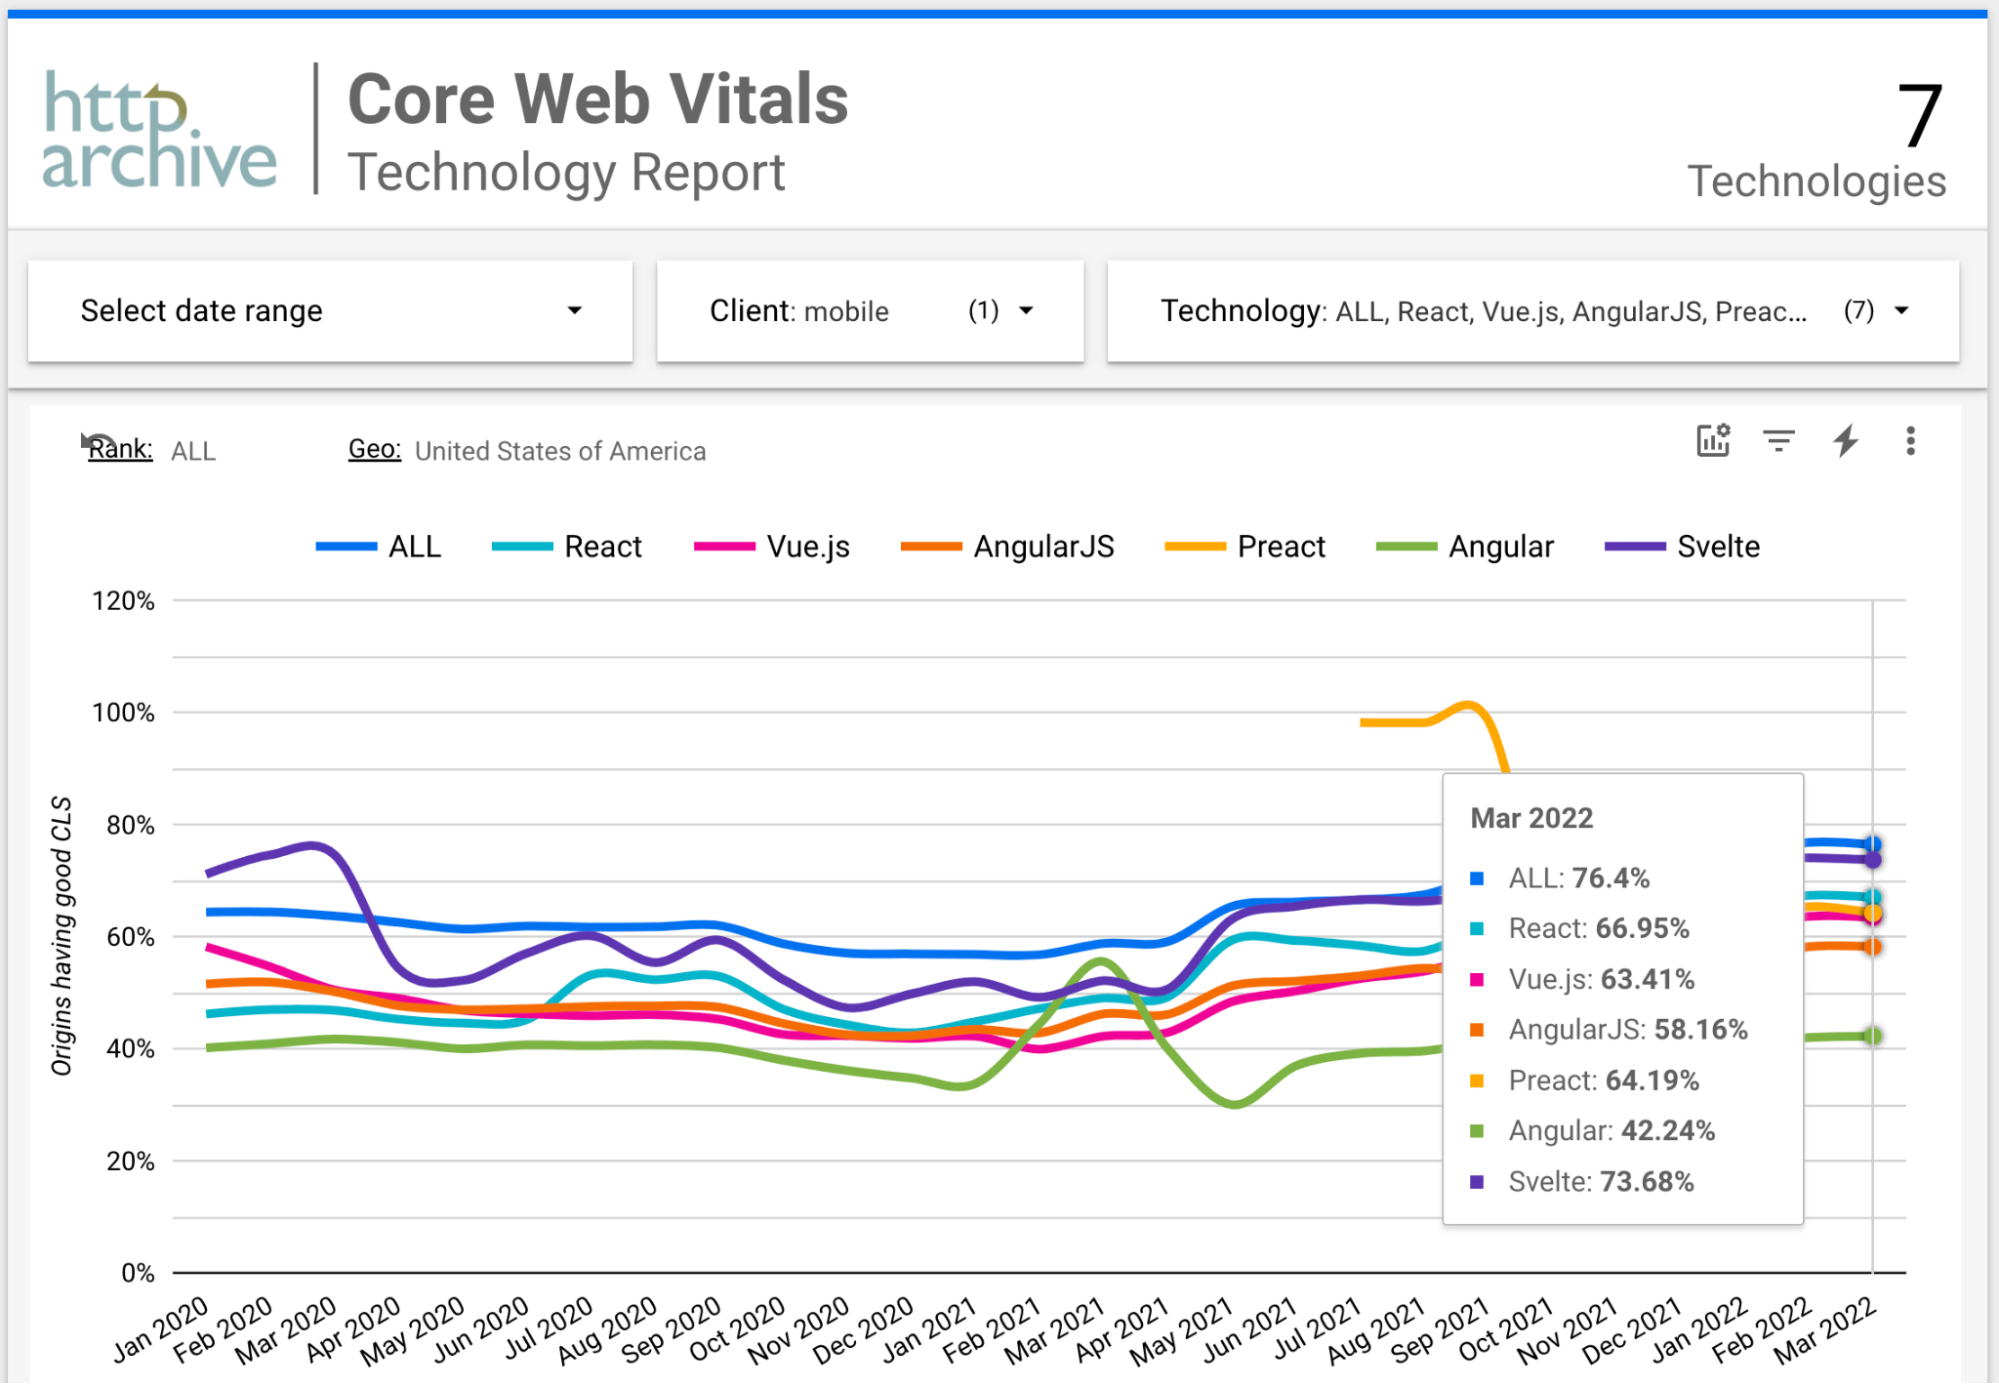
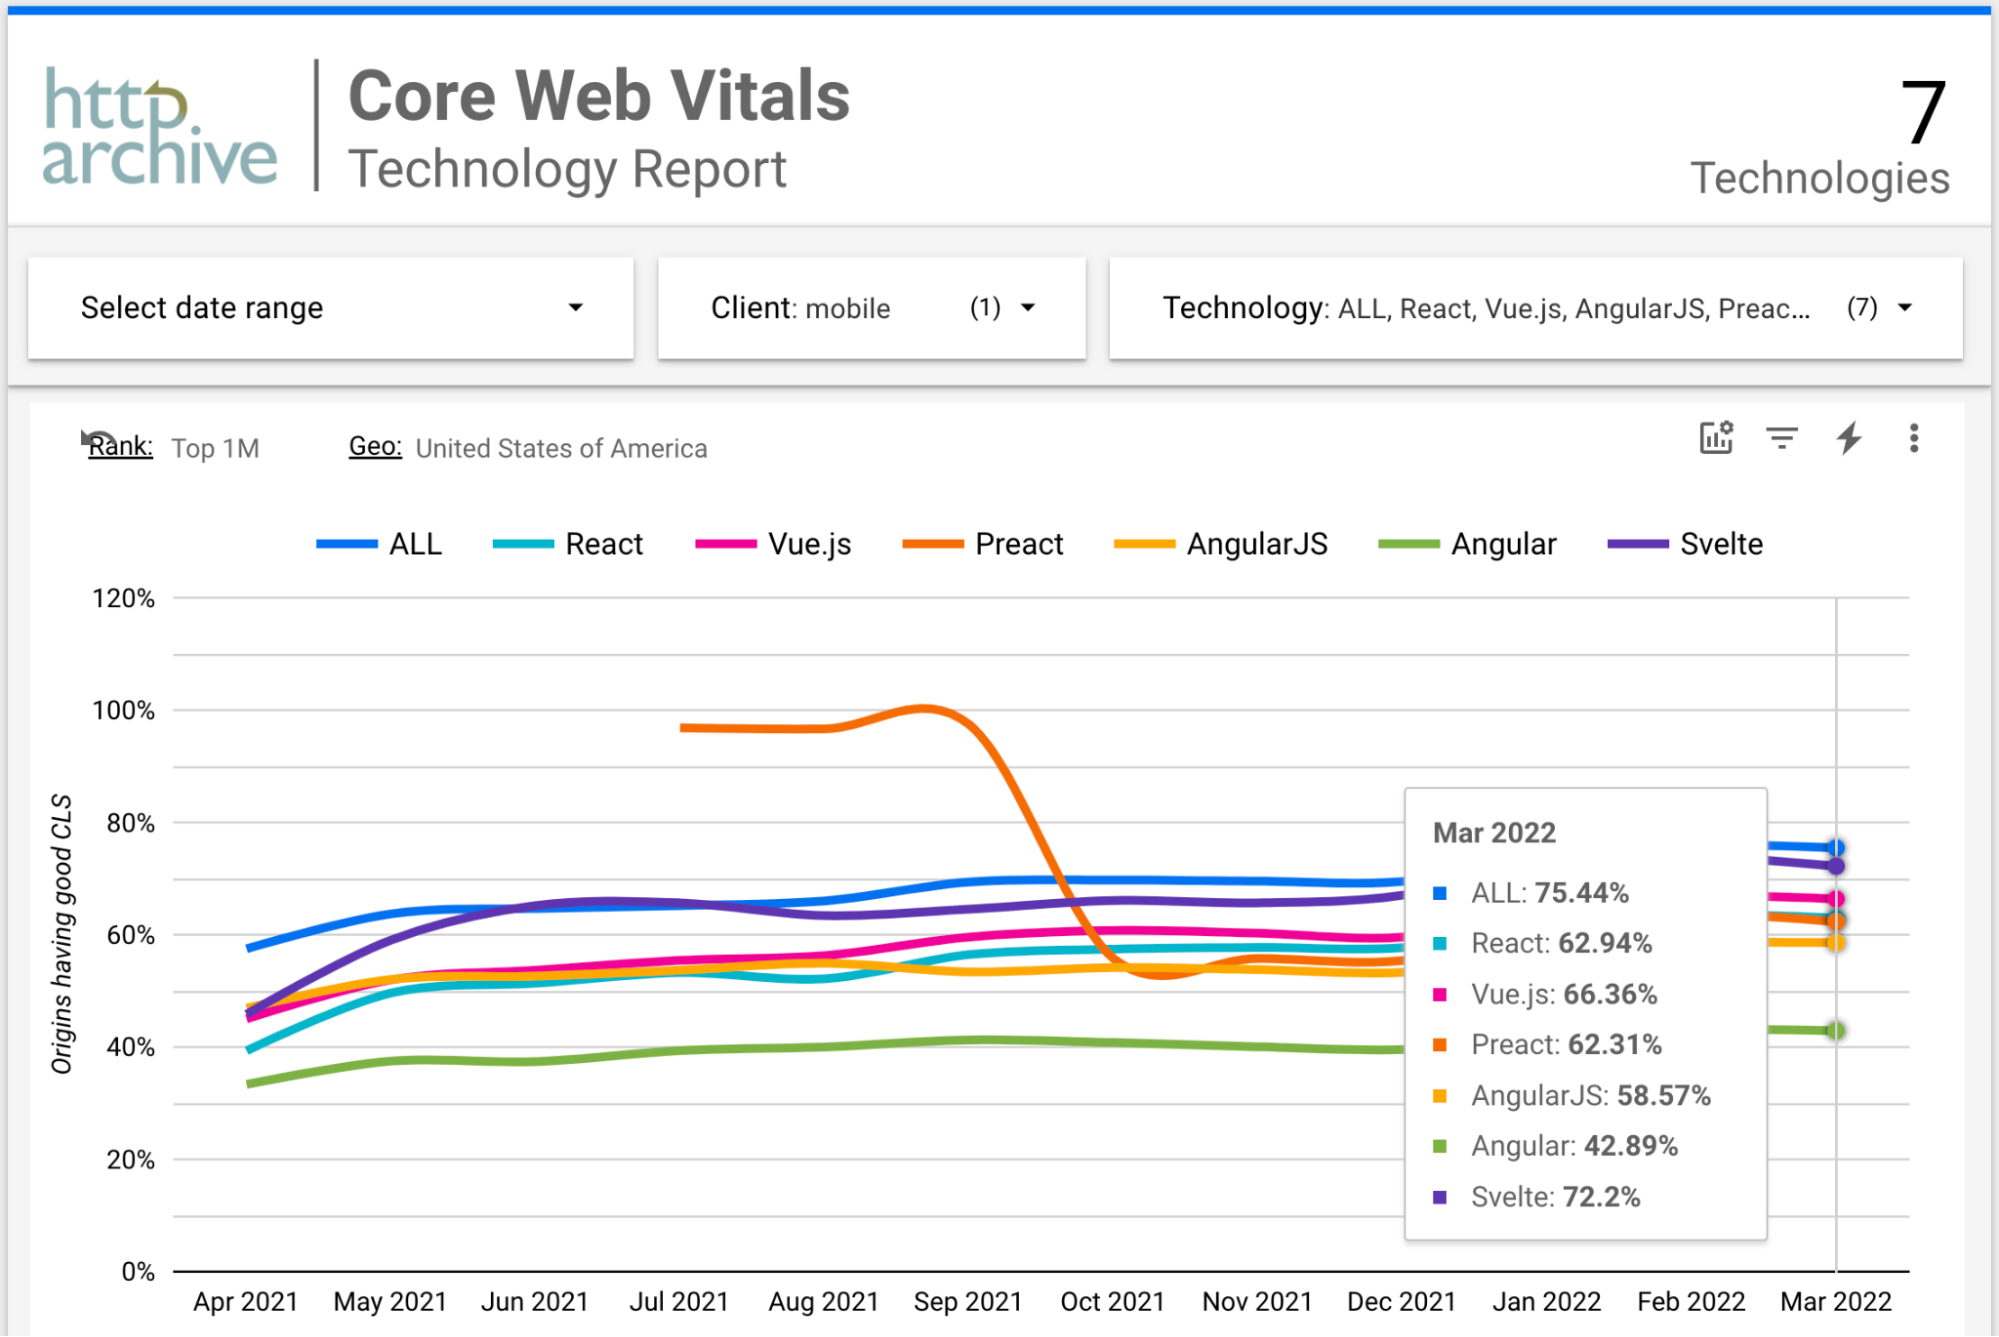
CLS, on the other hand, is where React degrades markedly at the top-1M cutoff, and Preact to a smaller degree. Vue ends up ahead of both. Taken together, Vue’s improvement among top sites comes from gains in both LCP and CLS, while React’s decline is driven almost entirely by CLS.
That CLS signature initially suggests advertising: late-loading ads push content down and worsen layout shift. But that explanation fails on two counts. It doesn’t account for why React and Vue diverge so cleanly, and ad-related shift would more likely drag LCP down as well — which it doesn’t. To find the real difference, other angles of the Technology Report need attention.
Server-Side Rendering and Static Generation
Framework choice alone does not determine delivery strategy. A React app can be pre-rendered to static HTML by Gatsby, server-rendered by NextJS or RemixJS, or shipped as a client-only SPA. The Technology Report allows separating these approaches from the framework itself, which matters because page delivery mechanics affect Core Web Vitals far more than the framework’s runtime size does.
One frequently cited assumption is that frameworks cost performance mostly through extra bytes and slower interactivity. In practice, the delivery mode — how the first response reaches the browser and how much HTML it carries — has a much larger influence on all three metrics, particularly LCP and CLS.
The React CLS Puzzle
To isolate React’s CLS drop at the top of the traffic rankings, the report’s other dimensions are more useful than the raw framework comparison. Looking at React sites that are further segmented by additional technologies shows where layout-shift risk concentrates.
A key candidate is hydration. Client-side hydration after initial HTML paint can cause layout shift when components mount and render content that pushes the page down.
Yet advertising placement remains a strong suspect for CLS-heavy origins: many top-traffic sites run ad networks, especially news and publishing sites which tend to request mobile ads at various page positions. Those ad containers, unless their dimensions are explicitly constrained, shift surrounding content on arrival. React’s popularity in that content-heavy publishing space could correlate with CLS-heavy pages.
The report also permits filtering by origin popularity tier, which shows that among the top 1M origins, the React CLS dip is consistent. That consistency hints the problem is structural to how React occupies these sites at scale, not merely noise from a subset of ad-heavy pages.
Framework Performance is Delivery Performance
Jason Miller, Preact’s creator, recently summarized a similar point clearly:
Preact isn't associated with any specific SSR or serving solutions, which dominate the impact on CWV. While Preact usage may have some correlation to CWV (really only FID), it is nowhere near as direct as tech choices involved in page delivery.
That observation applies to every framework in this comparison. The frameworks examined here matter, but they are not the strongest lever on field performance. Server-rendering decisions, hosting, image handling, third-party scripts and ad delivery all dominate the actual CWV ratios. Framework choice influences them, but the current field data more directly rewards how content reaches the browser and how stable its page layout remains than which front-end library produced the markup.
The remaining anomaly — React’s CLS dip among top-traffic origins — is not explained by the framework code. The evidence points instead to a composite effect: higher-traffic React sites increasingly include third-party content that destabilizes layout, and they are less likely to restructure around a different rendering model merely for layout stability.
For developers choosing between frameworks, the field data provides a reference point, not a verdict. Vue’s improvement among top sites suggests that expertise and infrastructure can offset framework overhead. React’s CLS divergence signals that architectural conventions around embedding third-party content carry real measurement weight. Choosing a framework is still only a small part of choosing a web architecture that performs well in the field.
JavaScript Payloads Across Frameworks
The Technology Report also captures resource download sizes, which matter because JavaScript must be downloaded, parsed and executed. Comparing the median JavaScript payloads across frameworks shows a predictable pattern:
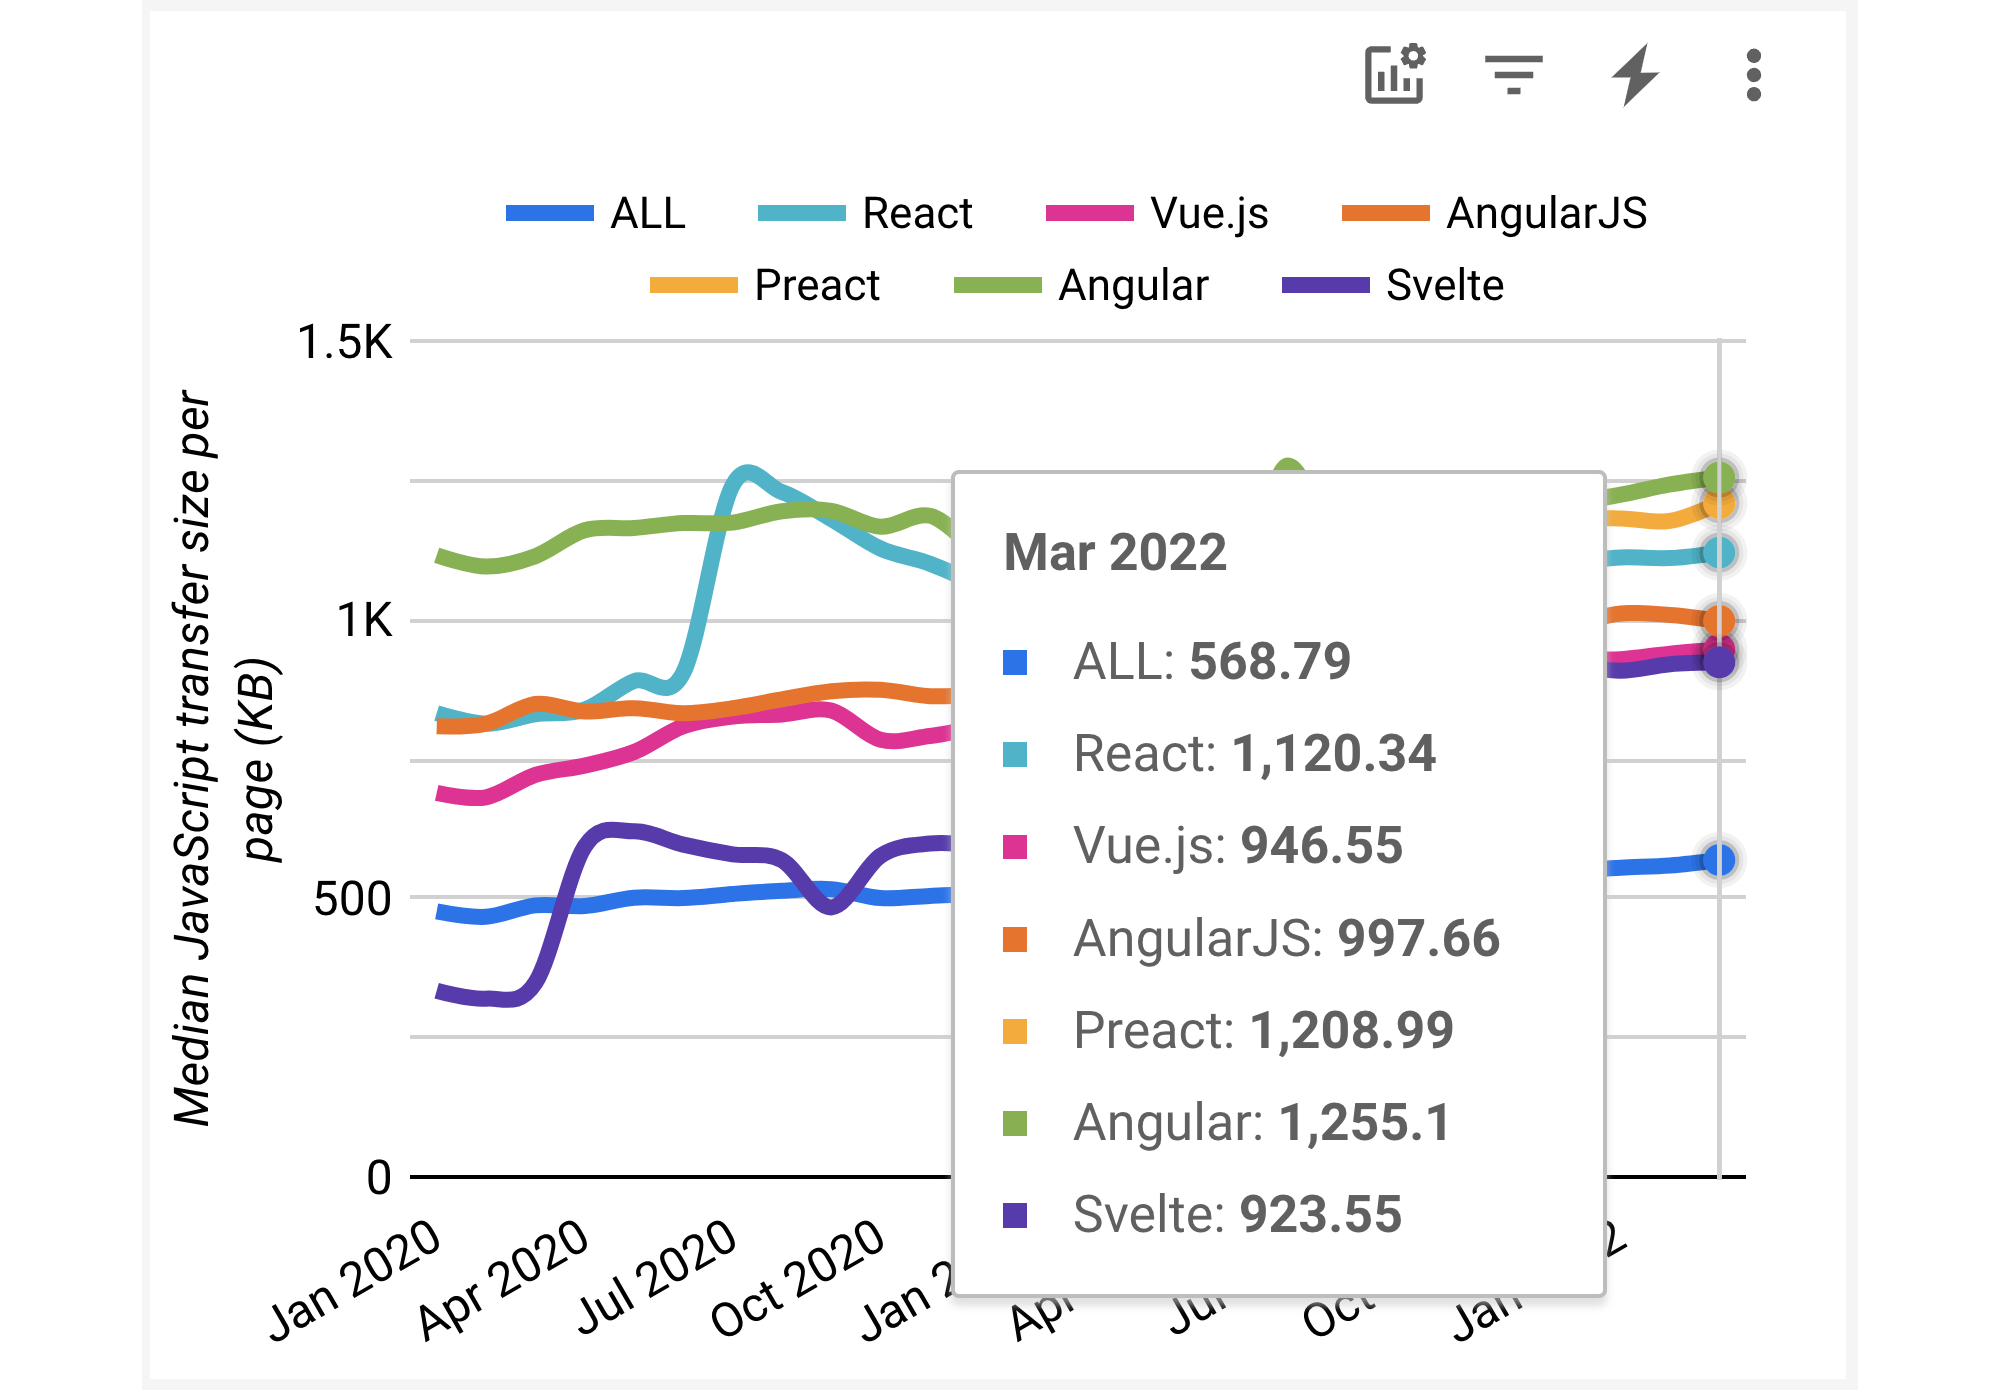
Frameworks, as expected, ship significantly more JavaScript than the average website, largely due to SPA functionality like routing and client-side rendering. Svelte sites download the least JavaScript of any framework examined here, thanks to the Svelte compiler moving much work to build time that other frameworks handle at run time. Svelte developers may also place a higher premium on lean pages.
Yet the 226KB gap between the median Svelte site and the median React site translates to only a 2.4% increase in sites with good Core Web Vitals (CWV). Browsers have clearly gotten better at handling larger JavaScript payloads, for instance by parsing off the main thread during download. Caching in both browsers and CDNs likely contributes as well.
Notably, Preact sites download more JavaScript than React sites. If teams chose Preact to reduce weight, the application code itself appears to offset any framework-level savings. This may explain why Preact showed no meaningful CWV advantage over React earlier.
Restricting the analysis to the top 1,000,000 sites reveals larger JavaScript footprints across the board, with one exception:
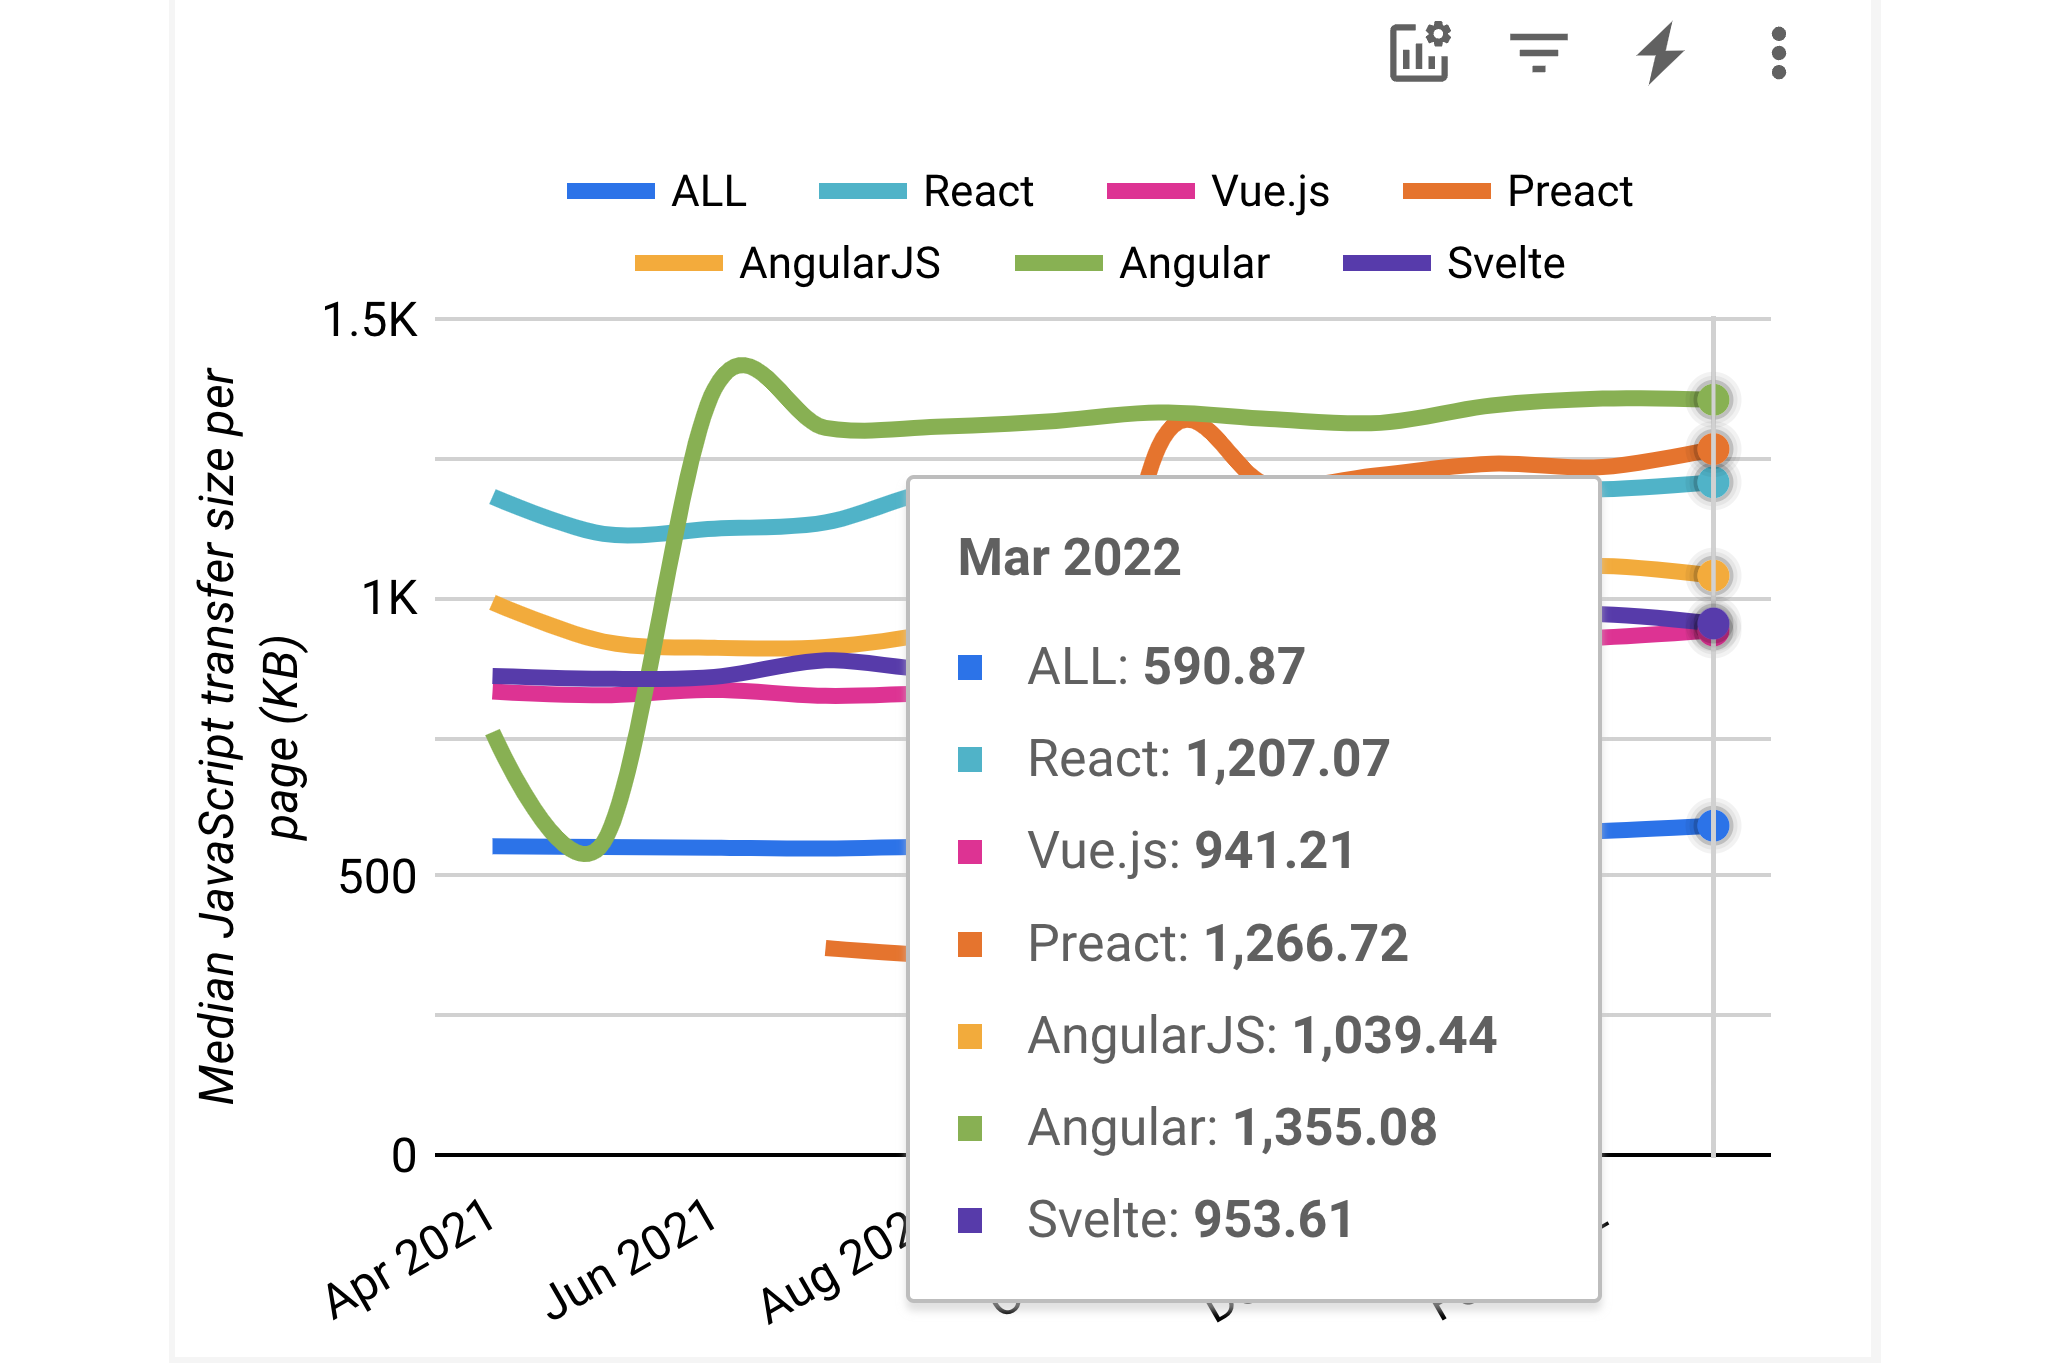
Vue is the only framework where top-site JavaScript sizes do not increase. That may explain Vue’s significant CWV improvement at the top of the rankings. For the other frameworks, whatever additional expertise top-site developers bring does not translate into smaller JavaScript; the opposite holds, likely due to extra features on those pages.
Image Download Sizes
Comparing image payloads yields another angle on performance:
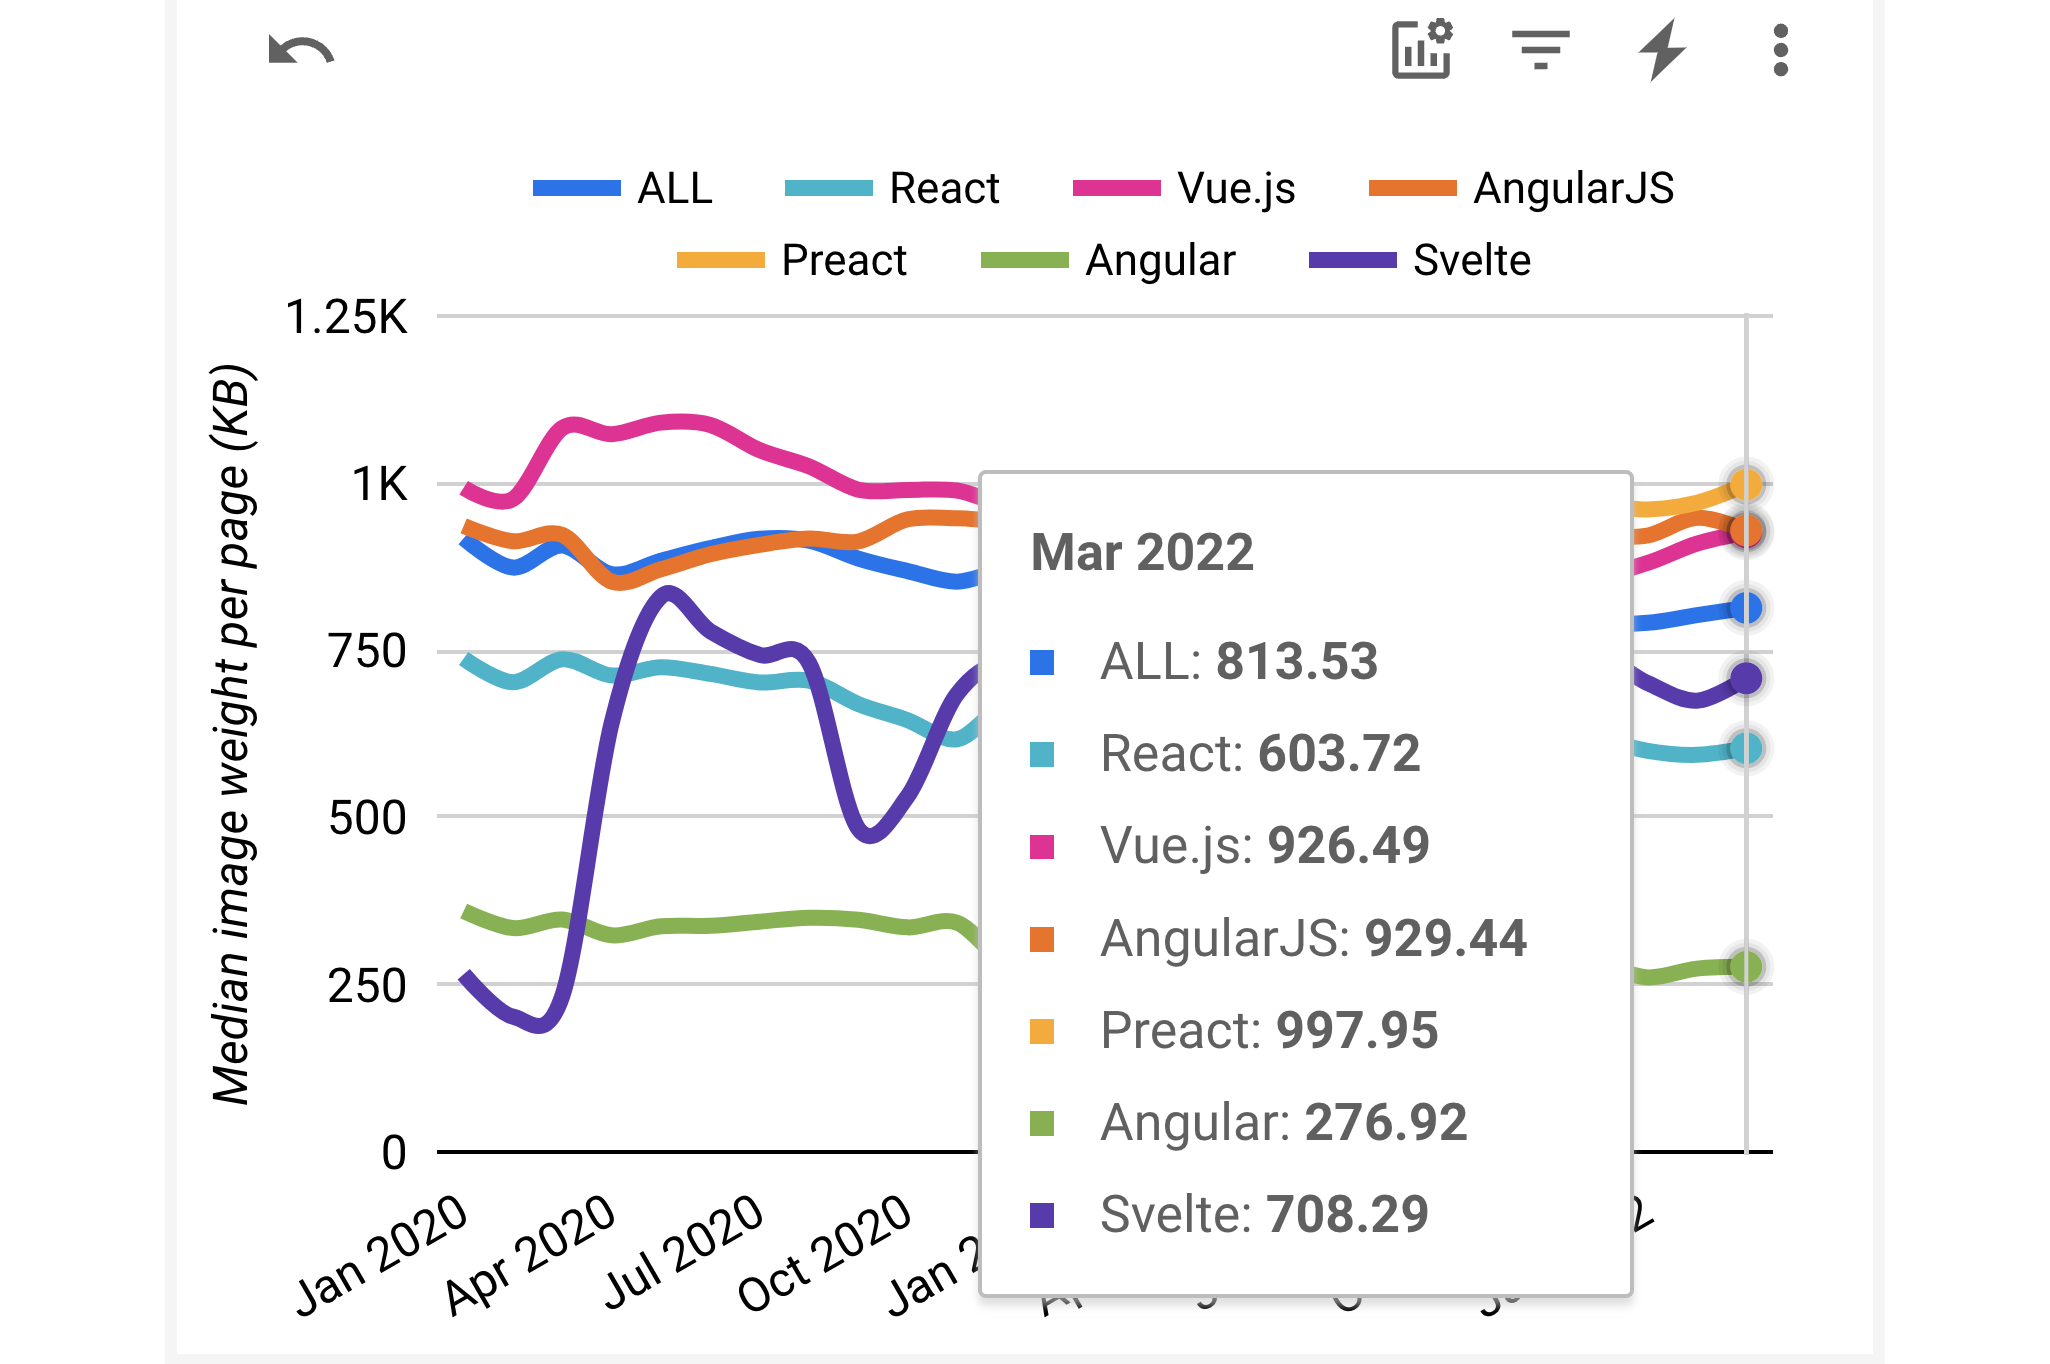
React, Svelte and Angular sites all download notably less image data than the web overall, suggesting broader adoption of lazy loading and modern image formats. Angular stands out as downloading the least image data of any framework.
Among the top sites, image downloads rise substantially across every framework:
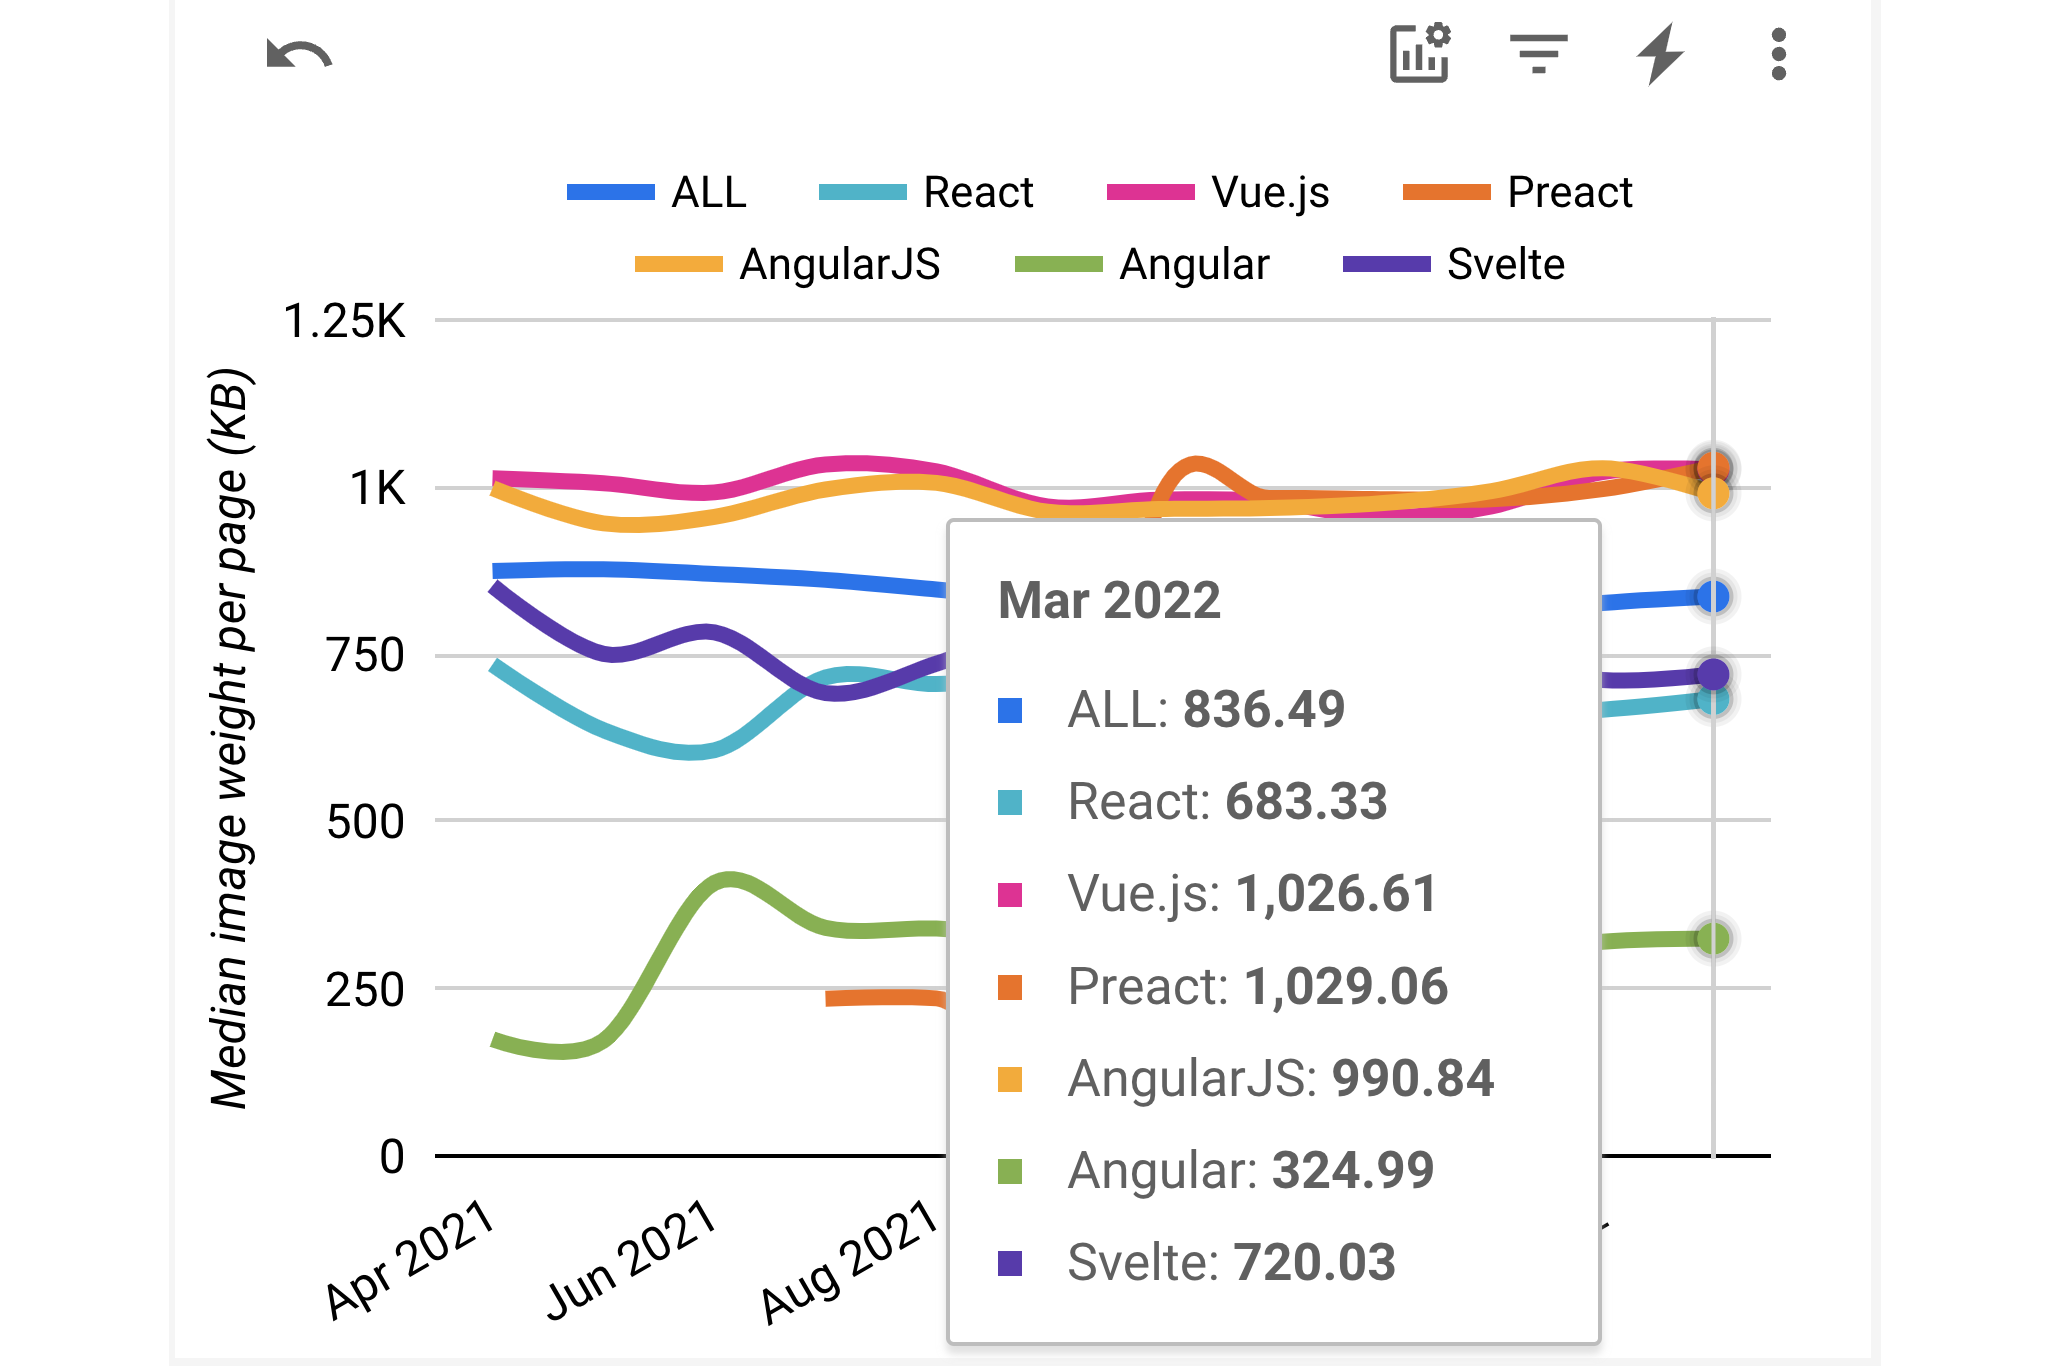
Top sites tend to be more content-rich. They also carry more ads, which are primarily images — and other factors discussed below may play a role as well.
SSR And SSG Effects
Delivery choices have the largest impact on CWV metrics, particularly LCP. Server-Side Rendering (SSR) and Static Site Generation (SSG) deliver contentful HTML immediately, letting browsers paint before client-side rendering would produce visuals — especially when that HTML is cached in CDNs or the browser. Implementing this infrastructure manually with a JavaScript framework is hard, which has driven the rise of web application frameworks that bake in SSR or SSG support.
The expectation, then, is that sites built on these meta-frameworks should show better CWV ratios than sites using the underlying framework or library directly. The Core Web Vitals Technology Report allows a direct comparison:
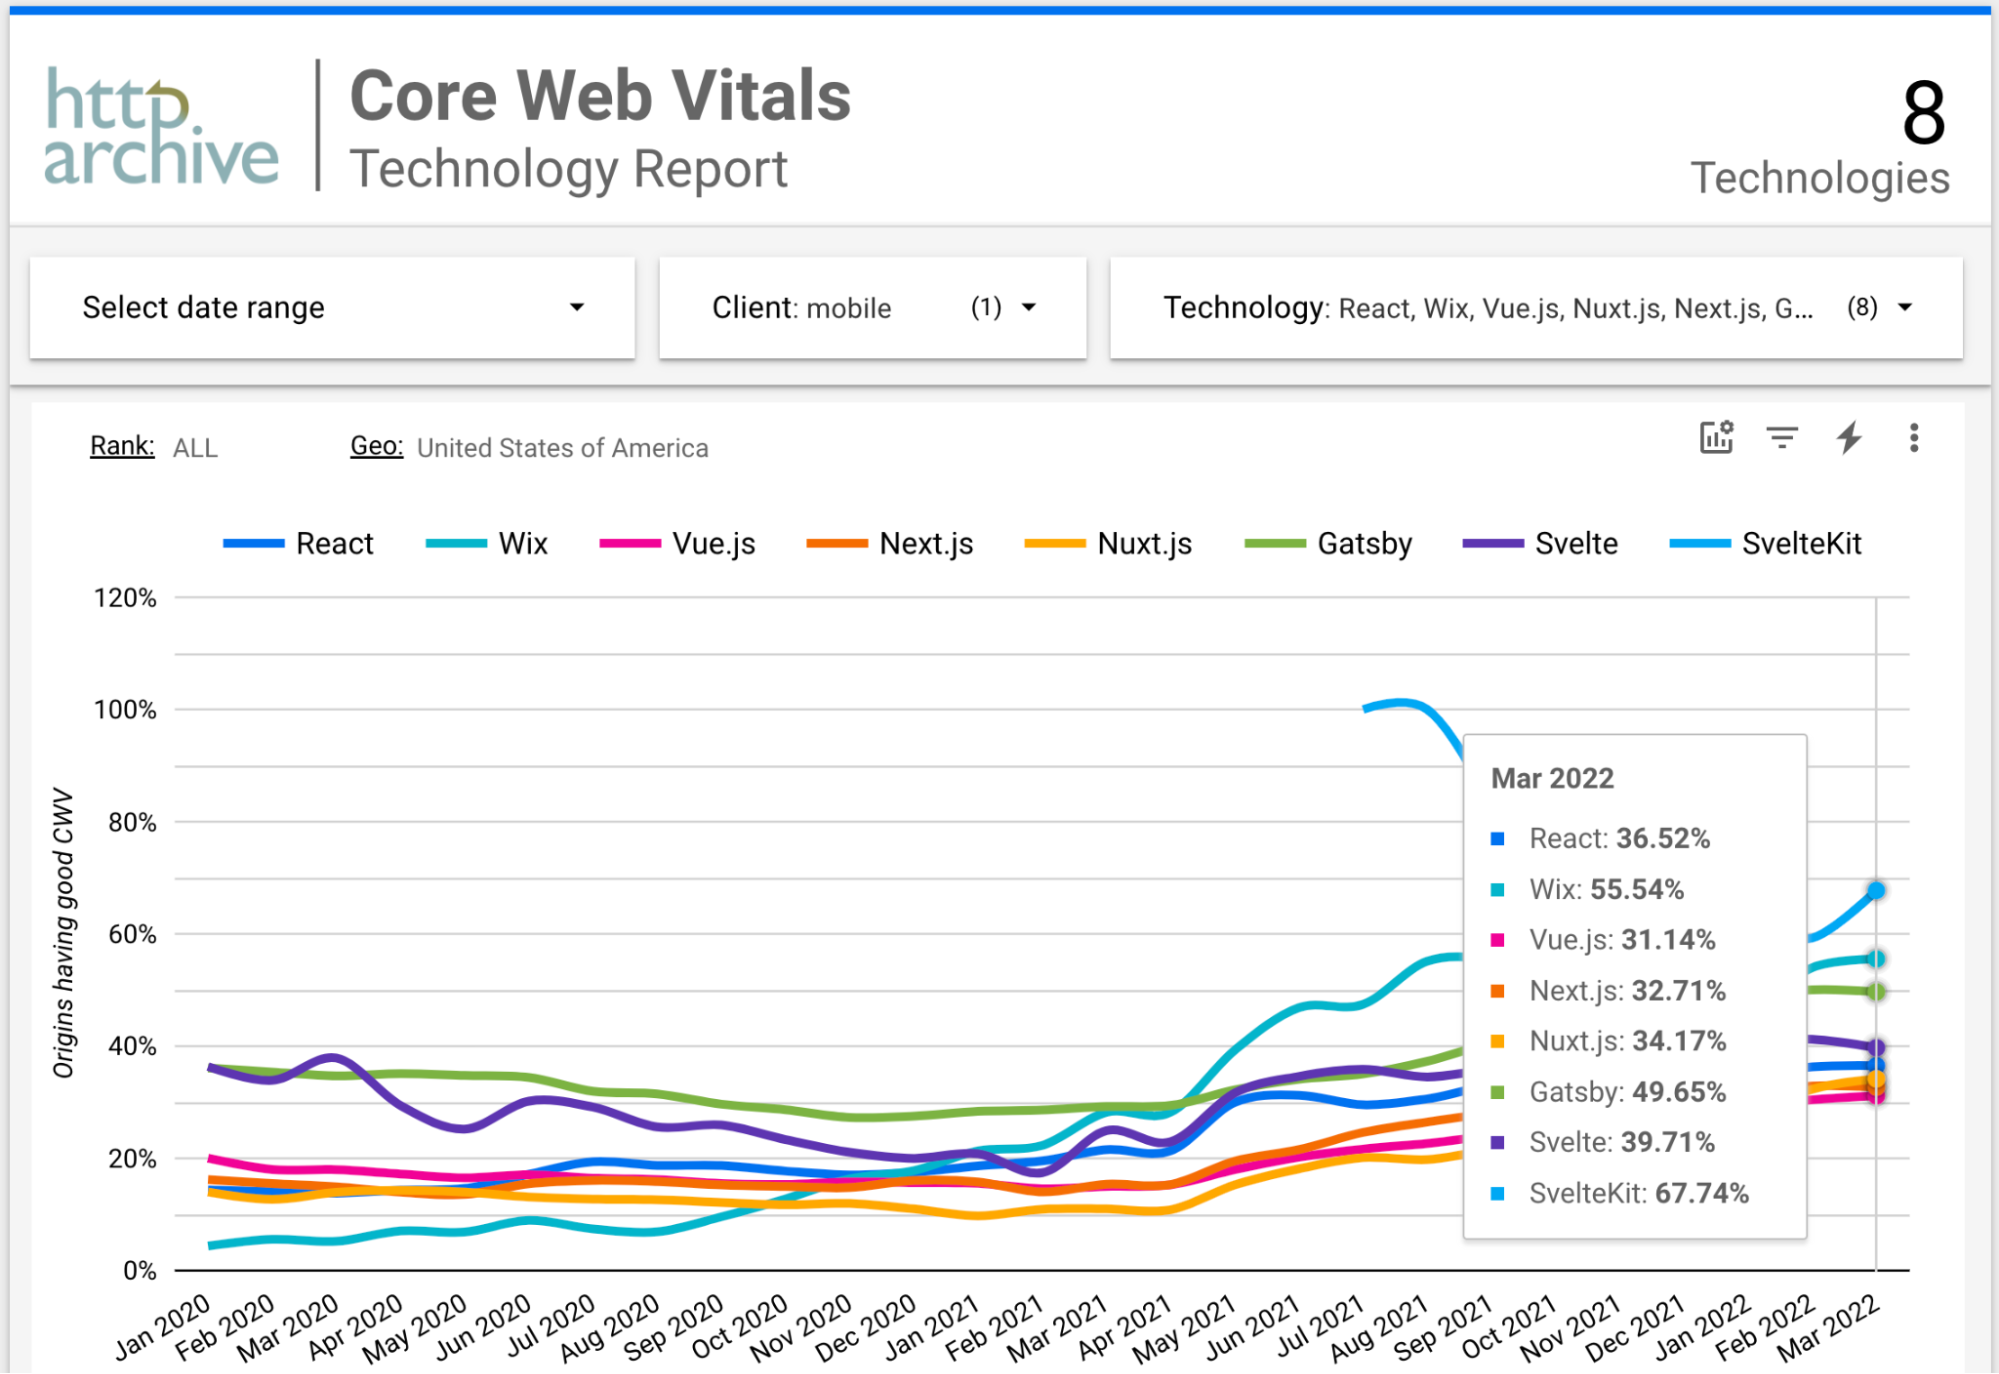
SvelteKit leads by a wide margin. However, only 33 sites in the dataset use SvelteKit — far too few for firm conclusions, though worth watching as adoption grows.
Gatsby indeed outpaces React overall. Next.js does not. Nuxt.js beats Vue but still trails React. The surprise entry here is Wix: it is built on React, so every Wix site counts as a React site, whether or not a developer writes React code. Wix uses SSR and CDNs like Next.js and Gatsby, and it posts a higher good-performance ratio than either.
The composition of React sites matters greatly:
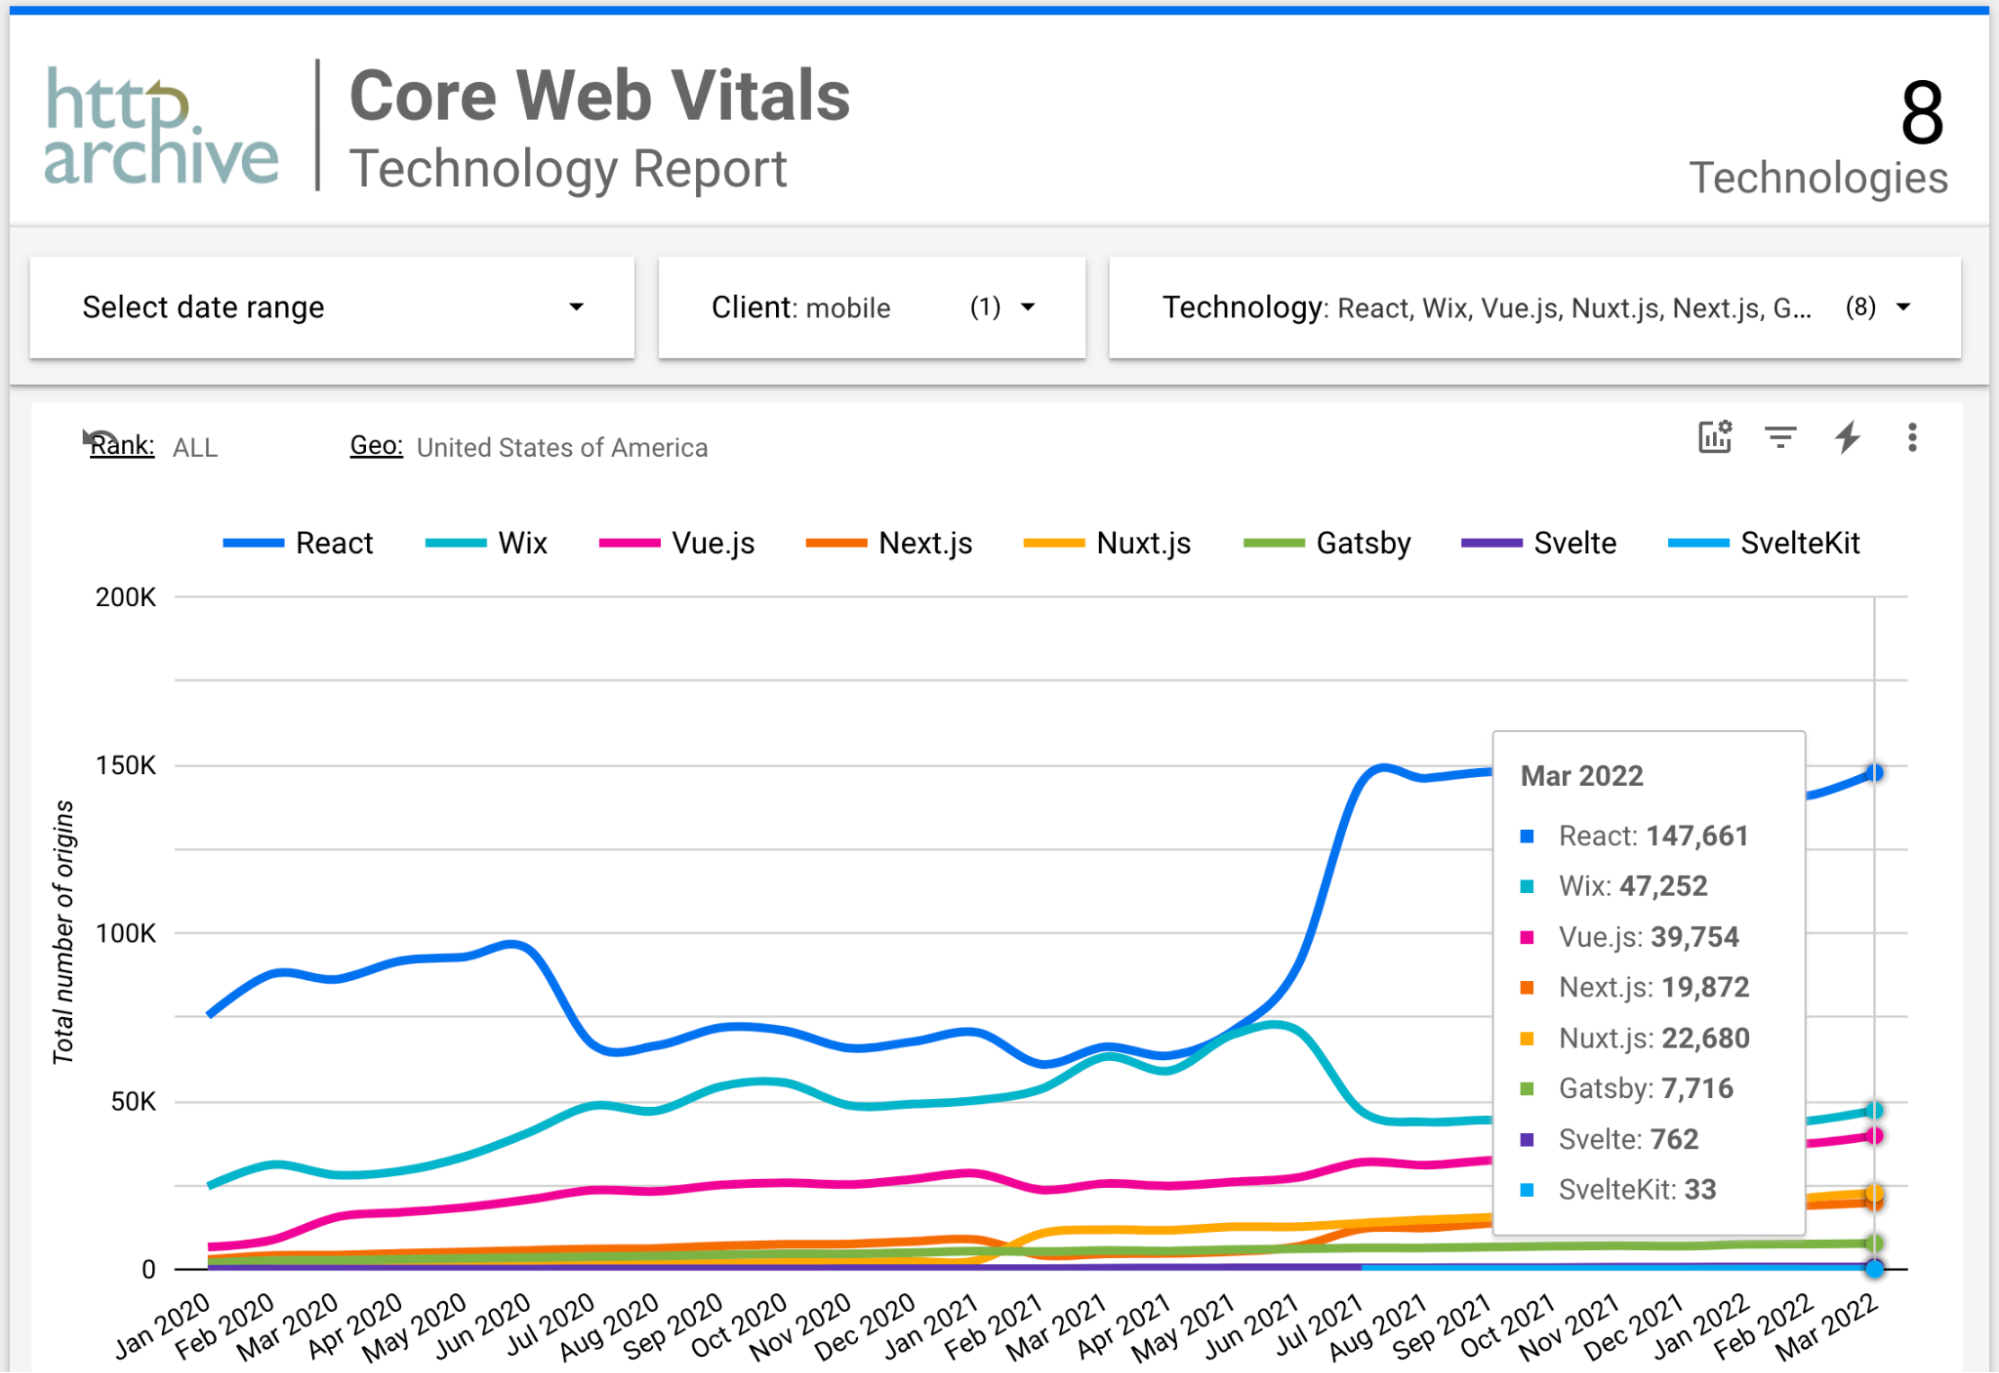
Roughly a third of React sites in the USA are Wix sites. Because Wix performs better than the average React site, it actually raises React’s overall numbers.
Among the top 1,000,000 US sites, the mix shifts:
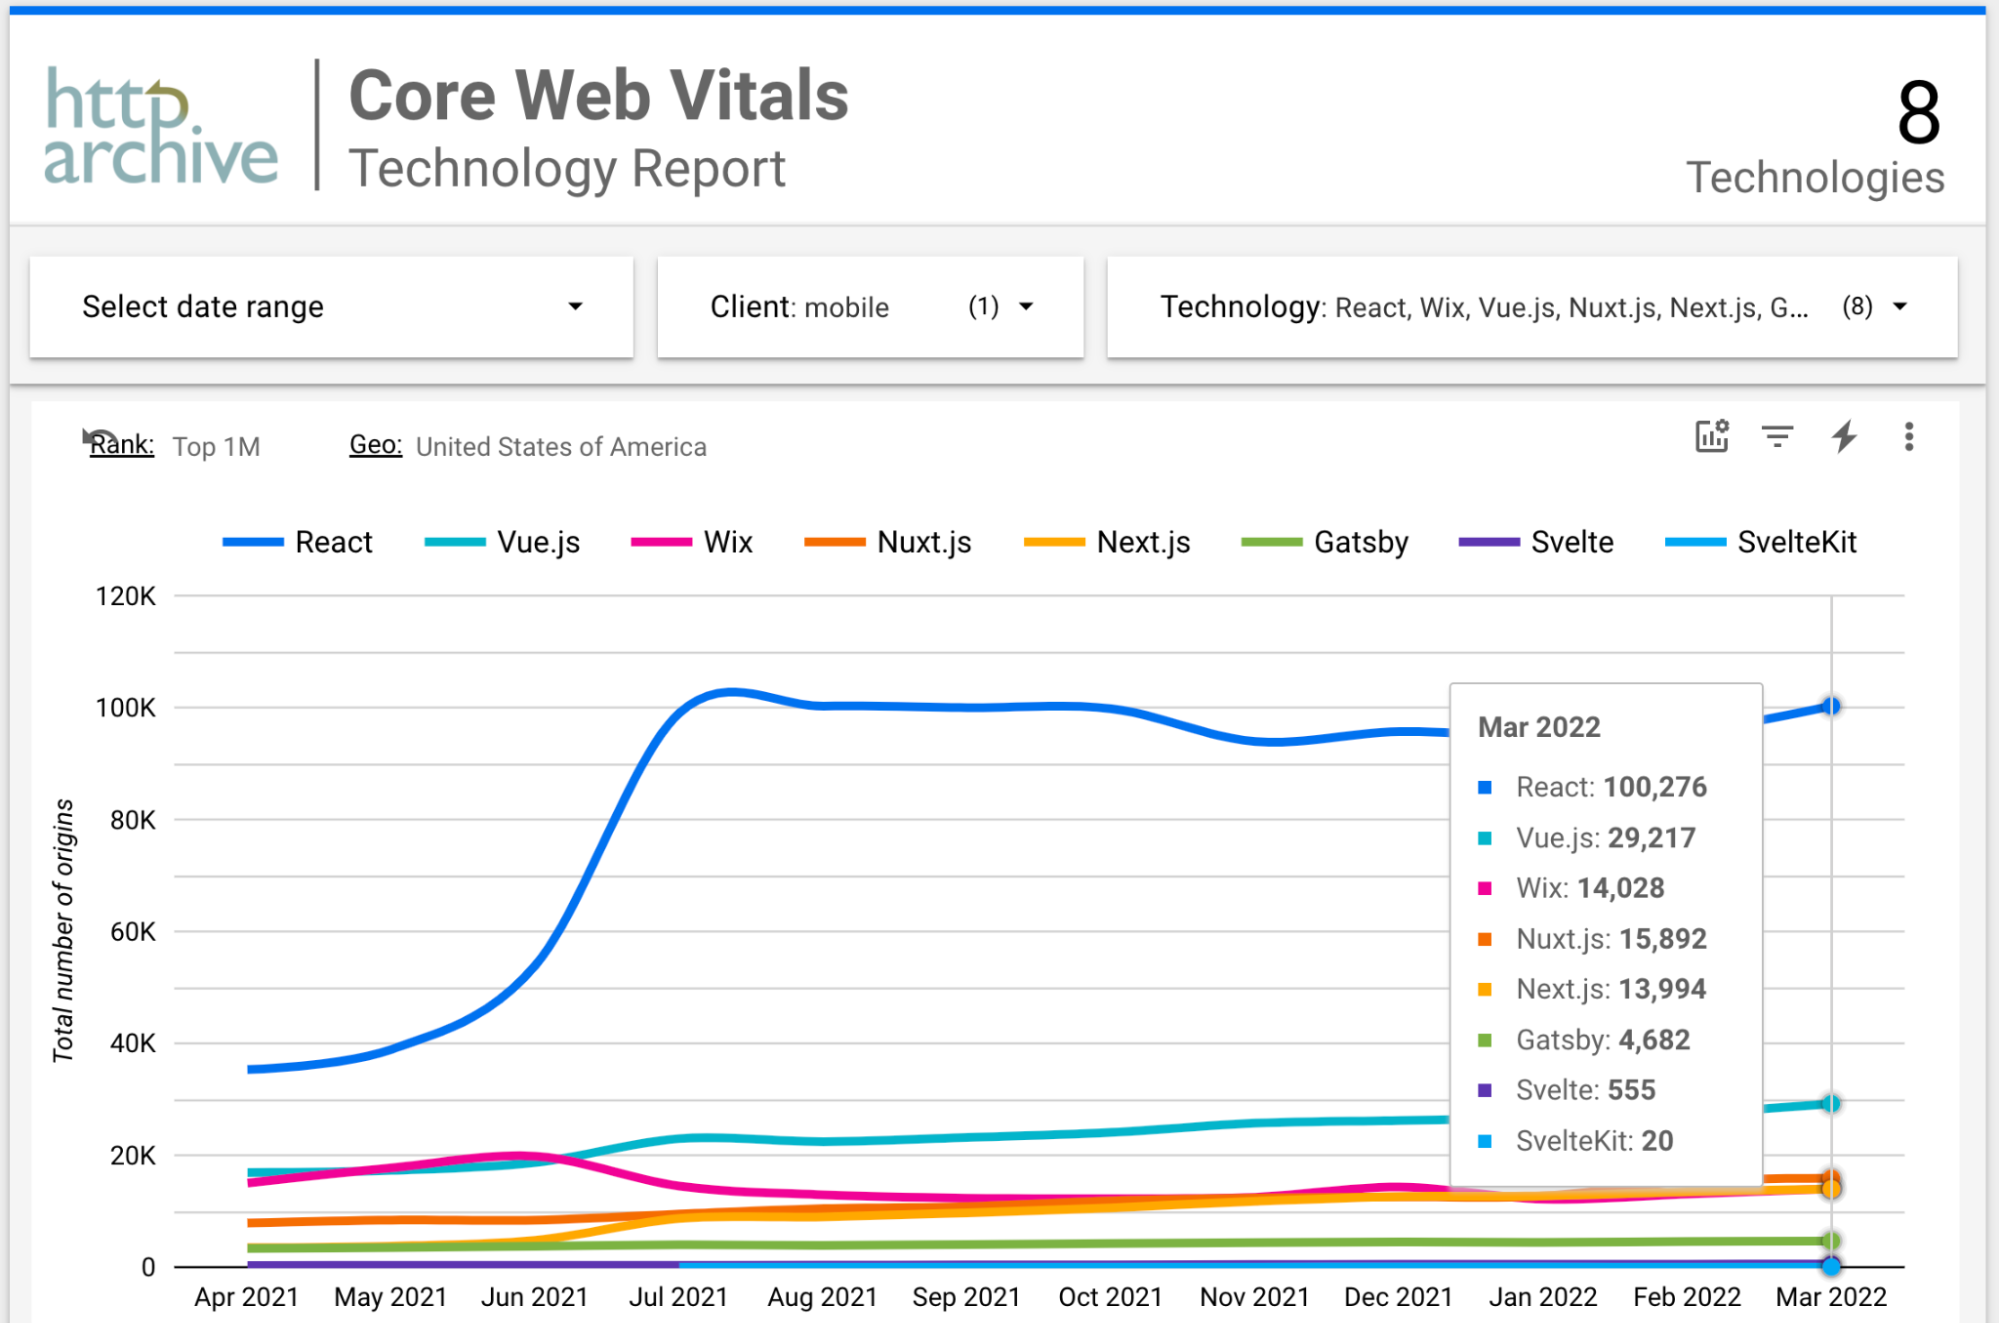
Here Wix represents only 14% of React sites, so its positive contribution shrinks. That is a key reason React’s good-CWV ratio drops when restricting to top sites, unlike the other frameworks. Wix, in other words, explains React’s otherwise puzzling performance profile.
Breaking Down The Meta-Framework Metrics
Why do Next.js and Nuxt.js fall short of the benefits seen with Gatsby and Wix? The individual metrics point to the cause. FID is essentially irrelevant, as all frameworks maintain good FID ratios above 97%. CLS tells a partial story:
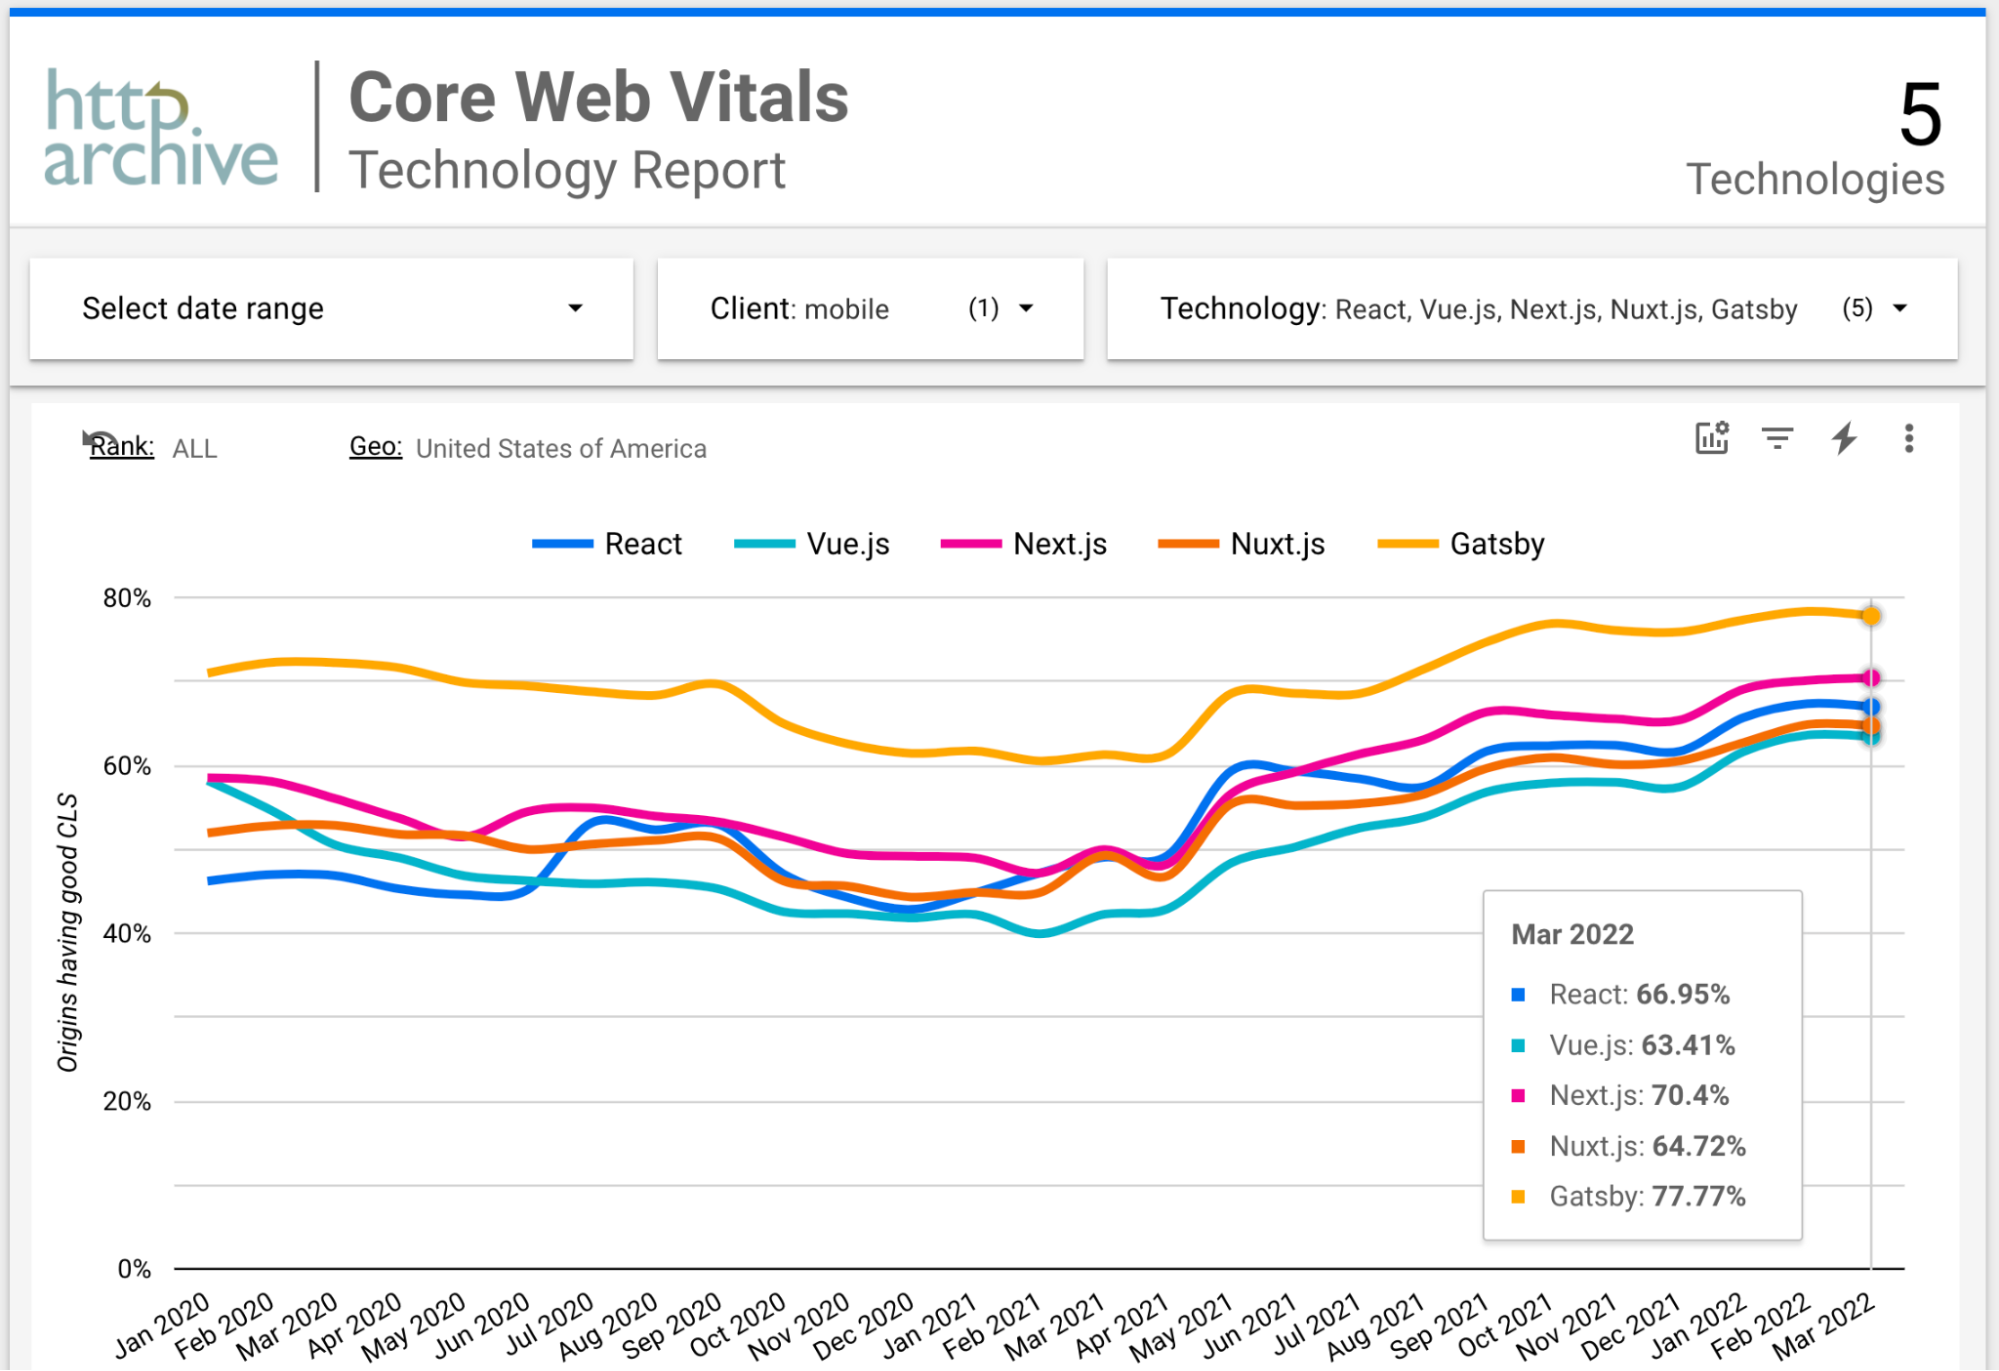
Next.js exceeds React on CLS, but Gatsby remains ahead. Nuxt.js sits between Vue and React. Since FID and CLS are close across frameworks, the differentiator must be LCP:
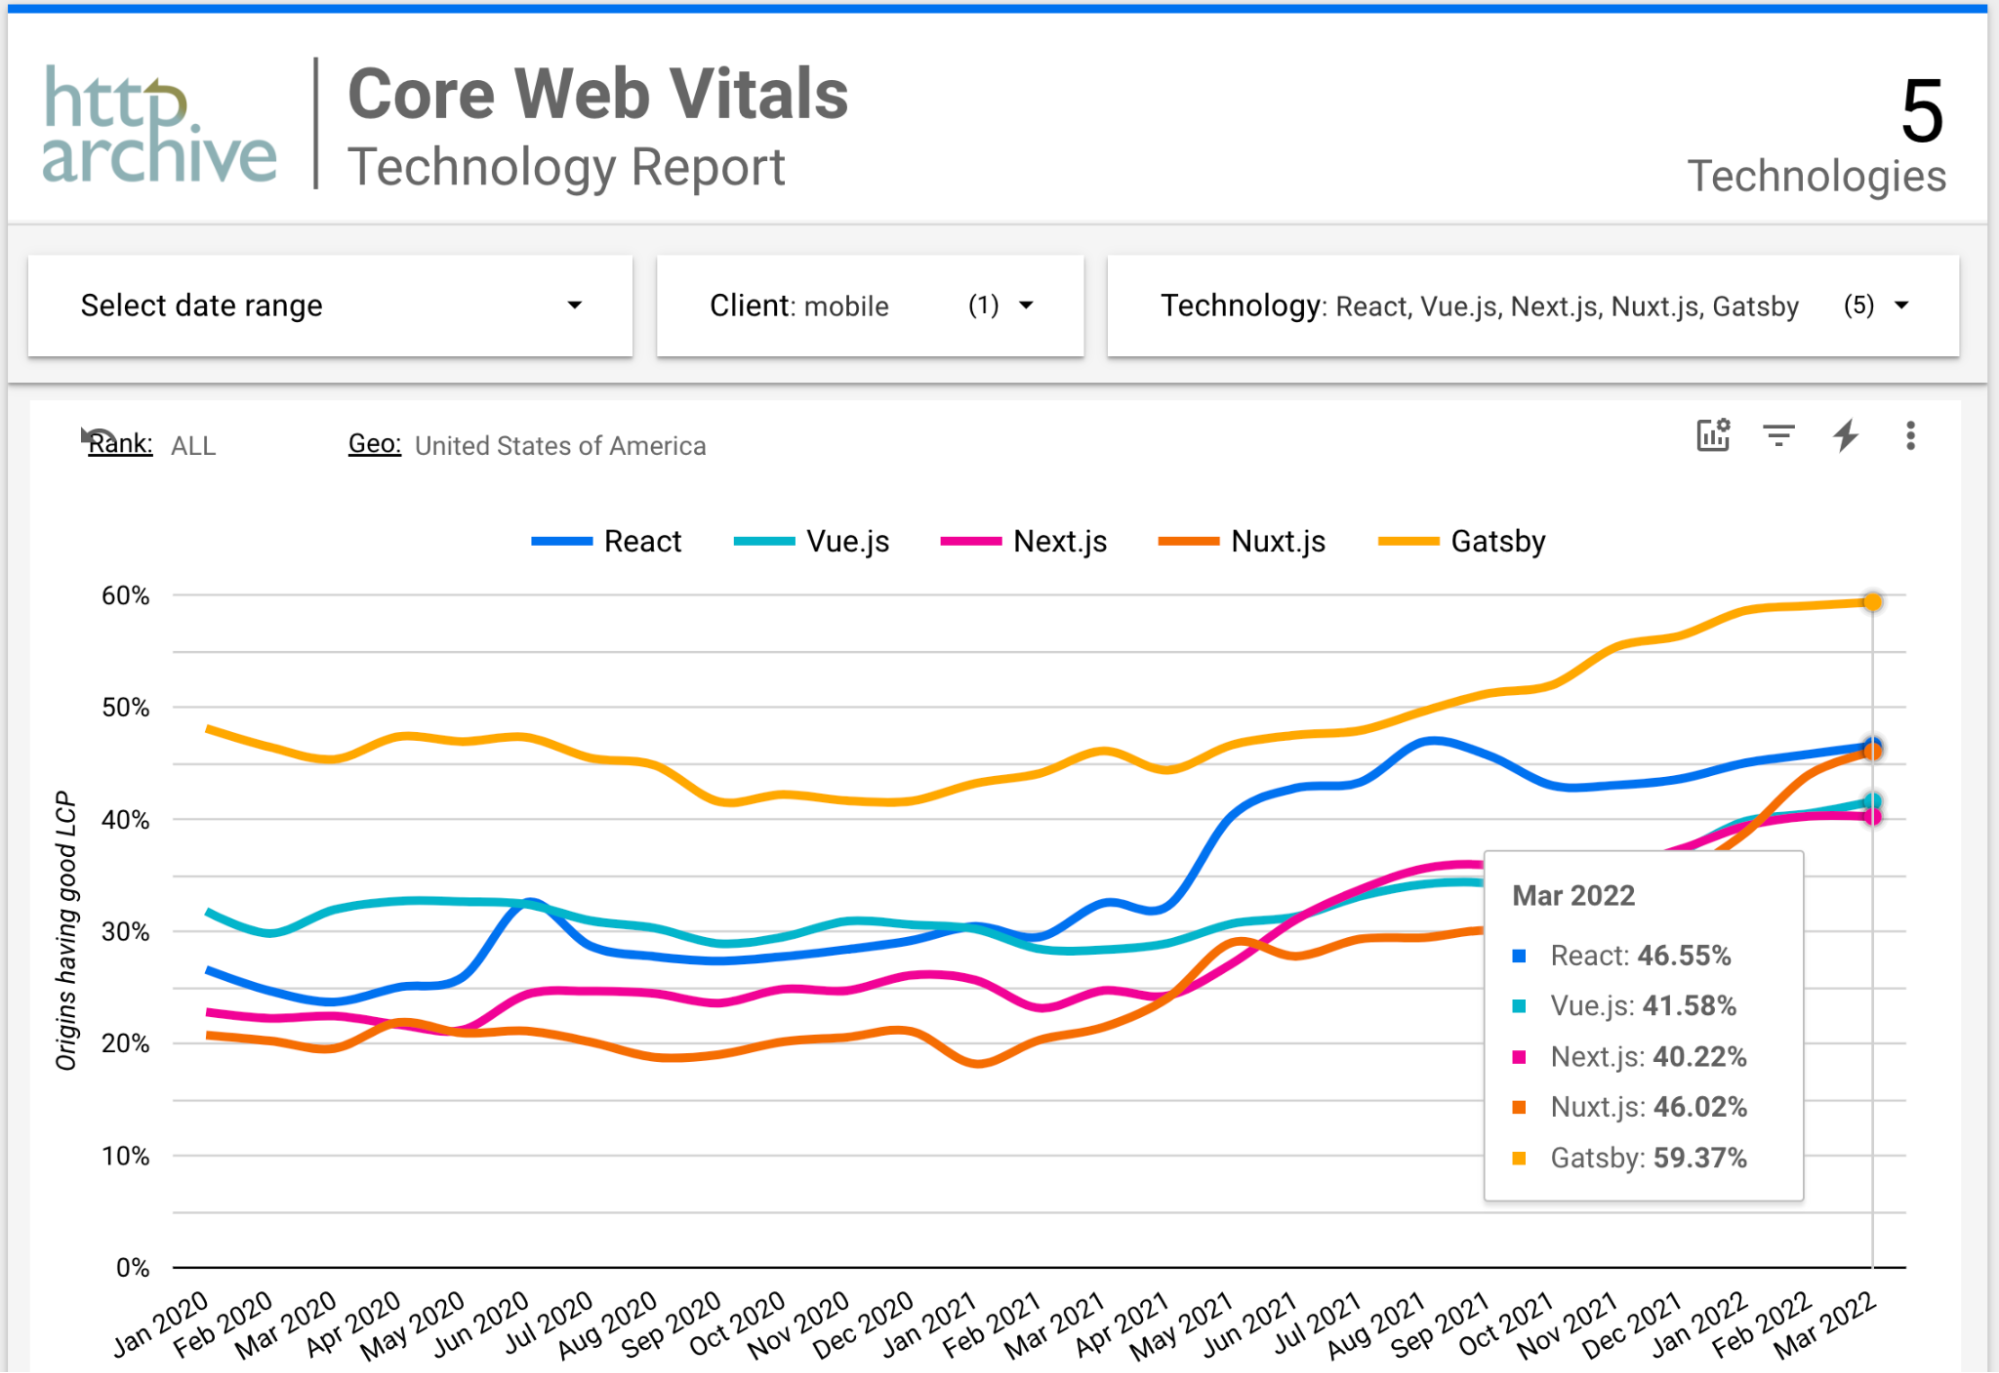
Gatsby beats React by a wide margin, and React overall beats Next.js. Given Next.js’ native SSR/SSG and modern image support, that outcome is surprising and worth monitoring. Nuxt.js has improved sharply recently, surpassing Next.js and matching React overall.
Image download sizes offer one possible explanation for LCP differences:
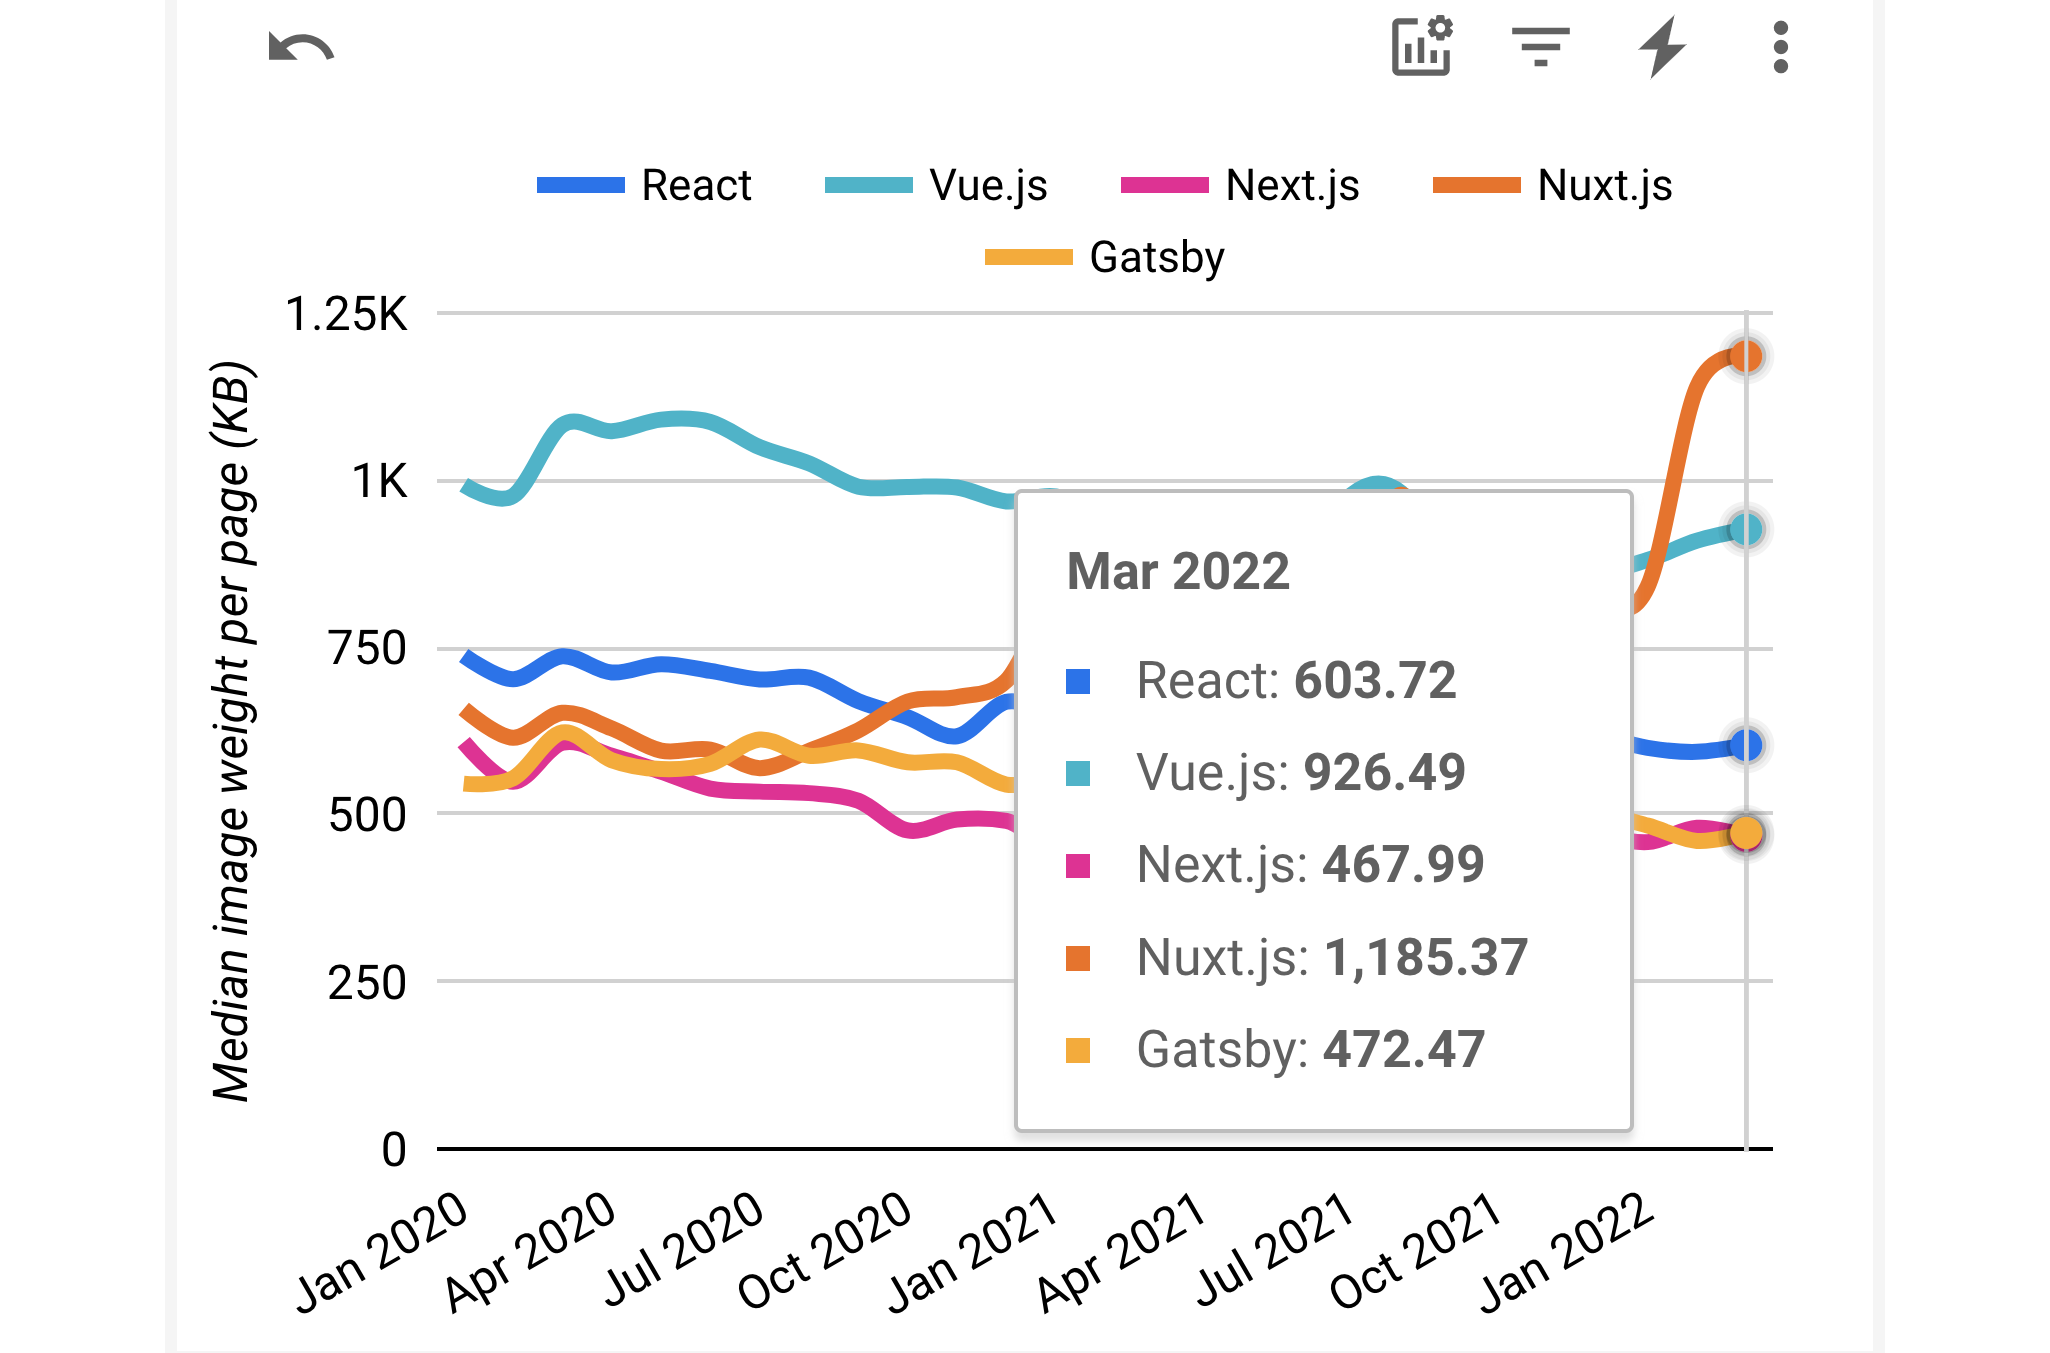
Nuxt.js and Vue sites carry noticeably more image data than React sites, yet Nuxt.js still achieves a solid LCP ratio. Gatsby and Next.js are both efficient with image payloads, meaning Gatsby’s LCP advantage does not come from smaller images. It likely reflects earlier starts and better prioritization of the largest image against other resources. For reference, the Gatsby homepage uses WebP; the Next.js homepage uses AVIF.
Key Takeaways
Every framework reviewed here has good-CWV ratios above zero — meaning you can build fast sites with any of them — and below 100%, meaning you can also build slow ones. The probability of good performance, however, differs meaningfully by framework, which matters when choosing a stack.
Those differences can mislead. React initially looks stronger than Vue, but once most Wix sites are excluded by filtering for high-traffic pages, Vue catches up. Similarly, frameworks like Preact and Svelte, which emphasize performance, do not necessarily convert that focus into better CWV. It remains to be seen whether Google’s planned responsiveness metric to replace FID changes that picture.
Surprisingly, web application frameworks are not a silver bullet either. Despite built-in SSG/SSR and CDN delivery, Next.js and Nuxt.js do not consistently outperform plain React or Vue. Both post encouraging upward trends — Nuxt.js especially — but still trail Gatsby, Wix and even the web-wide average. Whether those improvements close the gap will be worth following.



