
Performance problems surface at scale
Latency has a direct line to revenue. A 100ms increase in load time can reduce ecommerce conversion by up to 8%, which at enterprise scale translates into millions in lost sales. As applications mature, the complexity that drives those delays — personalization, dynamic pricing, recommendation engines — becomes harder to untangle. Systematic audits are the practical way to isolate what is actually slowing things down.
One of our enterprise ecommerce customers hit this wall after layering personalization onto a Next.js application that had previously performed well. The results were stark:
- Time to First Byte (TTFB) increased by 300%
- Conversions dropped 15%
- Server costs doubled within three months
The cause was not poor code or architectural debt. It was the fundamental tension between static optimization and dynamic features. The audit identified where that tension could be relaxed: we helped the customer cut TTFB by 70%, bring conversions back to prior levels, and reduce server costs by 40% — without sacrificing the new functionality.
Audits deliver the most value at particular moments in an application's lifecycle. Knowing which type of audit to run at which stage matters.
Code Review Audits: verifying architecture during transitions
Framework migrations are a common point of failure. When a large ecommerce platform needed to move from Pages Router to App Router, we audited their code to surface optimization opportunities before the migration began.
The review found three recurring problems:
- React Server Components (RSC) payloads were three times larger than needed
- Data fetching waterfalls were slowing page rendering
- Caching strategies were not aligned with performance goals
Deliverables included framework-specific best practices, code examples and patterns, a prioritized action plan, and a migration roadmap with milestones. The customer completed the migration 40% faster than estimated while improving key performance metrics.
Web Performance Audits: protecting conversion rates
A major retailer came to us with falling conversion rates and no clear culprit. Their initial analysis suggested performance issues, but pinpointing the cause required a dedicated web performance audit. We identified three concrete problems:
- Third-party scripts degrading Core Web Vitals
- Poor image optimization dragging down Largest Contentful Paint (LCP)
- An inefficient API waterfall in critical user flows
After addressing these issues, the retailer saw:
- 45% faster Time to Interactive (TTI)
- A 6% lift in conversion rates
- Core Web Vitals improved across the board
This type of audit is most useful before product launches, during migrations, and whenever real-world user experience metrics need validation.
Usage Audits: cost control at scale
Systems that behave well at thousands of users often break down at millions. One enterprise customer saw serverless costs climb sharply as a result of inefficient async operations. A usage audit traced the problem to three root causes:
- Async waterfalls in product and category data fetching caused redundant serverless executions
- Static pages regenerated too frequently because Incremental Static Regeneration (ISR) intervals were overly short
- Data caching patterns were causing unnecessary API calls
Targeted fixes based on real usage data produced measurable results:
- Serverless function executions dropped 60% through parallel data fetching
- Cache hit rates improved by extending ISR times and using on-demand revalidation
- API calls fell 40% thanks to optimized caching strategies
Usage audits are most effective when applied before infrastructure costs spiral. They provide a data-driven view of how an application consumes resources, which supports informed decisions about where to optimize.
A diagnostic-first approach
Effective audits do not begin with reading code. They begin by measuring the gap between intended goals and actual production performance. That analysis examines three dimensions:
- User experience: Real-world performance, friction points in user flows, and where metrics start degrading
- Resource efficiency: How effectively the application uses platform resources, what is driving unexpected costs, and which usage patterns need optimization
- Development velocity: Deployment frequency and developer roadblocks that slow delivery
This diagnostic layer typically surfaces the same categories of issues, regardless of the application:
- Performance bottlenecks: High TTFB, slow navigations and interactions, redundant resource preloads
- Resource waste: Overactive page generation, bandwidth spikes from unoptimized images, oversized RSC payloads, inefficient Edge Middleware patterns
- Developer friction: Misunderstanding of React and Next.js best practices, slow build times, unintentional security oversights
Prioritizing fixes based on their business impact is what turns an audit from a technical report into a roadmap. That focus on measurable outcomes is what restores both performance and the confidence to keep shipping new features.
Rendering strategy mismatches
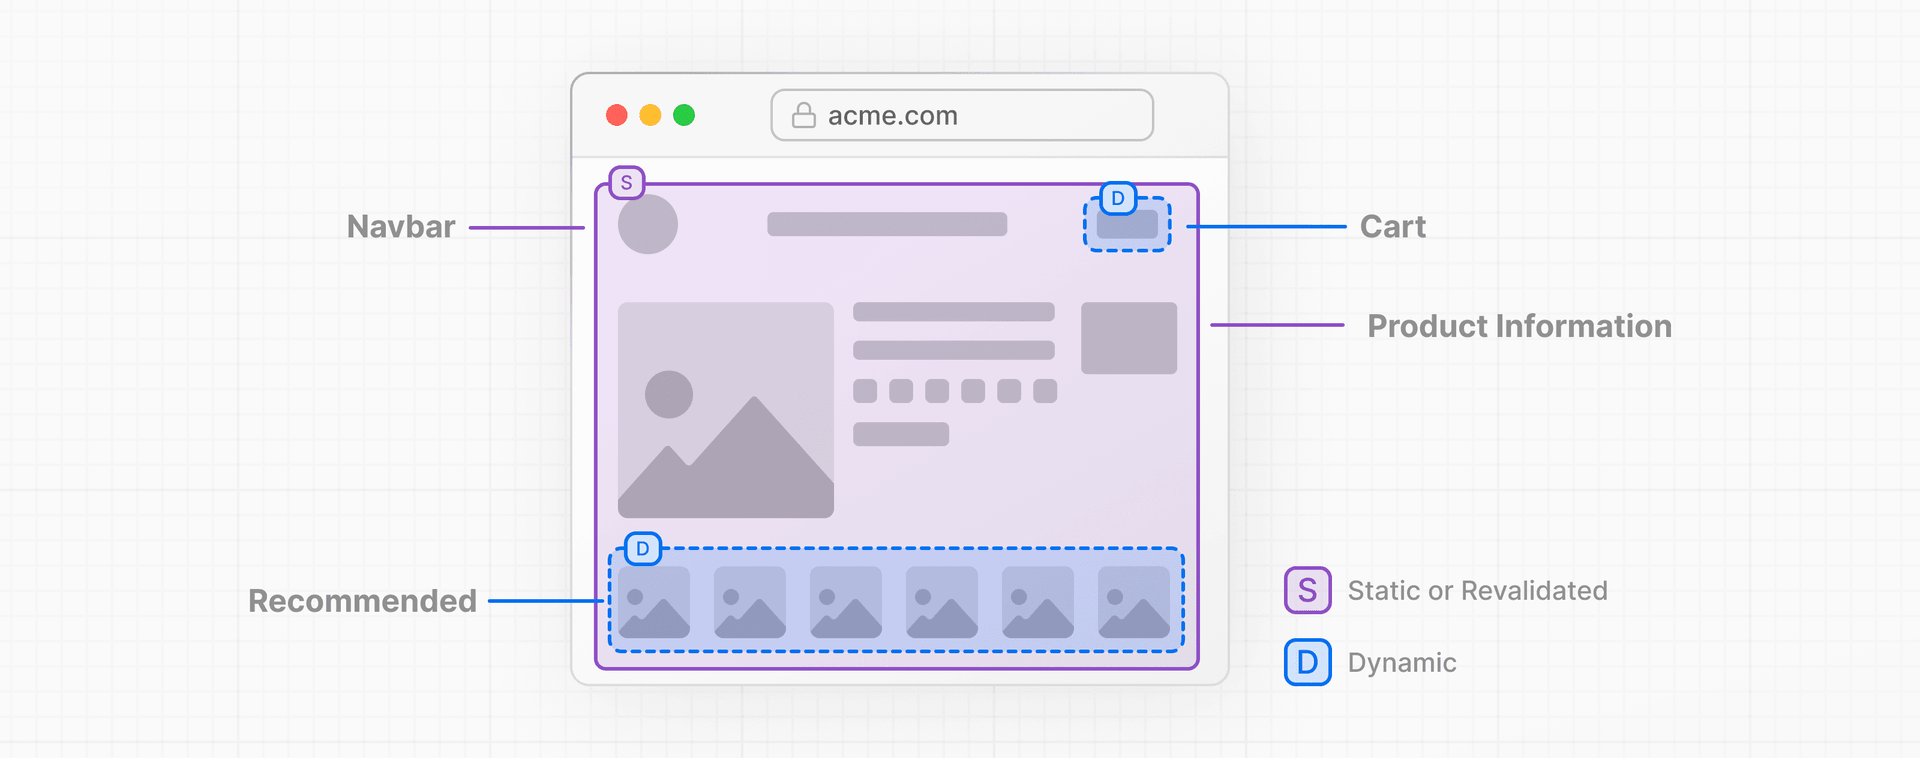
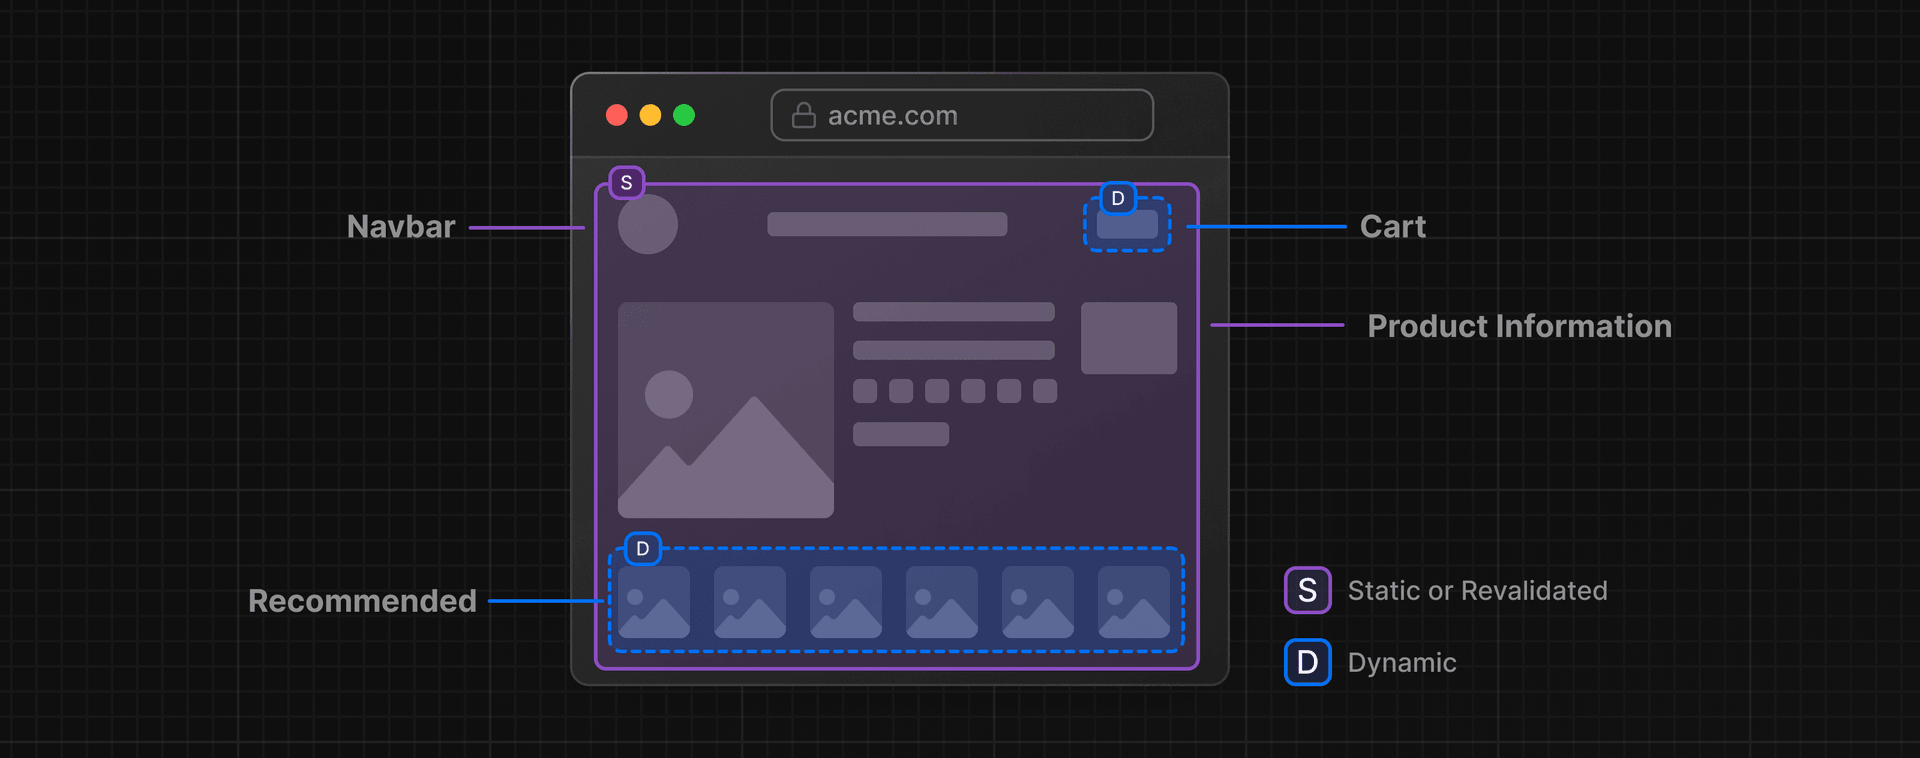
One of the most frequent problems we encounter in audits is a misalignment between rendering strategy and actual page requirements. This is especially common in ecommerce, where teams start with strong static optimization but gradually introduce dynamic features such as personalization and A/B testing without adjusting their architecture. The result is slower time to first byte, lower conversion rates, and reduced server efficiency.
Common warning signs include static optimization being disabled across entire routes, page-level data fetches that block rendering, and client-side experimentation tools that add significant JavaScript to critical paths. In these cases, the fix is usually to keep most of the application static or incrementally revalidated, moving dynamic behavior to only the components that need it. Auth flows can run through Edge Middleware with ISR, while data fetching should be pushed down to the component level using tools like SWR. A/B testing is better handled server-side via Edge Middleware, where pre-computed variants prevent performance penalties on the client.
Teams that correct these patterns typically see a 40–60% reduction in server costs, a return to baseline conversion rates, and meaningful TTFB gains across global regions.
Resource usage and scaling bottlenecks
As traffic grows, small inefficiencies in how resources are handled can compound into major cost and performance issues. This shows up most often in serverless functions, image and video delivery, and third-party integrations.
Common issues we see include images with no dimension attributes (causing layout shift), autoplay videos loading with the page, sequential rather than parallel API calls inside functions, middleware authentication patterns that run on every request, and dynamic routes lacking cache headers. Some teams also add an extra CDN in front of Vercel's Edge Network, which only adds latency without benefit. Inconsistent data fetching across components creates redundant requests and slower page loads.
Recommended fixes include defining image dimensions and delegating optimization to Next.js's Image component, moving video content to blob storage or a CDN with lazy loading or streaming, establishing consistent parallel fetching patterns, scoping authentication logic to specific routes, and introducing strategic caching to minimize function invocations. These changes typically reduce bandwidth usage by 30–40%, cut serverless executions in half, and push global cache hit rates to around 90%.


Pages Router to App Router migration pitfalls
Moving to the App Router unlocks new performance capabilities, but teams often stumble on implementation details. The typical migration introduces oversized React Server Component payloads, incorrect client/server boundaries that inflate client-side JavaScript, missing cache configurations in data fetching, and props that pass entire objects across the server/client boundary when only specific fields are needed. Legacy habits, such as leaving asynchronous functions on the client instead of relocating them to the server, also block static optimization.
The migration does not need to be a big bang event; Next.js supports running Pages Router and App Router side by side, so teams can move incrementally. During and after the transition, profile RSC payload size in Chrome DevTools and reduce it where possible. Use Suspense boundaries to manage client/server rendering splits, and take advantage of use cache, revalidatePath, and revalidateTag for granular caching. React.cache() combined with Suspense also helps manage complex data calls.
Teams that follow this path report roughly 40% faster migration completion, a 50% reduction in client-side JavaScript, and improvements across Core Web Vitals.
Developer experience drags
Performance problems are not limited to production. Slow builds and heavy local development environments block iteration and delay fixes at precisely the wrong moments, such as peak shopping periods. Technical debt accumulates when developers cannot easily make changes.
Slow builds frequently stem from unoptimized Next.js configuration, particularly missing bytecode caching. Other contributors include inefficient module imports, barrel files that enlarge bundles, excessive third-party libraries, and general trade-offs between developer experience and runtime performance that were made without full consideration.
The solutions are straightforward: audit build configuration, eliminate barrel files, and remove unnecessary third-party code. Balance DX conveniences against their performance cost. In audits, these measures have cut build times in half, reduced bundle size by a third, and led to measurable increases in deployment frequency.
Making audits stick
The value of a technical audit is not in a momentary cleanup but in establishing patterns that prevent regression. Effective audits provide guidance before, during, and after major migrations, helping teams build applications that stay fast as they evolve. Support structures, including four 30-minute office hours sessions per week during the audit period, help teams implement recommendations correctly and internalize best practices.



