
A 3x Throughput Jump for GitHub Actions on Enterprise Server
GitHub Actions has been generally available on GitHub Enterprise Server (GHES) since the 3.0 release roughly two years ago. Since then, a series of performance engineering efforts have significantly reduced the CPU load GitHub Actions places on the server, unlocking far greater concurrency. On 96-core machines, the maximum number of concurrent jobs has climbed from 2,200 on GHES 3.2 to 7,000 on the current GHES 3.6 release—a threefold improvement.
The path to that milestone involved revisiting some fundamental assumptions about how the system was built and finding wins in unexpected places.
Enabling a Cache That Was Never On
The first major discovery came from profiling the hottest code path used to access workflow secrets and callback URLs. The team assumed this path was already leveraging a cache, but analysis of profile traces from load testing and production revealed it was not. What made this particularly tricky was that the team had extensive monitors for every new cache added to the product—this particular one had simply been presumed active for years.
Enabling the cache was a single-line change that produced immediate results: CPU usage dropped sharply, workflow execution sped up, and overall throughput increased. The lesson here is that sometimes the biggest performance wins don’t require deep architectural surgery.
Re-Architecting Orchestration State Storage
The Old Approach: One Large Blob
GitHub Actions relies on an orchestration layer—a durable state machine—to keep workflow runs resilient against machine shutdowns and intermittent failures. For durability, every time the orchestrator wakes up, it replays execution from the beginning to rebuild local state until it either finishes or encounters new work.
The problem was in how that state was persisted. Orchestration state was stored in a single database column as one large blob of events. Updating the state meant reading the entire blob into memory, appending new events, and writing the whole thing back. This caused unnecessary overhead: a growing blob was constantly deleted and rewritten with a nearly identical, slightly larger value. Replaying state required reading and deserializing the entire blob each time.
CREATE TABLE tbl_OrchestrationSession (
   SessionId           BIGINT              NOT NULL,
   CreatedOn           DATETIME            NOT NULL DEFAULT GETUTCDATE(),
   LastUpdatedOn       DATETIME            NOT NULL DEFAULT GETUTCDATE(),
   ...
   State               VARBINARY(MAX)      NULL, -- this is where we store execution state
)
The New Approach: Incremental Reads and Writes
The orchestration system was rebuilt to support both incremental reads and incremental writes. State history now lives in its own dedicated table rather than as an inline binary blob. When state is updated, only the new events are written to the database. This design also enables smarter caching, where the system can skip fetching all historical events and only pull pending events. Replay overhead is largely eliminated, making long-running orchestrations with many workflow steps far less costly.
-- new table to store execution state
CREATE TABLE tbl_OrchestrationSessionEvent (
   ...
   SessionId       BIGINT          NOT NULL,
   EventId         BINARY(20)      NOT NULL,
   EventData       VARBINARY(MAX)  NOT NULL
)
Observed Gains
The impact on GitHub.com was substantial: CPU consumption for running orchestrations dropped by an average of 50%, with longer-running orchestrations benefiting the most. The orchestration platform had not received much investment before this change, and the results underscored the importance of continually reevaluating core infrastructure as the system scales.
Cutting Postback Noise
Understanding Postbacks
As a workflow run progresses, its status is reflected in checks visible through the UI and API. The GitHub Actions backend service manages the run state during orchestration, while the Rails monolith handles the checks. A “postback” is the service-to-service call that pushes the latest run state to checks. The backend maintains an internal queue of postbacks, each delivered via a separate orchestration per workflow run to ensure reliability across service downtime.
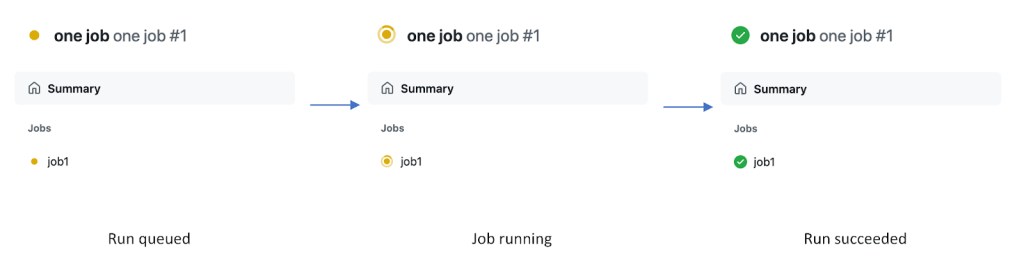
Load testing revealed two problems. First, delivering a postback was consistently one of the slowest activities, averaging 250–300 ms per execution. Second, the backend was overly chatty: it sent one postback for every check step update, and three postbacks with nearly identical payloads whenever a check run completed. In large matrix scenarios, this volume of slow postbacks consumed significant system resources and could stall other activities.
Reducing and Streamlining Postbacks
The team audited the usefulness of each postback type. Check step statuses turned out to be displayed on only one specific UI screen, so the backend stopped sending step-level updates during the workflow run and now posts that data only upon completion. This introduced a tradeoff: in-progress runs may load slower initially due to client-side rendering overhead when step data isn’t yet available. The duplicated job-completed events were also removed. These changes shipped with GHES 3.3, enabling GitHub Actions to run close to twice as many concurrent jobs as GHES 3.2.
Addressing the per-postback latency is a separate effort. Postbacks were being sent over HTTP across four different services, with each service manually handling retries and timeouts. The team is now moving postback delivery to a message queue-based system that should be faster and simpler, with a rollout expected in the coming months.
Lessons for Scaling Platforms
These optimizations—and others not detailed here—collectively allow GitHub Actions to run three times more concurrent jobs while consuming fewer system resources. Beyond the immediate performance gains, the work reinforced a valuable engineering principle: it is always worth revisiting the fundamentals of long-standing systems as they scale. The team plans to improve load testing automation to catch issues like these earlier and continue optimizing performance across the platform.



