
Benchmarking blunders: Napkin math, coding evals, and cold-weather tire myths
Bad benchmarks are everywhere. This time around, we're looking at three distinct examples: a popular performance "napkin math" repository, a pair of AI coding-agent evals, and an often-repeated claim about winter tires in cold weather. The common thread is that each falls apart when you apply ordinary reasoning about measurement and experimental design — no specialized domain expertise required.
A popular napkin-math repo has wrong numbers
A performance-order-of-magnitude repository (5.4k stars) is a top hit for interview prep, but its README contains numbers that don't hold up under scrutiny. The first red flag is that some values labeled as "latency" aren't actually measuring what you'd expect.
| Operation | Latency | Throughput | 1 MiB | 1 GiB |
|---|---|---|---|---|
| Sequential Memory R/W (64 bytes) | 0.5 ns | |||
| ├ Single Thread | 20 GiB/s | 50 μs | 50 ms | |
| ├ Threaded | 200 GiB/s | 5 μs | 5 ms | |
| Network Same-Zone | 10 GiB/s | 100 μs | 100 ms | |
| ├ Inside VPC | 10 GiB/s | 100 μs | 100 ms | |
| ├ Outside VPC | 3 GiB/s | 300 μs | 300 ms | |
| Hashing, not crypto-safe (64 bytes) | 10 ns | 5 GiB/s | 200 μs | 200 ms |
| Random Memory R/W (64 bytes) | 20 ns | 3 GiB/s | 300 μs | 300 ms |
Fast Serialization [8] [9] † | N/A | 1 GiB/s | 1 ms | 1s |
Fast Deserialization [8] [9] † | N/A | 1 GiB/s | 1 ms | 1s |
| System Call | 300 ns | N/A | N/A | N/A |
| Hashing, crypto-safe (64 bytes) | 100 ns | 1 GiB/s | 1 ms | 1s |
| Sequential SSD read (8 KiB) | 1 μs | 8 GiB/s | 100 μs | 100 ms |
Context Switch [1] [2] | 10 μs | N/A | N/A | N/A |
| Sequential SSD write, -fsync (8KiB) | 2 μs | 3 GiB/s | 300 μs | 300 ms |
| TCP Echo Server (32 KiB) | 50 μs | 500 MiB/s | 2 ms | 2s |
| Random SSD Read (8 KiB) | 100 μs | 70 MiB/s | 15 ms | 15s |
Decompression [11] | N/A | 1 GiB/s | 1 ms | 1s |
Compression [11] | N/A | 500 MiB/s | 2 ms | 2s |
| Sorting (64-bit integers) | N/A | 500 MiB/s | 2 ms | 2s |
| Proxy: Envoy/ProxySQL/Nginx/HAProxy | 50 μs | ? | ? | ? |
| Network within same region | 250 μs | 2 GiB/s | 500 μs | 500 ms |
| Premium network within zone/VPC | 250 μs | 25 GiB/s | 50 μs | 40 ms |
| Sequential SSD write, +fsync (8KiB) | 300 μs | 30 MiB/s | 30 ms | 30s |
| {MySQL, Memcached, Redis, ..} Query | 500 μs | ? | ? | ? |
Serialization [8] [9] † | N/A | 100 MiB/s | 10 ms | 10s |
Deserialization [8] [9] † | N/A | 100 MiB/s | 10 ms | 10s |
| Sequential HDD Read (8 KiB) | 10 ms | 250 MiB/s | 2 ms | 2s |
| Random HDD Read (8 KiB) | 10 ms | 0.7 MiB/s | 2 s | 30m |
| Blob Storage GET, if-not-match 304 | 30 ms | |||
| Blob Storage GET, 1 conn (128KiB) | 80 ms | 100 MiB/s | 10 ms | 10s |
| Blob Storage GET, n conn (offsets) | 80 ms | NW limit | ||
| Blob Storage LIST | 100 ms | |||
| Blob Storage PUT, 1 conn (128KiB) | 200 ms | 100 MiB/s | 10 ms | 10s |
| Blob Storage PUT, n conn (multipart) | 200 ms | NW limit | 10 ms | 10s |
Network between regions [6] | Varies | 25 MiB/s | 40 ms | 40s |
| Network NA Central <-> East | 25 ms | 25 MiB/s | 40 ms | 40s |
| Network NA Central <-> West | 40 ms | 25 MiB/s | 40 ms | 40s |
| Network NA East <-> West | 60 ms | 25 MiB/s | 40 ms | 40s |
| Network EU West <-> NA East | 80 ms | 25 MiB/s | 40 ms | 40s |
| Network EU West <-> NA Central | 100 ms | 25 MiB/s | 40 ms | 40s |
| Network NA West <-> Singapore | 180 ms | 25 MiB/s | 40 ms | 40s |
| Network EU West <-> Singapore | 160 ms | 25 MiB/s | 40 ms | 40s |
For random memory access, the repo claims 20ns read/write latency. A real DRAM read — as opposed to a cache hit — should be around 100ns for an order-of-magnitude estimate. When someone pulled the source code used to generate that figure, the problem became clear:
  while test.i < test.vec.len() {
      let random_index = test.order[test.i];
      black_box(test.vec[random_index]);
      test.i += 1;
  }
There's no data dependency between loop iterations, so the memory reads execute in parallel. The CPU can have multiple loads in flight, meaning the "average time per access" is really measuring throughput, not latency. To measure latency, you'd need to force a dependency between loads so accesses can't overlap.
The random SSD read number (100µs / 70MB/s) has related issues. Generating offsets like this:
for i in 0..(buffer.len() / page_size) {
    pages.push((i * page_size + 1) as u64);
}
...then doing 8KiB reads creates several bugs:
- The
+1makes every read unaligned; with a 4KiB page size, one read can touch three pages. - Overlapping offsets can hit the page cache unintentionally.
- Depending on page size, reads can extend past the end of the file and panic.
The bounds-checking logic is flawed: the last offset is SIZE - 4096 + 1, leaving 4095 accessible bytes before a read of 8192 bytes runs past EOF. The benchmark may or may not fail depending on how often the bad offset is hit during the 5-second run.
Even if that bug were fixed, the sequential read numbers are suspect. The test takes a 1 GiB file, flushes it, then repeatedly re-reads it — producing one uncached read followed by many cached reads. The aggregate number of "8 GiB/s" from that workload isn't meaningful unless you know the ratio of cold to warm reads, which isn't stated. Google's own docs for the c4-standard-48-lssd instance cap aggregate throughput at 5000 MiB/s for all 8 attached disks (625 MiB/s per disk), so the README's 8 GiB/s claim of the code's own device is excessive. The POSIX_FADV_RANDOM and POSIX_FADV_DONTNEED hints are merely advisory and won't prevent OS or device-level caching; the Mac path calls sudo purge, and other OSes get nothing.
The deeper issue isn't just incorrect numbers — it's representativeness. A single figure can't capture disk performance, which varies wildly by read size, queue depth, and job count. Compression/decompression numbers from the same repo have the same problem: with different zstd options, you can span more than two orders of magnitude in compression speed. A number for an 8-disk GCP VM config is also little use as a memorized figure.
What's worth learning from these benchmarks? If you do real work where these numbers matter, you'll internalize the values that actually matter to you, along with the derivations that explain them. Memorizing a table of dubious figures, especially for interview prep, isn't a substitute for understanding what mechanisms impose the relevant constraints.
Coding-agent evals: deep flaws, shaky claims
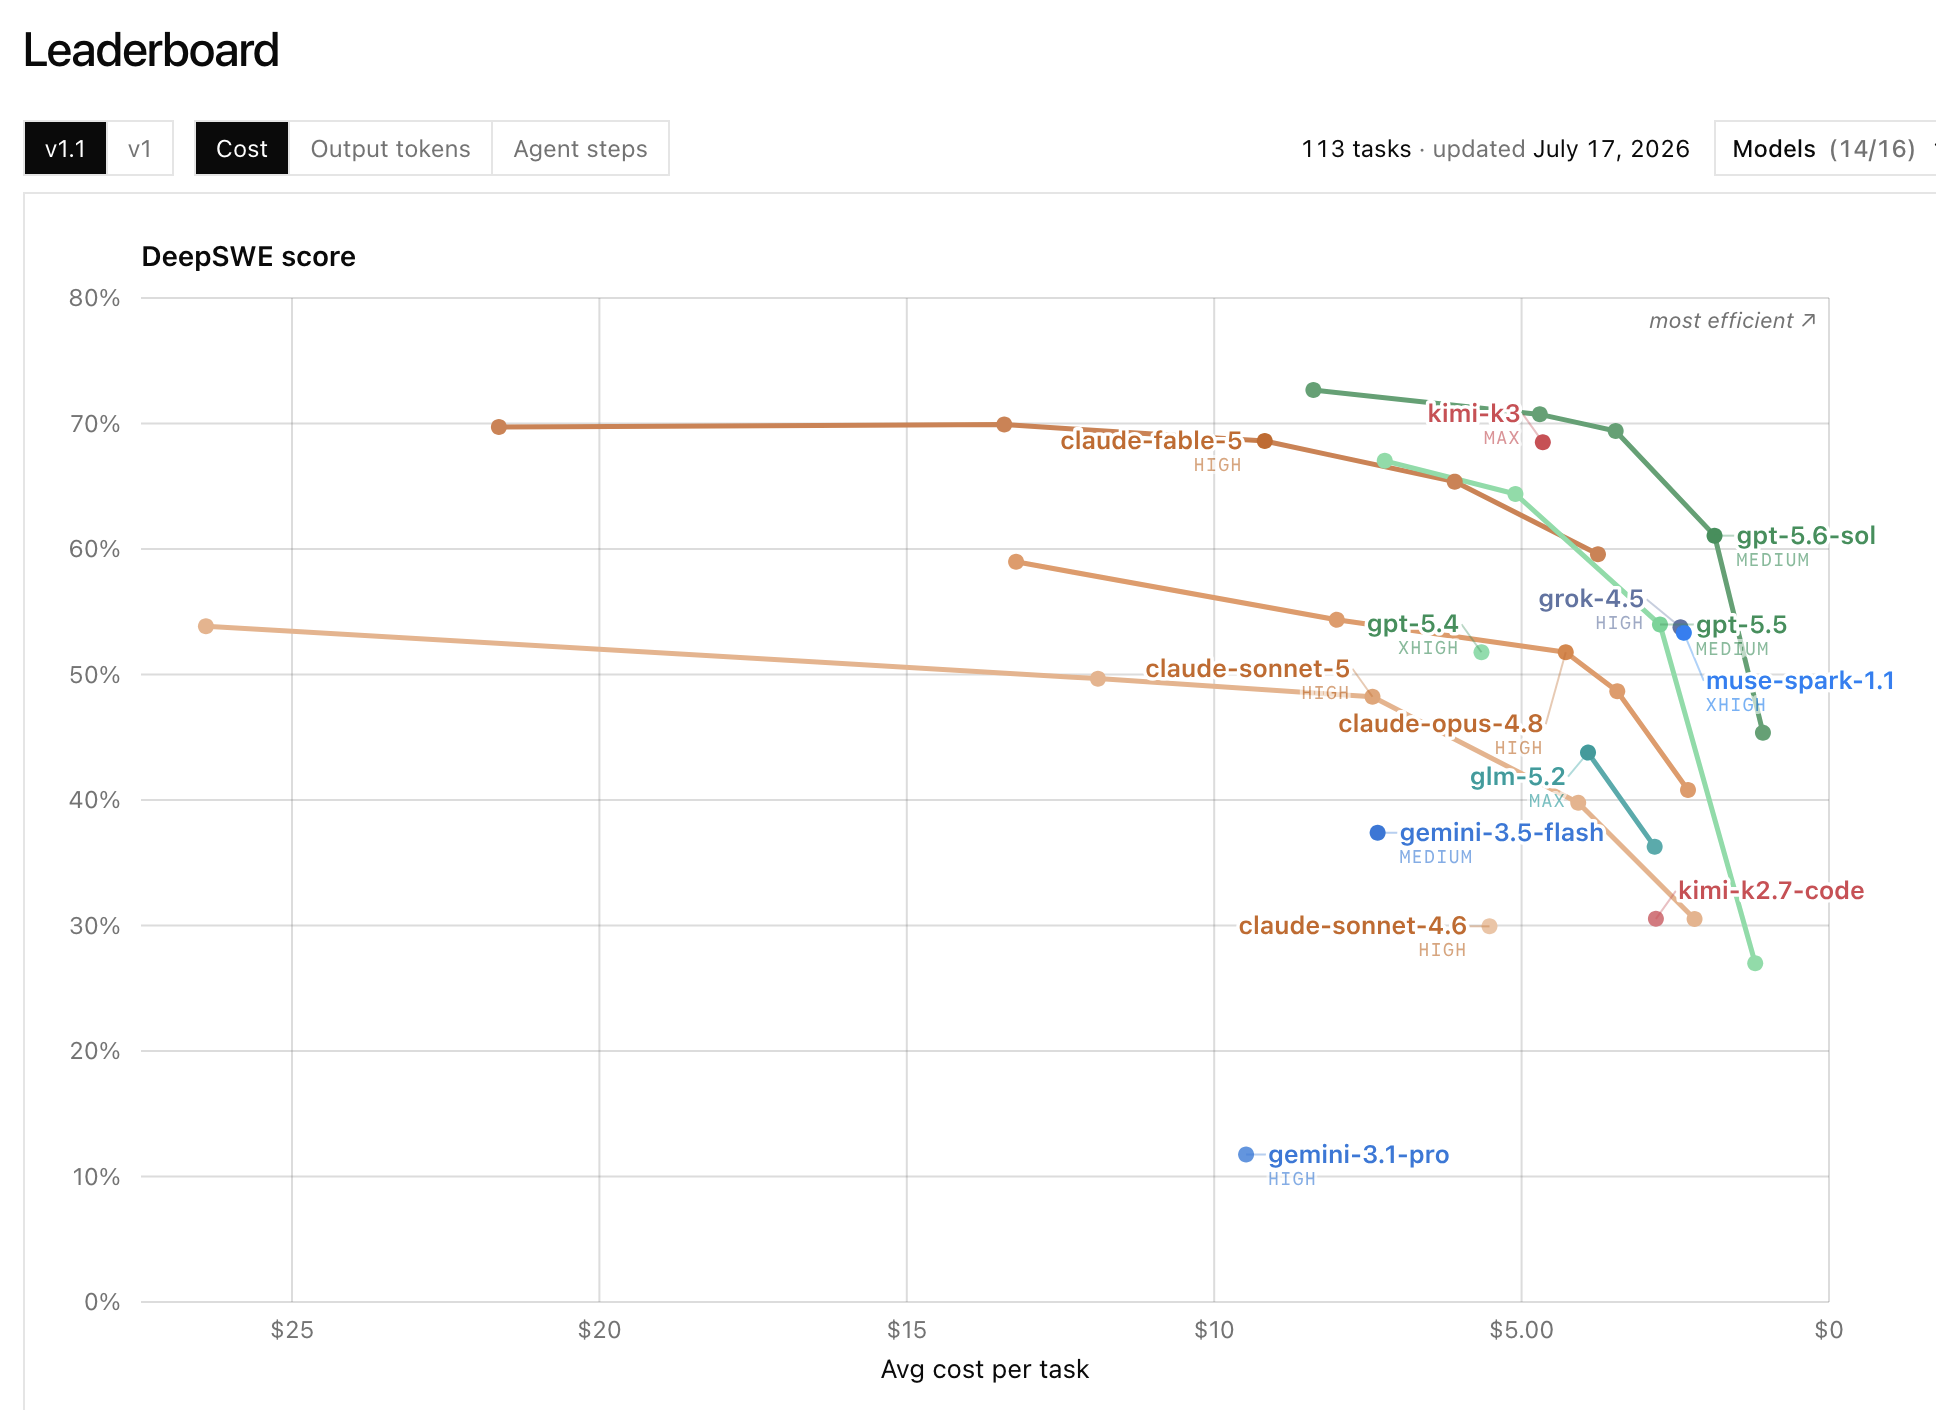
Coding-agent leaderboards like DeepSWE and Senior SWE-Bench get cited in Slack and on social media to "prove" which model is best. The surface-level claims are bad from the start: DeepSWE's homepage makes OpenAI's last-gen model look equal to Anthropic's current one, and Senior SWE-Bench suggests Anthropic's prior generation beats OpenAI's newest. Neither matches the firsthand experience of most people who actually use these tools on a daily basis.
Looking deeper, both use fundamentally unsurprising evaluation methodology. Each relies on small task sets — insufficient to make generalizable claims about which coding agent works "better," and critically, the tasks themselves are unrepresentative. Of 113 DeepSWE tasks, few are even in languages that people typically use coding agents for. Four Rust tasks show meaningful model divergence, and none are especially related to real-world tasks many programmers face. When only one task in 113 even vaguely resembles actual work, the aggregated score is essentially meaningless as a signal.
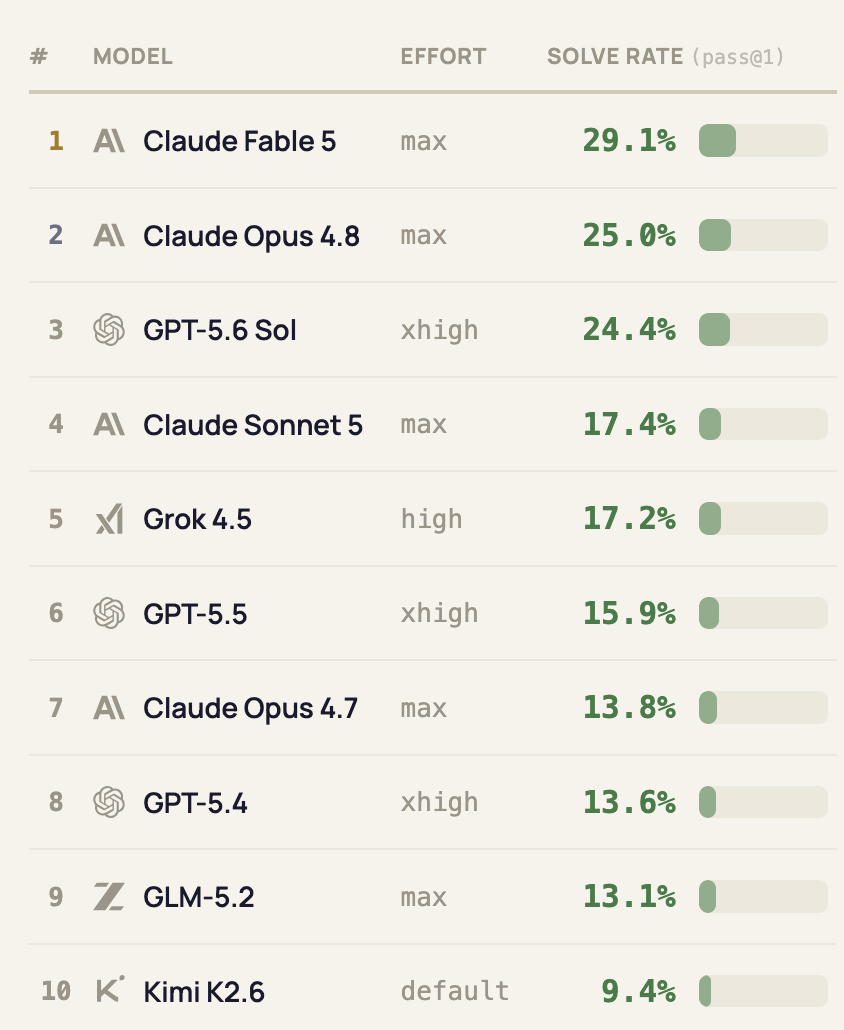
Senior SWE-Bench compounds the problems by introducing arbitrary threshold effects. "Tasteful solves" require meeting a rigid score cutoff and staying under a strict line-of-code limit relative to a reference implementation. A benchmark like paperless-ngx-perf-workflow-queries gets GLM-5.2 a pass at 121 lines when the reference is 61; one more line would fail it. With its 1-line reference solution, plausible-fix-top-pages-comparison can't accept any solution that adds and removes multiple lines – even if the code is entirely correct.
Pass/fail on variable code
One clear example shows what's broken in the tastefulness rubric. For a particular task:
Reference solution
  --- a/lib/plausible_web/controllers/api/stats_controller.ex
  +++ b/lib/plausible_web/controllers/api/stats_controller.ex
  @@ -723,7 +723,7 @@ defmodule PlausibleWeb.Api.StatsController do
       else
         json(conn, %{
           results: pages,
  -        meta: Map.merge(meta, Stats.Breakdown.formatted_date_ranges(query)),
  +        meta: Map.new(meta.values) |> Map.merge(Stats.Breakdown.formatted_date_ranges(query)),
           skip_imported_reason: meta[:imports_skip_reason]
         })
       end
Opus 4.8 — verdict: pass
  --- CHANGELOG.md
  +++ CHANGELOG.md
  +- Fixed blank comparison dates in row tooltips on the Top Pages report

  --- lib/plausible_web/controllers/api/stats_controller.ex
  +++ lib/plausible_web/controllers/api/stats_controller.ex
  -        meta: Map.merge(meta, Stats.Breakdown.formatted_date_ranges(query)),
  +        meta: Map.merge(Map.new(meta), Stats.Breakdown.formatted_date_ranges(query)),

  --- test/plausible_web/controllers/api/stats_controller/pages_test.exs
  +++ test/plausible_web/controllers/api/stats_controller/pages_test.exs
  +      assert json_response(conn, 200)["meta"] == %{
  +               "date_range_label" => "2 Jan 2021",
  +               "comparison_date_range_label" => "1 Jan 2021"
  +             }
Opus 4.7 — verdict: fail
  --- lib/plausible_web/controllers/api/stats_controller.ex
  +++ lib/plausible_web/controllers/api/stats_controller.ex
  -        meta: Map.merge(meta, Stats.Breakdown.formatted_date_ranges(query)),
  +        meta:
  +          meta.values
  +          |> Map.new()
  +          |> Map.merge(Stats.Breakdown.formatted_date_ranges(query)),

  --- test/plausible_web/controllers/api/stats_controller/pages_test.exs
  +++ test/plausible_web/controllers/api/stats_controller/pages_test.exs
  +      assert json_response(conn, 200)["meta"]["date_range_label"] == "2 Jan 2021"
  +      assert json_response(conn, 200)["meta"]["comparison_date_range_label"] == "1 Jan 2021"
Fable 5 — verdict: fail
  --- lib/plausible/stats/breakdown.ex
  +++ lib/plausible/stats/breakdown.ex
       %{
         results: build_breakdown_result(results, query_with_metrics, metrics),
  -      meta: meta
  +      # `meta` is a `Jason.OrderedObject` - convert it to a plain map so that
  +      # callers can safely `Map.merge/2` extra fields into it. Merging into the
  +      # struct would add keys outside of its `values` field, which the JSON
  +      # encoder for `Jason.OrderedObject` silently ignores.
  +      meta: Map.new(meta.values)
       }

  --- lib/plausible_web/controllers/api/external_stats_controller.ex
  +++ lib/plausible_web/controllers/api/external_stats_controller.ex
  -  defp maybe_add_warning(payload, %Jason.OrderedObject{} = meta) do
  +  defp maybe_add_warning(payload, meta) do

  --- test/plausible_web/controllers/api/stats_controller/pages_test.exs
  +++ test/plausible_web/controllers/api/stats_controller/pages_test.exs
  +      assert json_response(conn, 200)["meta"] == %{
  +               "date_range_label" => "2 Jan 2021",
  +               "comparison_date_range_label" => "1 Jan 2021"
  +             }
The "failed" Opus 4.7 is semantically identical to the reference; the only difference is formatting for readability. Failing a solution on tastefulness for being more readable is absurd — and a reflex that suggests the scorer isn't judging the code's appropriateness at all, but something else.
LLM grader variance means that even the same single run, re-graded multiple times, produces flips in the overall tastefulness result roughly 20% of the time (for the compared models). Different grading models can halve the number of "tasteful" verdicts. With that much ~noise, aggregate results settle somewhere between meaningless and actively misleading.
Winter tire claims defy common sense
The claim that all-season tires freeze into solid blocks below 7°C (45°F) is persistent, widely repeated, and often imputed to Google's AI summaries. There's no benchmark to support it. British journalist Jonathan Benson has done exactly the kind of public tire testing that lets us check this claim, testing different tire families in various temperatures.
In dry conditions, summer tires keep the best grip down to 0°C, followed by all-seasons, with winter tires being worse by a substantial margin. In wet conditions, all-seasons beat summer tires at low temperatures — but winter tires still trail. The real-world conclusion: winter tire superiority is condition-specific, not a simple function of temperature. Cold alone doesn't warrant a switch, although icy or snowy conditions absolutely do.
Whether or not this matters for personal safety comes down to whether you spend meaningful time on snow-covered roads. The physics of collision severity suggests that even modest braking or handling improvements are worth money and effort for people who routinely face those conditions. The notion that you need "winter" rubber for any cold, dry road isn't one of them.


