2022 Research Roundup: Web Platform, Tools, and Workplace
The annual crop of industry surveys and reports once more spans web platform statistics, survey-based developer sentiment, employment arrangements, security, and assorted adjacent disciplines. The following summaries cover the key findings from each report published during the year.
Platform data: HTTP Archive and WebAIM
The HTTP Archive Annual State of the Web examined data from 8.3 million sites in the Chrome UX Report, covering how pages are built across content, user experience, publishing and distribution. The CSS chapter was written by Rachel Andrew and reviewed by figures including Chris Lilley and Jens Oliver Meiert.

CSS continues to contribute to overall page weight: weight at the 90th percentile rose 7%, in line with prior years. The most popular class name was .active, alongside vendor prefixes such as .fa- for Font Awesome and WordPress classes like .wp-, .has-large-font-size and .has-pale-cyan-blue-background-color. Pixels remain the most common unit for font-size.
The WebAIM Million evaluates accessibility across the top one million sites as measured by the WAVE stand-alone API, drawing domains from the Majestic Millions list, the Alexa Top 1,000,000 web sites and the DomCop top 10 million domains.
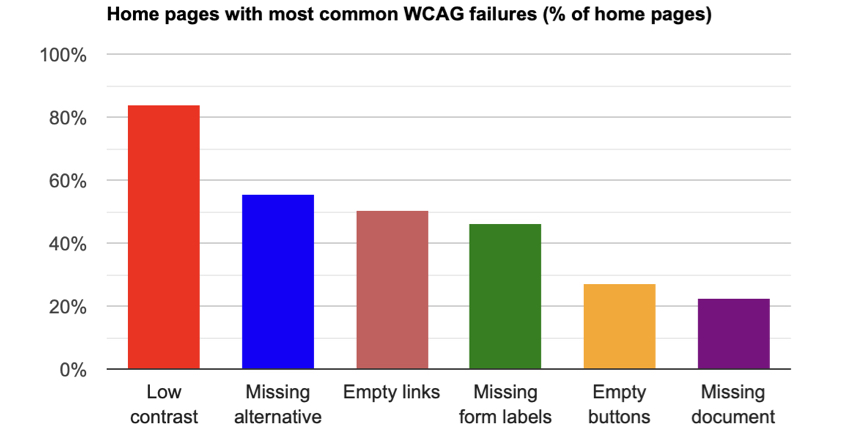
The number of distinct accessibility errors fell 1.1% since February 2021 — a modest improvement, but still a total of 50,829,406 errors, an average of 50.8 per site, and only those that could be detected.
What developers report: CSS, Jamstack, and open source
The State of CSS 2022 Survey polled developers on feature usage, awareness and satisfaction, drawing 8,714 responses worldwide. Large swathes of newer CSS remain unfamiliar: 46.7% of respondents are aware of only 40% or less of the features covered. Container queries show that gap sharply — 58% have heard of them, but just 12.6% have used them. The :has() selector is an outlier, with 54% awareness and 34.8% already using it.

Interest in CSS-in-JS is trending downward, accessibility features need more awareness, and Lea Verou's conclusion predicts CSS nesting and color manipulation will dominate in 2023.
The Jamstack Community Survey 2022 covers roughly 7,000 members of the Jamstack community. Four out of five developers now work remotely most of the time, and half of those would quit if required to return to an office. Self-identification shifted sharply: in 2021, 45% called themselves "front-end developers" and 32% "full-stack"; in 2022, those figures swapped to 32% front-end and 44% full-stack. WordPress remains the most widely used CMS at 59% of respondents, 22% of which is headless WordPress, while Notion is gaining traction in the Jamstack CMS space at 26%.
The 2022 State of Open Source, by the Open Source Initiative and OpenLogic, surveyed 2,660 developers over six weeks across 15 countries. 79% say they sponsor open source organizations. Among application development technologies, jQuery ranks first (31%), ahead of React (27%) and Angular (26%).

Interop 2022 and browser conformance
The Interop 2022 Dashboard is a live view rather than a published report, displaying results from the web-platform-tests suites that run daily. Its 2022 focus areas include Cascade Layers, Container Queries, the <dialog> element, Subgrid and viewport units.
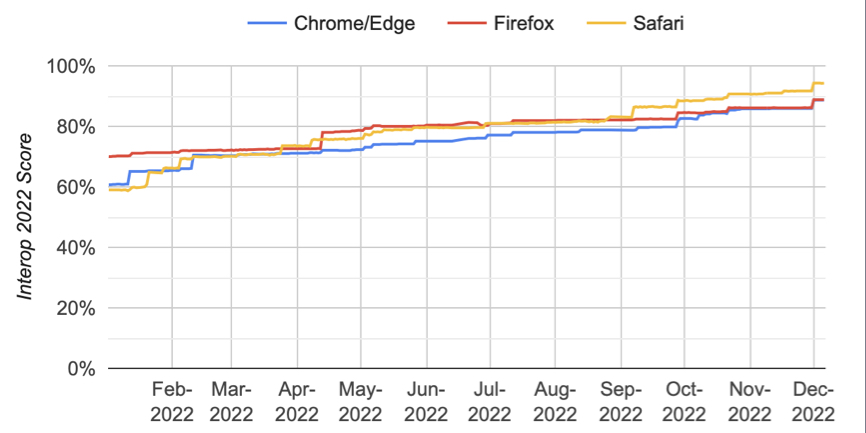
Safari currently leads the focus-area scores at 89%, with Firefox at 88% and Chrome/Edge at 84%. Among experimental builds, Safari Technology Preview reaches 94% while Firefox and Chrome/Edge sit at 88%.
Developer surveys: StackOverflow, GitHub, and Copilot
The StackOverflow 2022 Developer Survey gathered more than 70,000 responses on how developers learn, the tools they use, and their future wants. Search time looms large: 87% spend at least 30 minutes looking for answers to problems, 25% spend an hour or more, and a team of 50 developers spends between 333 and 651 hours per week looking up answers. JavaScript is the most used language for the tenth consecutive year, Rust is the most loved, and VS Code dominates as IDE at 74%.

GitHub's State of the Octoverse draws on platform activity rather than survey responses. 94 million developers used GitHub in 2022, up from 2.8 million in 2012, with 20.5 million joining this year alone. Repositories grew 20% year over year, contributions exceeded 3.5 billion, and only 20% of all repos are public. JavaScript remains the most used language; TypeScript's growth slowed after last year's surge and it stays fourth behind Python and Java.

A separate GitHub report examined Copilot's impact on developer productivity and happiness, drawing on survey results published in an academic paper plus external productivity research and qualitative feedback. Developers who use Copilot feel more productive, and they complete the same tasks roughly 55% faster. The described effect is a mental shift from writing code to checking code, with Copilot handling fiddly details such as auto-closing brackets.

The Software House State of Frontend 2022 surveyed 3,703 developers across all levels and backgrounds, and additionally polled 19 invited experts, Chris Coyier among them on styling tools. Its results span frameworks, hosting, SSGs, browser technologies, code management and testing.

Design systems and design tooling
The Sparkbox 2022 Design Systems Survey, covering adoption, contributions, design, technical debt and usage, received 219 submissions, down from 376 the previous year. Typography, colors, components and layouts are common inclusions, but developer-ready code (65%), accessibility guidelines (57%) and content guidelines (45%) are often missing. Only 65% of self-identified design system subscribers say they get what they need from their systems.
The UXTools.co 2022 Design Tools Survey, in its sixth edition, received 4,260 submissions. 82% of respondents have "designer" in their job title versus 6% who call themselves developers. Figma dominates UI design at 73%, followed by Adobe XD (6%) and Sketch (5%), and also leads basic UI prototyping and design system management. Notion tops the list for storing, tagging and organizing research.
Languages, demographics, and the Mac niche
The 2023 HackerRank Developer Skills Report was not fully accessible at the time of writing; its preview shows the top five used languages — Java, Python, SQL, C++ and JavaScript, in that order — making up the overwhelming majority of reported languages. Fastest-growing languages are TypeScript (182%), PHP (172%) and Go (125%), while Swift usage fell 42%.

The Tower Git Mac Dev Survey 2022 polled 2,506 macOS developers, down from 4,072. Most remain in the 30–44 age range (40.9%, down from 54.8%), with the largest single group at 35–39 (19.5%). JavaScript is still the most-used language (52.7%) and Swift the most-wanted (28.2%).

SlashData's Developer Nation 2022 Q1 Pulse Report ran its global online survey over ten weeks between December 2021 and February 2022. Its demographics are 81% men and 17% women. Its top five languages match HackerRank's except that C# displaces JavaScript. Artificial intelligence software is the top emerging area of interest, ahead of augmented reality, robotics, cryptocurrency and blockchain.

APIs, WordPress, and government services
Postman's 2022 State of the API Report surveyed more than 37,000 developers, up from 28,000 last year and 13,500 in 2020. The share believing their companies will invest more or the same in APIs fell to 89% from 67% adopting API-first (as reported last year), though on a larger pool. Postman API requests rose from 855 million last year to 1.13 billion. Popular APIs include Salesforce, Twitter and, newly, Notion.

The CodeinWP WordPress Hosting Survey 2022 drew 3,400 submissions from blog readers. GoDaddy is the most-used host at 11.8%, followed by Bluehost (8.4%), Hostinger (4.8%) and HostGator (3.4%). GoDaddy also ranks last in satisfaction at 6.3/10, while WP Engine scores highest at 9.2/10 on just 21 respondents versus GoDaddy's 377. Many respondents listed "WordPress" as their host, possibly confusing WordPress.com with self-hosted installs.

WordPress LMS Websites: A Data Study by Sell Courses Online focuses on learning management systems in the WordPress ecosystem. Most sites are cheap to run: 41.3% spend under $50/month and 76.2% under $250, typically using a freemium LMS model. The stack typically includes WooCommerce for course sales (65.3%), Elementor as page builder (57.5%), the Astra theme (19%, with 66% naming others) and Paid Memberships Pro for accounts (13.5%). LearnDash is the most popular LMS plugin (34%), ahead of LearnPress (31%) and Tutor LMS (19%).

The UN E-Government Survey 2022, the eleventh edition of a biennial publication first issued in 2001, measures online development across member states using three composite indices covering online services, cybersecurity, digital proficiency efforts and technology use in crises such as COVID-19. Denmark, Finland and the Republic of Korea lead the 2022 rankings for scope and quality of online services, telecommunication infrastructure and human capacity.

Workplace learning and remote work
LinkedIn's sixth Workplace Learning Report surveyed 1,444 learning and development professionals and 610 learners in November 2021. 46% of L&D professionals report a wider technological skill gap on their teams, and 49% say executives worry employees lack the skills to meet business strategy. Demand for L&D professionals has risen along with pay, and only 8% expect their L&D budget to shrink. Priority programs are diversity, equity and inclusion (45%), leading through change (42%), in-person training (41%, up from 25%), upskilling and reskilling (41%), and digital fluency (30%).

UpWork's The Great Work Teardown examines changing perspectives on when, where and how people work, though no methodology was published. 50% of businesses report higher turnover versus pre-pandemic, 38% plan to spend more on independent remote freelancers, and 37% are fully remote today with 28% expecting to be within a year. On the employee side, 61% say they are more productive remotely; businesses report a 45% productivity increase and a 63% reduction in unscheduled absences.

UpWork's 2022 Labor Market Trends and Insights, based on a survey of 1,000 hiring professionals plus a separate study of 6,000 working professionals, finds 78% of hiring pros have used remote freelancers and 52% are using more than before. Higher turnover since pre-pandemic is reported by 60% of mid-sized company managers versus 25% at small companies. About 45% of hiring managers plan to counter turnover with more learning programs, and roughly 50% are considering higher salaries and bigger benefit packages to retain staff.

Security research
The Reblaze 2022 State of Web Security Survey asked 300 web security professionals about their biggest threats. DDoS attacks were most common, reported by half of participants, followed by SQL injections (38%) and ransomware (29%), with ransomware rated the most severe. The report cites a U.S. Treasury finding that U.S. firms paid $590 million in ransomware attacks in the first half of 2021 alone. 90% use a public cloud, AWS leading at 67%. API security is the top priority.

Trend Micro's 2022 Midyear Cybersecurity Report polled 6,297 IT security decision-makers in 29 countries. 62% report blindspots in their defense strategies and 43% believe their exposure is out of control; 37% cite cloud assets as the area with least insight. The report also details specific threats and includes a section on cybersecurity in the Russia-Ukraine conflict.

1Password's parenting and online life report, produced with Malwarebytes and based on a Method Research survey of 1,000 parents and 1,000 children born between 1997 and 2009, collected data in August. 74% of parents think they keep their kids safe while only 51% of kids agree, and 74% of kids have ways to get around monitoring, with 9% claiming a secret device. Cyberbullying is the top concern for parents (73%) and kids (66%). 73% of kids wish parents would ask permission to post photos of them, while only 34% of parents do, and 39% don't believe they need to. 11% of kids say they've been stalked or bullied because of something a parent posted, and 12% report harm such as hacked accounts, stolen identities or damaged credit.

IoT, email, and closing notes
The Eclipse Foundation 2022 IoT & Edge Developer Survey polled 910 developers, committers, architects and decision-makers between April and June 2022 on IoT trends, including AI and edge computing. It offers granular detail on the stacks developers use and overarching concerns, such as 64-bit ARM architectures gaining ground with gateway and edge node suppliers.

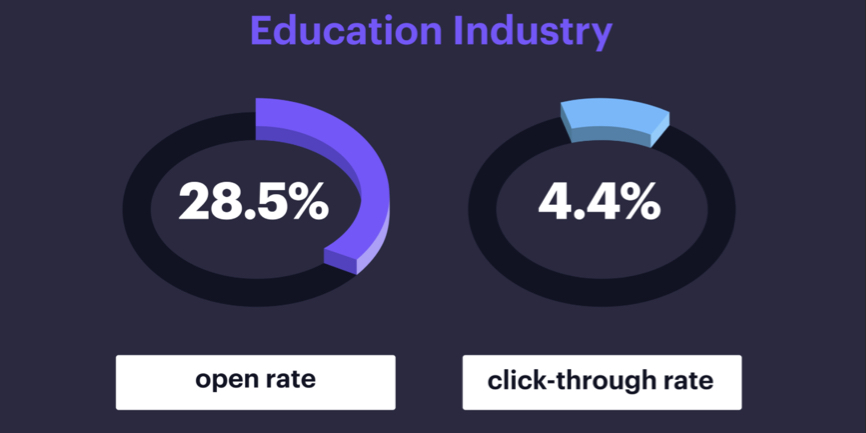
CampaignMonitor's Ultimate Email Marketing Benchmarks for 2022 analyzes 100 billion emails delivered on its platform in 2021, broken down across 19 industries. Globally, a 21.5% open rate and 2.3% click-through rate are average. Monday has the highest average open rate (22%) and Sunday the lowest (20.3%); click-through peaks on Tuesday (2.4%) and is lowest on Saturday and Sunday (2.1%).
Across all 27 reports covered, a caveat applies: many lack the scientific methods needed for decision-making and have sample sizes too small to reflect reality accurately. Some reports are annual, some one-off, and others appear irregularly. Two surveys were open as this was written — the 2022 State of JavaScript and the 2022 WordPress Annual Survey.