
The Debugging Cost at AI Scale
At Meta's operational scale, even minor GPU underutilization translates into substantial energy waste and lost capacity. With training workloads spanning days or weeks and inference systems handling hundreds of trillions of model executions daily, performance bottlenecks delay product launches and limit user-serving capacity. The company built Zoomer as an automated platform to profile, debug, and optimize AI workloads across this infrastructure, generating tens of thousands of profiling reports daily for teams across all Meta apps.
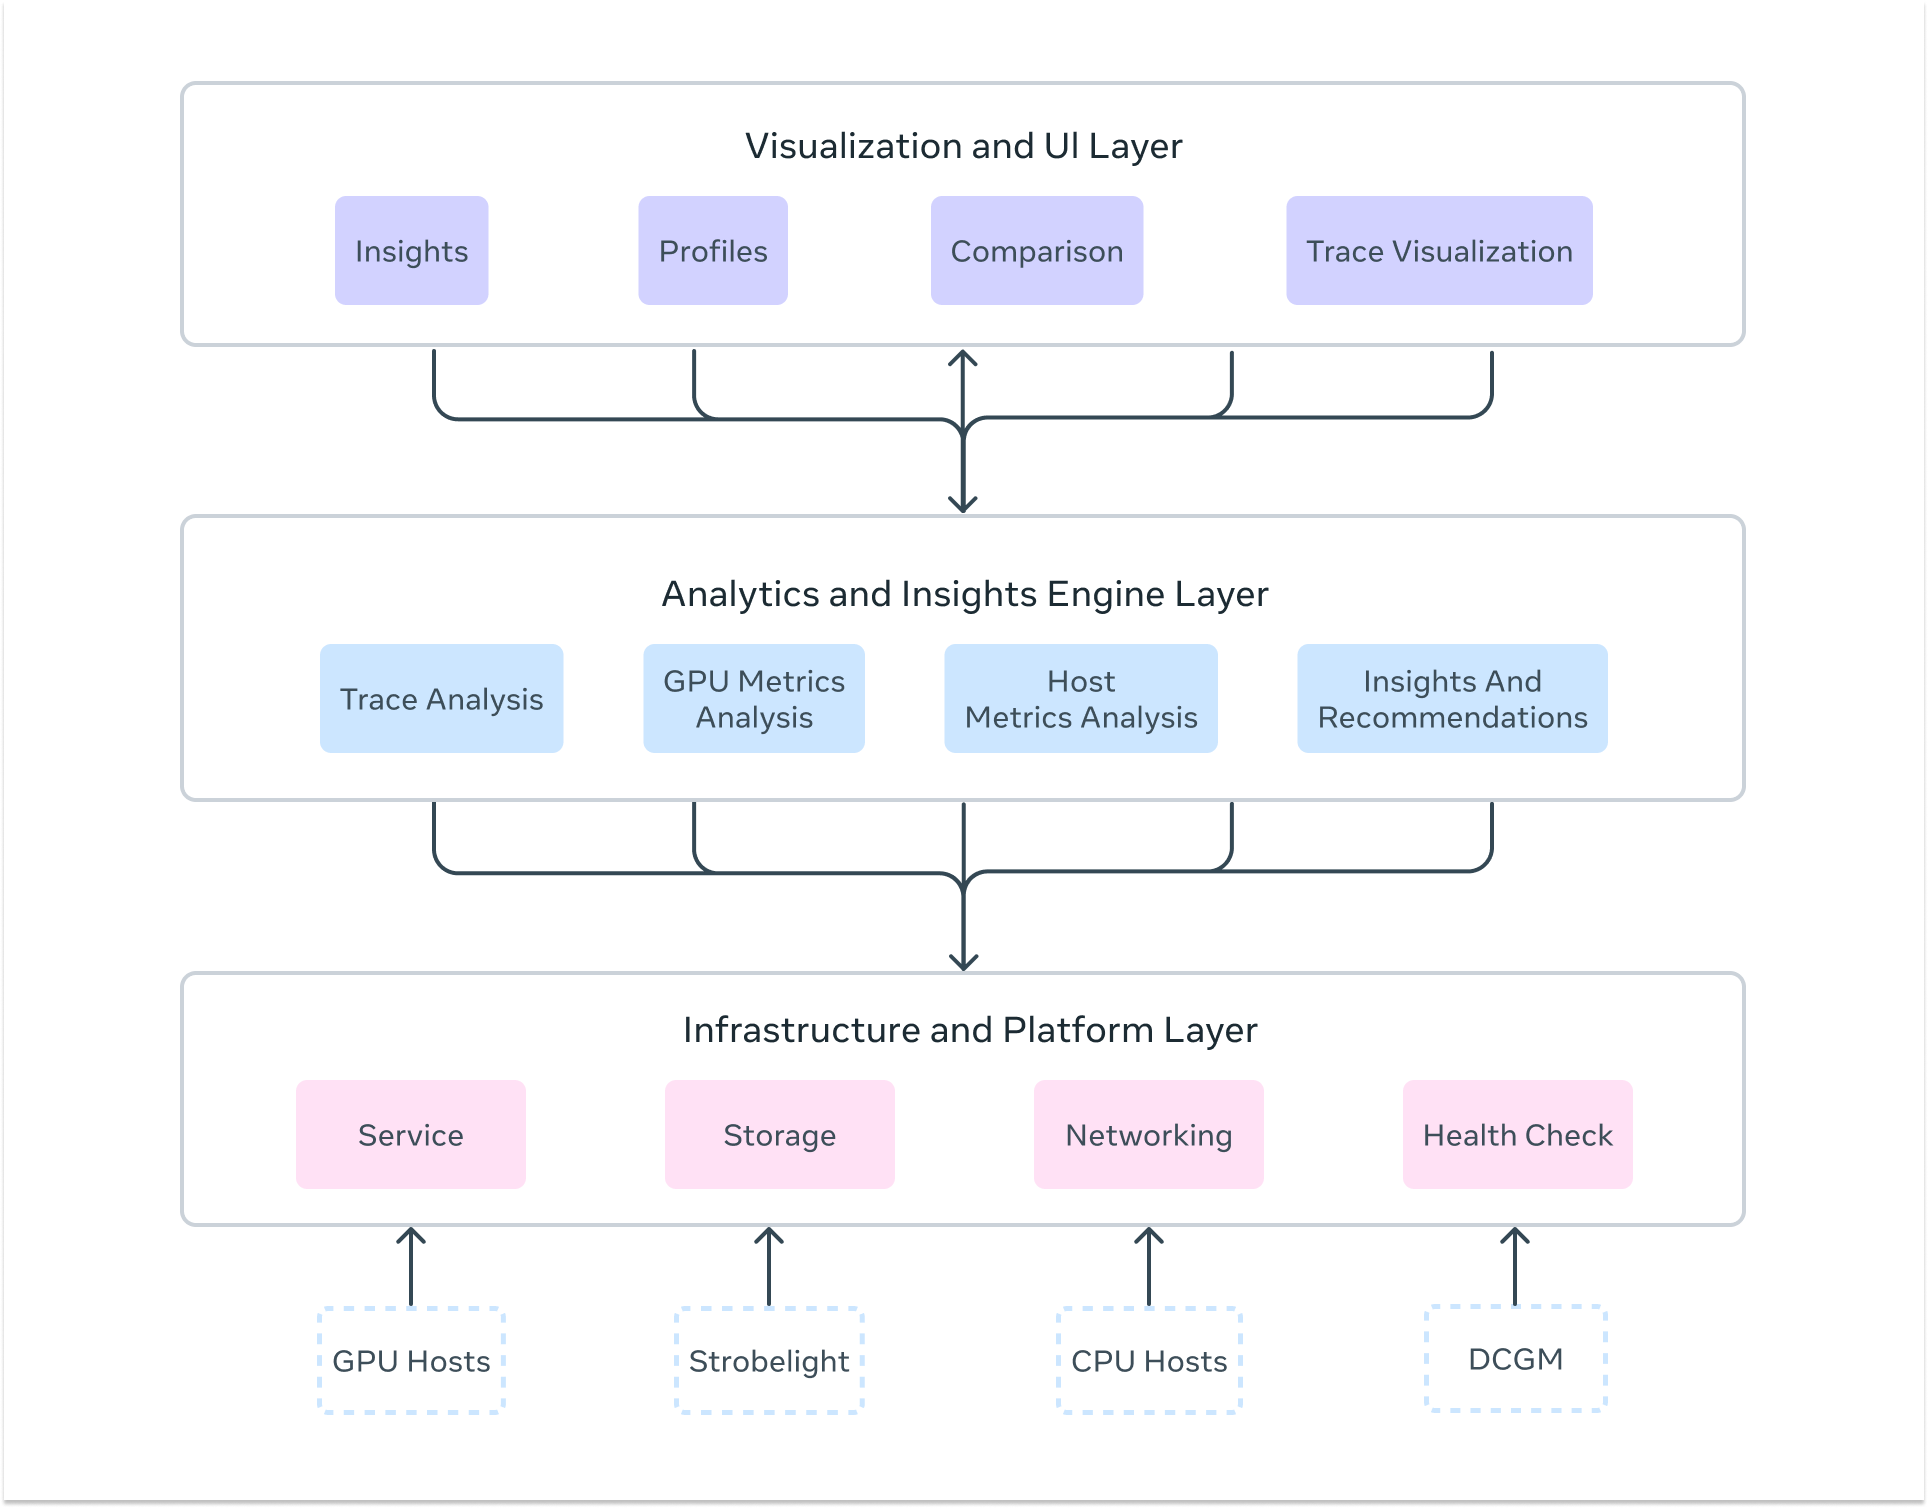
Zoomer's architecture is organized into three layers. The infrastructure layer provides distributed storage via Manifold for trace data, fault-tolerant processing pipelines, and low-latency collection with automatic triggers across thousands of hosts. The analytics engine integrates GPU trace analysis through Kineto and NVIDIA DCGM, CPU profiling via StrobeLight, host metrics from dyno telemetry, and specialized analyzers for communication patterns, stragglers, memory allocation, and inference request flows. The visualization layer renders interactive timelines across ranks, multi-iteration views, percentile dashboards, Perfetto-integrated kernel inspection, and automated summaries of critical bottlenecks.
From Trigger to Insight: The Profiling Pipeline
Zoomer activates through both automatic and on-demand mechanisms. For training workloads, profiling triggers automatically around iteration 550-555, capturing stable-state performance while avoiding startup noise. Inference profiling can be triggered on demand for debugging or integrated with automated load testing systems for continuous monitoring.
Each profiling session captures multiple data streams simultaneously:
- GPU metrics: SM utilization, memory bandwidth, Tensor Core utilization, power consumption, and clock frequencies via DCGM.
- Execution traces: Kernel-level GPU operations, memory transfers, CUDA API calls, and communication collectives through PyTorch Profiler and Kineto.
- Host data: CPU usage, memory, network I/O, and storage patterns via dyno telemetry.
- Application annotations: Training iterations, forward/backward passes, optimizer steps, and data loading phases.
- Inference specifics: Request rates, server latency, memory allocation patterns, and Thrift request-level profiling via Strobelight's Crochet profiler.
- Communication analysis: NCCL collective operations, inter-node patterns, and network utilization.
Raw data flows through a distributed processing pipeline that runs automated detection for stragglers, bottleneck types (CPU-, GPU-, memory-, or communication-bound), critical execution paths, efficiency anti-patterns, parallelism interactions, memory leaks, and load imbalance. Results surface as interactive timelines, drill-down dashboards, Perfetto trace viewers, automated insight summaries, and executable notebooks for re-running jobs with suggested optimizations.
Advanced Capabilities by Workload Type
Zoomer includes purpose-built tools for training, inference, and GenAI workloads, along with universal analysis features that span hardware platforms.
Training Features
Straggler analysis identifies ranks that lag significantly behind others in distributed jobs, pointing to root causes like sharding imbalance or hardware faults. Critical path analysis isolates the longest execution paths in PyTorch applications for accurate improvement projections. Advanced trace manipulation compresses, filters, and segments trace files exceeding 2GB per rank, enabling analysis of large-scale training jobs that were previously impossible to process.
Inference Features
A single-click optimization workflow identifies bottlenecks and triggers automated load tests, delivering QPS improvements of +2% to +50% depending on model characteristics. Request-level deep dives using the Crochet profiler expose queue time bottlenecks and serving inefficiencies that aggregate metrics miss. Realtime memory profiling tracks GPU allocations to surface leaks and optimization opportunities live.
GenAI-Specialized Support
LLM Zoomer is a dedicated platform for workloads exceeding 100,000 GPUs, offering N-dimensional parallelism visualization and GPU efficiency heat maps across thousands of devices. Post-training workflows for SFT, DPO, and ARPG are supported with separate generator and trainer profiling.
Universal Intelligence
Holistic Trace Analysis (HTA) diagnoses distributed training bottlenecks across communication overhead, workload imbalance, and kernel inefficiencies, with automatic load balancing recommendations. The Zoomer Actionable Recommendations engine (Zoomer AR) uses machine learning to detect anti-patterns and generate auto-fix diffs, optimization notebooks, and one-click job relaunches. Multi-hardware profiling provides native support across NVIDIA GPUs, AMD MI300X, MTIA, and CPU-only workloads with consistent analysis regardless of platform.
Efficiency Gains Cascade Through the Stack
Zoomer’s optimization work turns individual debugging wins into system-wide gains. The chain runs from bottleneck detection to metric improvement, then on to faster workflows, lower resource usage, and ultimately reduced energy consumption and cost.
Training-Side Optimizations
On the training side, Zoomer targets GPU utilization, memory bandwidth, and communication patterns. Noteworthy results include:
- Algorithmic fixes: Power savings across the training fleet by resolving reliability issues that dragged down low-efficiency jobs.
- Training time cuts: Ads relevance models saw a 75% reduction in training time during 2024, translating to a 78% drop in power consumption.
- Memory fixes: One-line code changes addressing inefficient memory copies — flagged by Zoomer — yielded 20% QPS improvements at minimal engineering cost.
Inference-Side Gains
For inference, Zoomer concentrates on latency, throughput, and serving efficiency. It investigates kernel execution, memory access patterns, and serving parameters to maximize requests per GPU. Results include:
- Parameter tuning: Automated GPU and CPU bottleneck identification drove power consumption down 10% to 45%.
- Capacity boosts: GPU trace analysis improved serving QPS and optimized overall serving capacity.
Compounding Returns at Massive Scale
The payoff grows with cluster size. On a 32k GPU benchmark, resolving a broadcast issue delivered 30% speedups; a 64k GPU configuration saw 25% speedups after just one day of optimization work.
What’s Next for AI Debugging
Zoomer’s roadmap targets several fronts as AI workloads scale: unified performance insights across heterogeneous hardware, including MTIA and next-generation accelerators; advanced analyzers for proactive optimization; inference tuning through serving parameter optimization; and more automated, accessible tools so all engineers can drive performance improvements directly.
As Meta’s AI infrastructure grows, Zoomer underpins both innovation velocity and sustainability goals.


