A Plugin Boundary Inside lldb-server
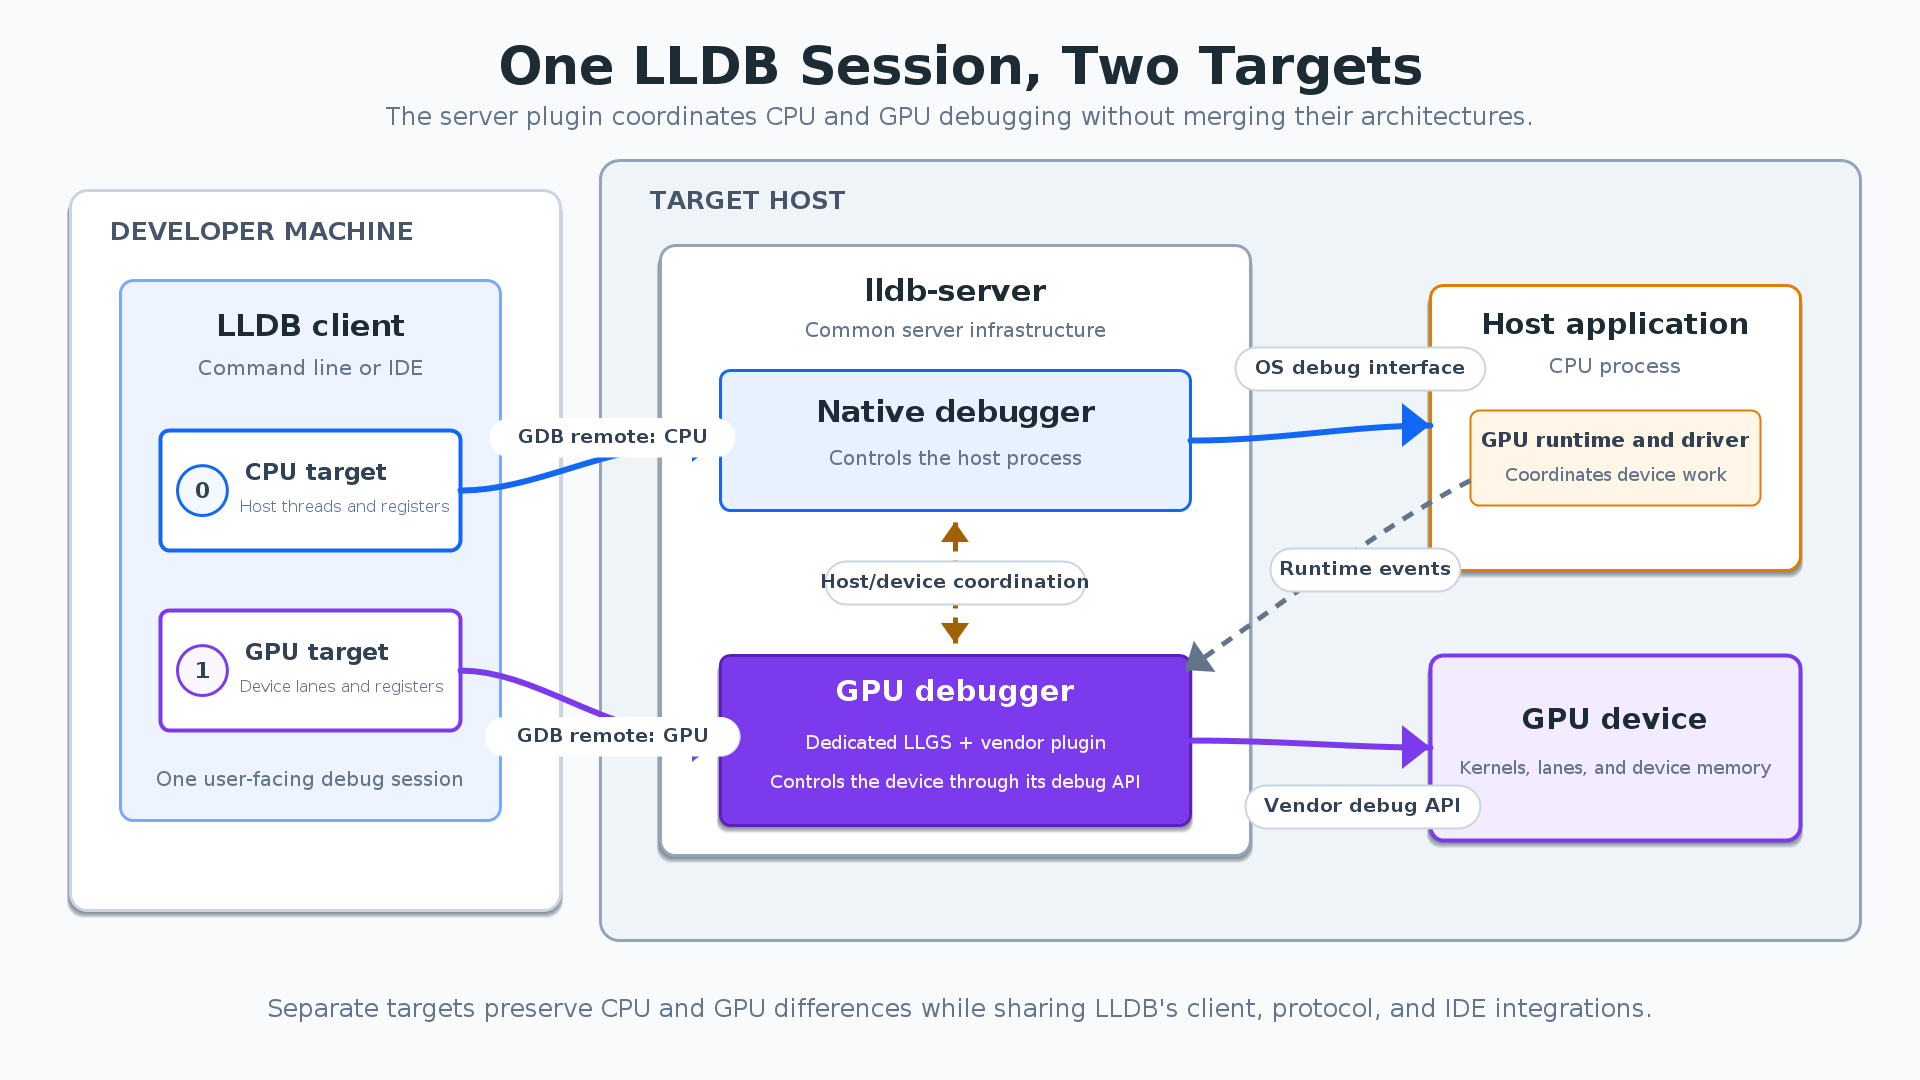
LLDB launches or attaches to programs through a companion process called lldb-server, which performs low-level debugging operations and talks to the client over the GDB remote protocol — memory reads, register inspection, execution control, breakpoints. Because the server already owns the native process, it is also where coordination with an accelerator runtime belongs.
The architecture under development at Meta adds a vendor-neutral accelerator plugin interface to lldb-server, keeping the shared debugger independent of any single GPU vendor. "GPU" in this context means specific devices; "accelerator" means LLDB's broader plugin abstraction. A hardware-specific backend translates a vendor's device debugging API into concepts LLDB already models: processes, threads, registers, memory, modules, and stop reasons. Common improvements to the command line, remote protocol, symbol handling and IDE integration then benefit every accelerator, while vendors retain ownership of what is unique to their hardware and driver stack.
CPU-only applications keep using the existing native debugging path and incur no runtime computational overhead; support activates only when the debugged application uses a supported GPU runtime.
Why a Single Process Model Breaks Down
Conventional debuggers assume one process with one architecture and a consistent view of threads, registers and memory. GPU programs break those assumptions on several fronts:
- A host process may run on x86-64 while its kernels use a different instruction set.
- CPU threads have familiar register contexts; a GPU may execute groups of lanes in lockstep.
- Host and device pointers can refer to different address spaces, so the same address such as
0x1000can name different locations on each side. - A GPU may expose thousands of execution lanes, which do not map cleanly onto the thread model most debuggers present.
Folding this state into one artificial process makes every operation conditional on whether it applies to CPU or GPU — registers, memory reads, breakpoints, stepping, stop events — and forces a unified memory map over address spaces that can be independent. Vendor debuggers such as AMD's ROCgdb and NVIDIA's CUDA-GDB provide deep platform support but tend to reimplement and maintain common debugger capabilities separately. The LLDB architecture draws a clear boundary instead of hiding the differences.
Two Targets, Debugged as One
The CPU and accelerator are represented as separate LLDB targets. Each carries its own architecture and is backed by a debugger process holding its threads, registers, address space and execution state. The CPU uses LLDB's established native path; once the accelerator becomes available, the plugin supplies a second connection from which LLDB creates the device target. The targets stay technically independent while appearing in a single LLDB or IDE session, avoiding any merger of incompatible CPU and GPU concepts.
Session setup follows a short sequence:
- LLDB connects to
lldb-serverand discovers the available accelerator plugins. - A plugin may ask LLDB to set internal breakpoints in the host process, marking runtime events such as the point where GPU debugging can begin.
- When the host reaches one,
lldb-servernotifies the plugin, which initializes the vendor API and prepares an accelerator debugging endpoint. - LLDB creates the second target and connects; device threads, registers, memory, modules and breakpoints then use LLDB's existing abstractions.
Structured actions coordinate the two sides: a plugin can request CPU breakpoints, supply connection information, report device modules, and synchronize host and device execution. The protocol states what the debugger needs to do without leaking vendor API details to the client.
A mock accelerator plugin exercises this flow without specialized hardware, allowing the LLVM test suite to verify discovery, breakpoint coordination, connection creation and basic device state — valuable for developing shared infrastructure that can be reviewed and tested independently of any particular GPU.
Example Session
A vector dot-product HIP sample produced this abridged session:
|
| The pending breakpoint resolves when the GPU module loads, and the backtrace comes from the GPU target. |
Beyond Live Sessions
The plugin boundary is defined in terms of debugger operations rather than any GPU platform's concepts, which lets it span devices with very different instruction sets, runtime APIs and execution models. The framework also covers postmortem GPU debugging: GPU core-dump plugins share a common base class for their LLDB integration, while vendor implementations provide device-specific thread, register, memory and module state.
GPU debugging efforts at Meta already use the architecture. Since the company runs a heterogeneous fleet with differing hardware and software stacks, multiple efforts relying on the same model serves as validation: the common LLDB layer can stay stable while each backend represents its own device accurately.
Upstream Status and Next Steps
Most of the common framework has been upstreamed to LLVM at the time of writing, covering:
- the
lldb-serverplugin interface; - GDB-remote packets for plugin discovery, initialization, runtime-event coordination and GPU connection creation;
- association of CPU and GPU debugger processes while preserving their independent architectures;
- multiple address spaces;
- hardware-independent mock tests.
The remaining pieces are expected upstream soon. The goal going forward is to finish that upstreaming and expand the vendor integrations built on it, so that adding new hardware to LLDB requires only a vendor-specific plugin rather than a separate debugger to build and maintain.