
Why Meta built a dedicated SLO platform
At Meta's scale—with thousands of engineers shipping code and iterating on features continuously—maintaining reliable experiences for users depends on having clear, shared expectations for every product and service. To meet that need, the company built SLICK, a centralized store for service-level indicators (SLIs) and service-level objectives (SLOs).
Before SLICK, SLO definitions lived in dashboards, documents, and various tools. Finding a team's SLOs could take an hour of searching or asking around, and metric data was rarely retained at full granularity beyond a few weeks. SLICK addresses both problems by offering:
- A unified way to define SLOs across services
- Metric data with up to per-minute granularity and up to two years of retention
- Standardized visualizations and insights for SLI/SLO metrics
- Periodic reliability reports sent to internal groups for reviews
Making reliability discoverable
SLICK establishes a standard model for reliability, which means service owners across the company can use the same vocabulary when discussing performance. New service owners can start following company-wide standards at design time rather than retrofitting later.
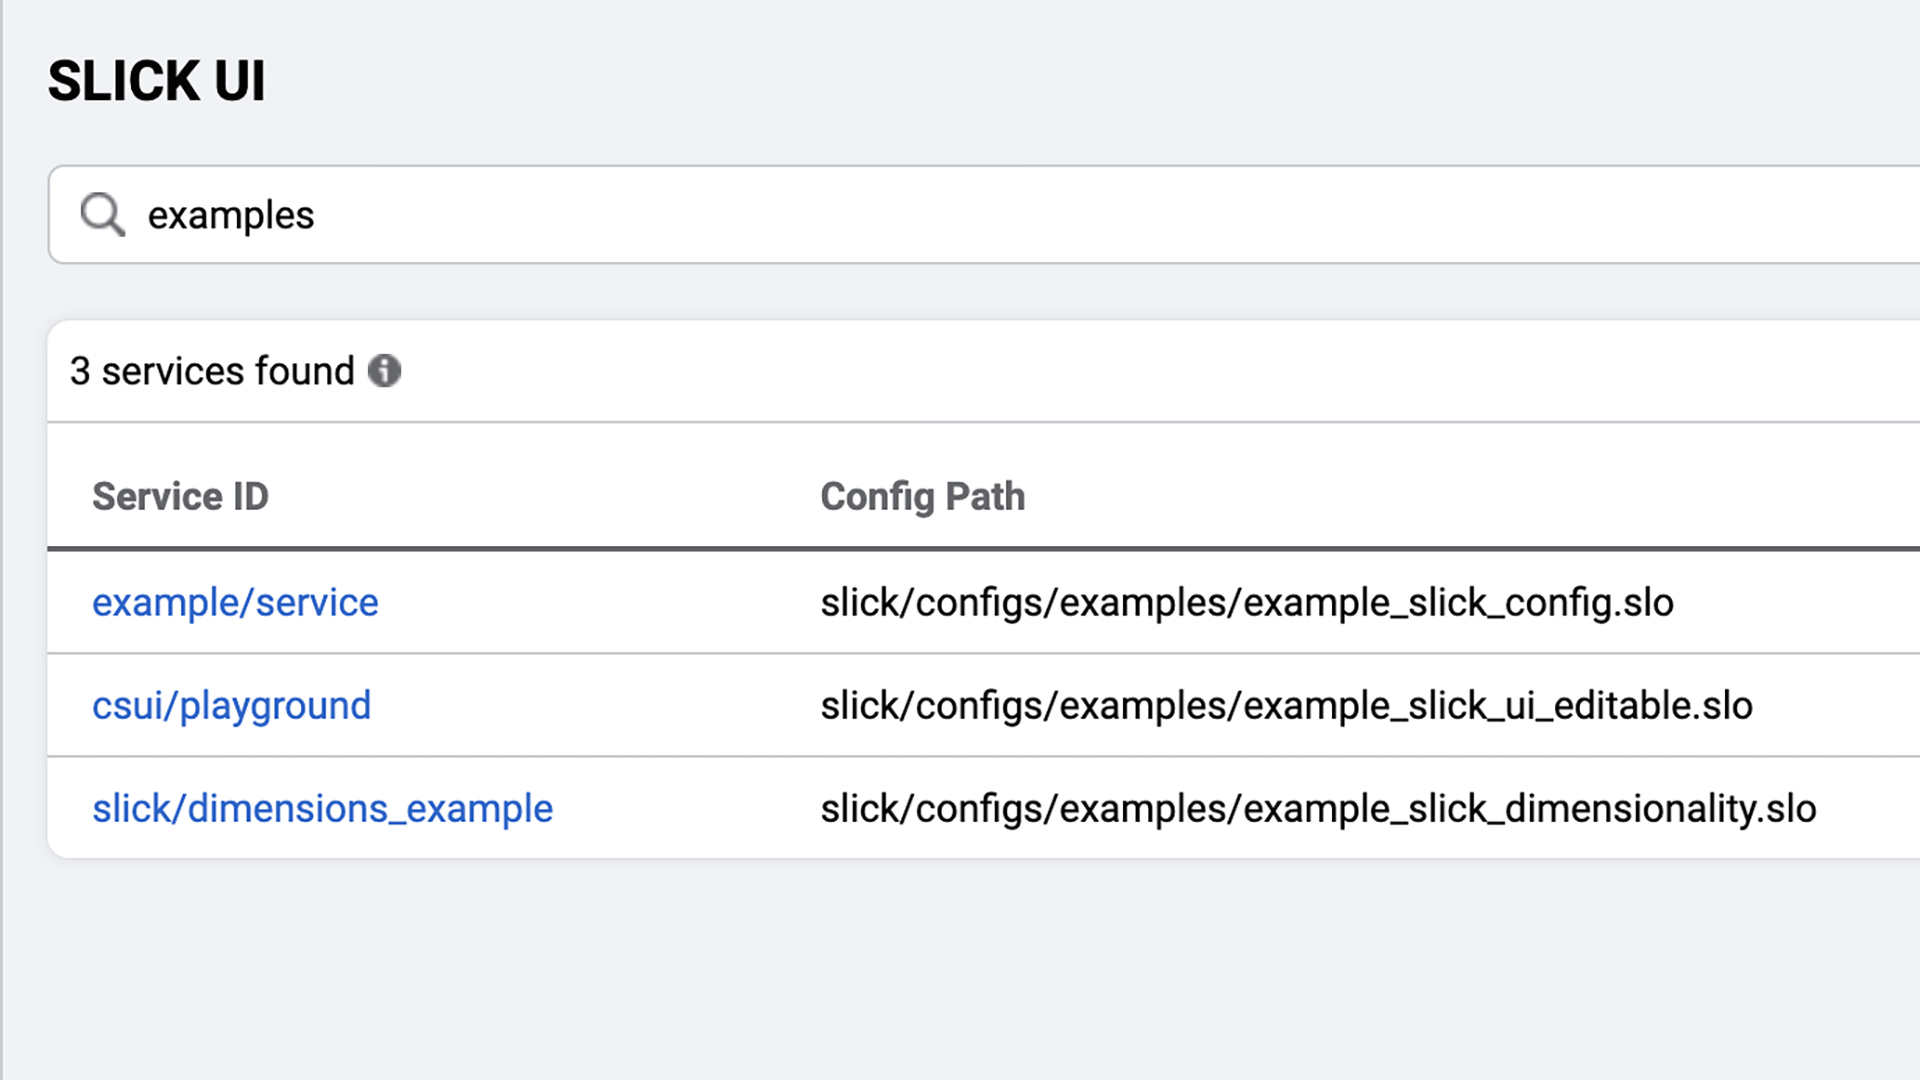
The platform also makes it easy to find reliability data for any onboarded service by name. An index of services links directly to dashboards with standard visualizations, so a single click reveals whether a service currently meets expectations—and if not, lets teams immediately start investigating why.
Long-term visibility into trends
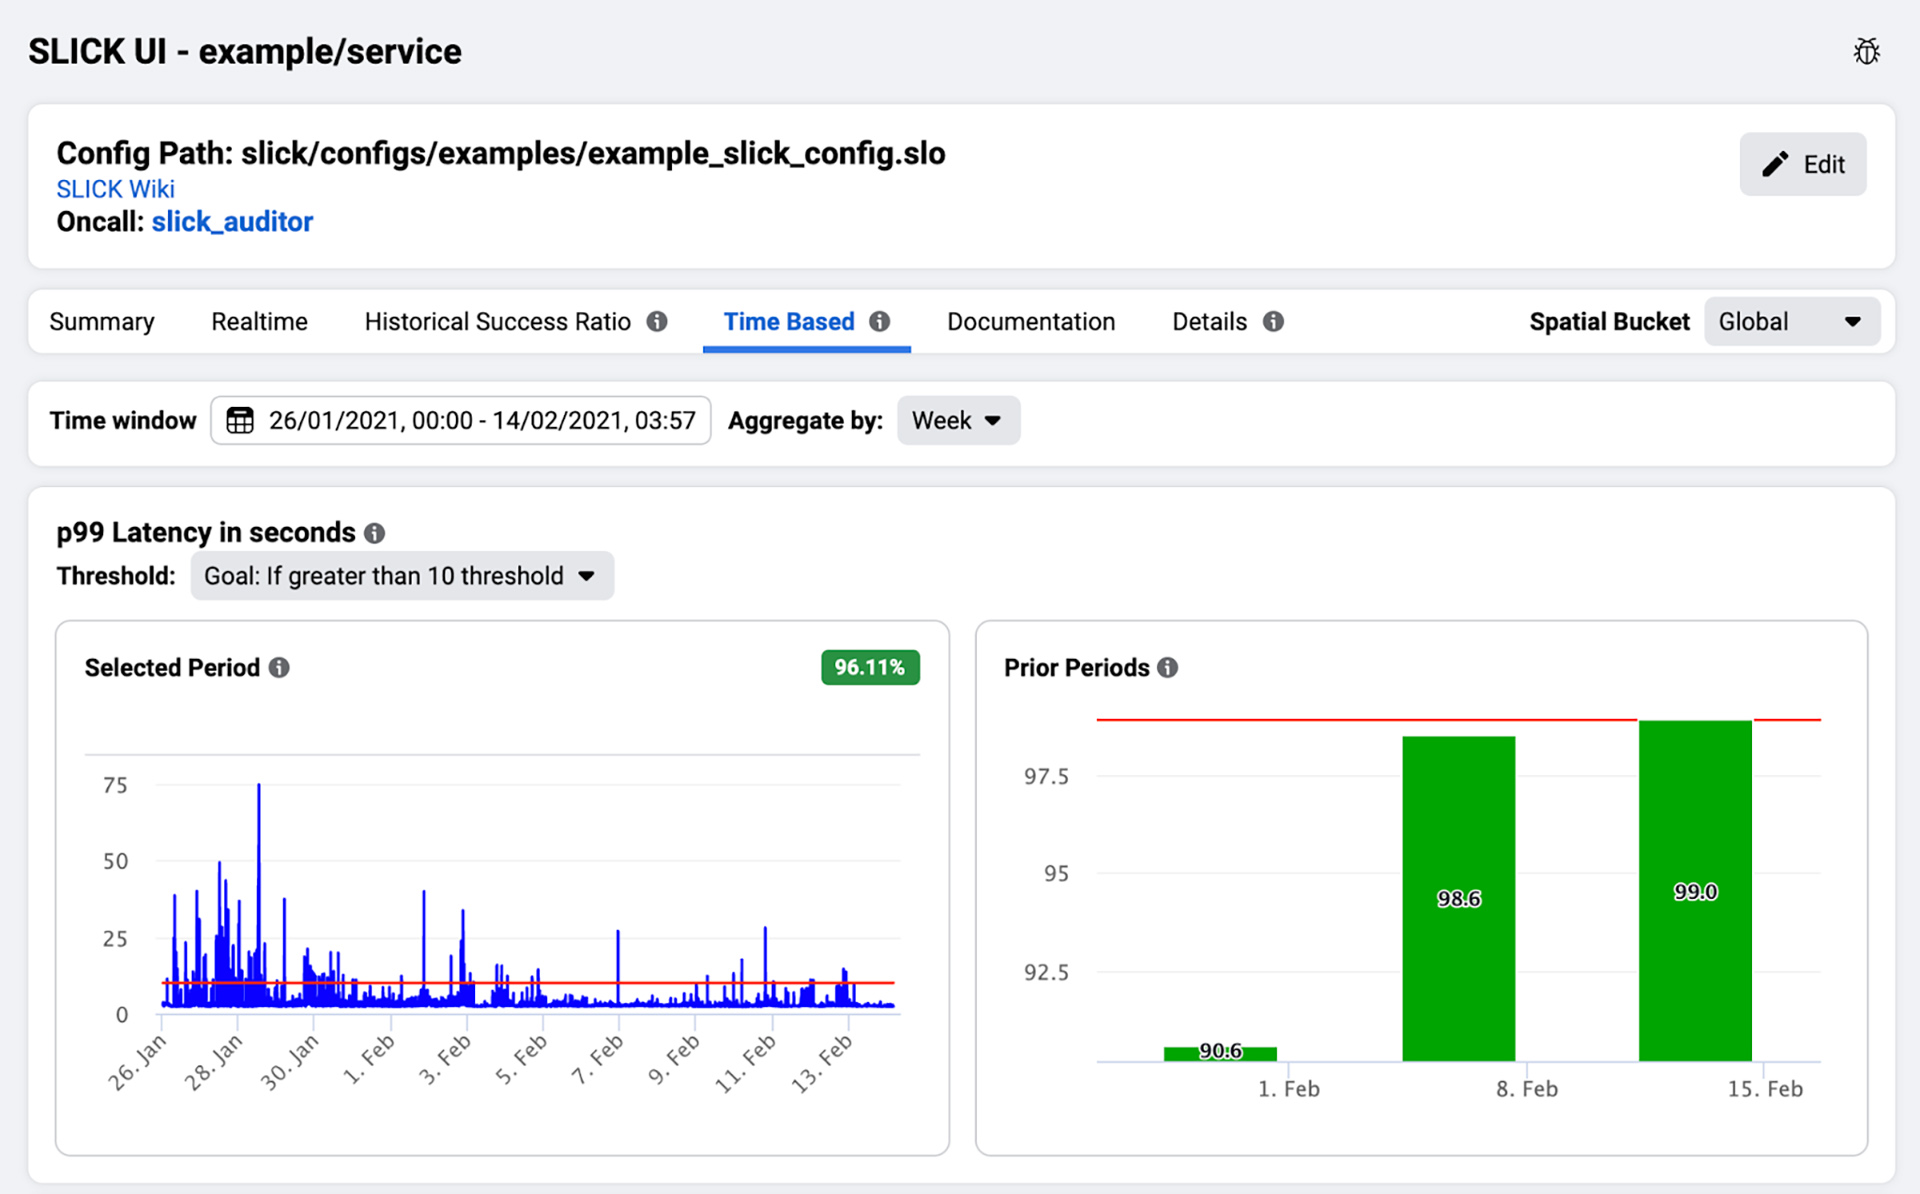
Reliability regressions are not always obvious. A single bad deployment can cause a sharp drop, but incremental changes may gradually erode performance over time. SLICK's retention of full-granularity data for up to two years makes it possible to spot both patterns.
The system captures SLI time series every hour via a data pipeline and stores the data in a sharded MySQL database. The stored insights are accessible to engineers, technical program managers, and leadership alike, helping everyone understand long-term trends that might otherwise go unnoticed.
SLOs embedded in daily workflows
To make SLOs a practical part of engineering culture, SLICK integrates with existing tooling. During a large incident, service owners can pull up SLOs in on-call tools to see side-by-side how the incident affected user experience. SLOs can also serve as criteria for declaring incidents, so many systems use them to trigger alerts for problems users are actually facing.
These integrations create a funnel: teams that interact with SLOs through other tools often end up onboarding their services to SLICK for deeper insights.
Onboarding to SLICK
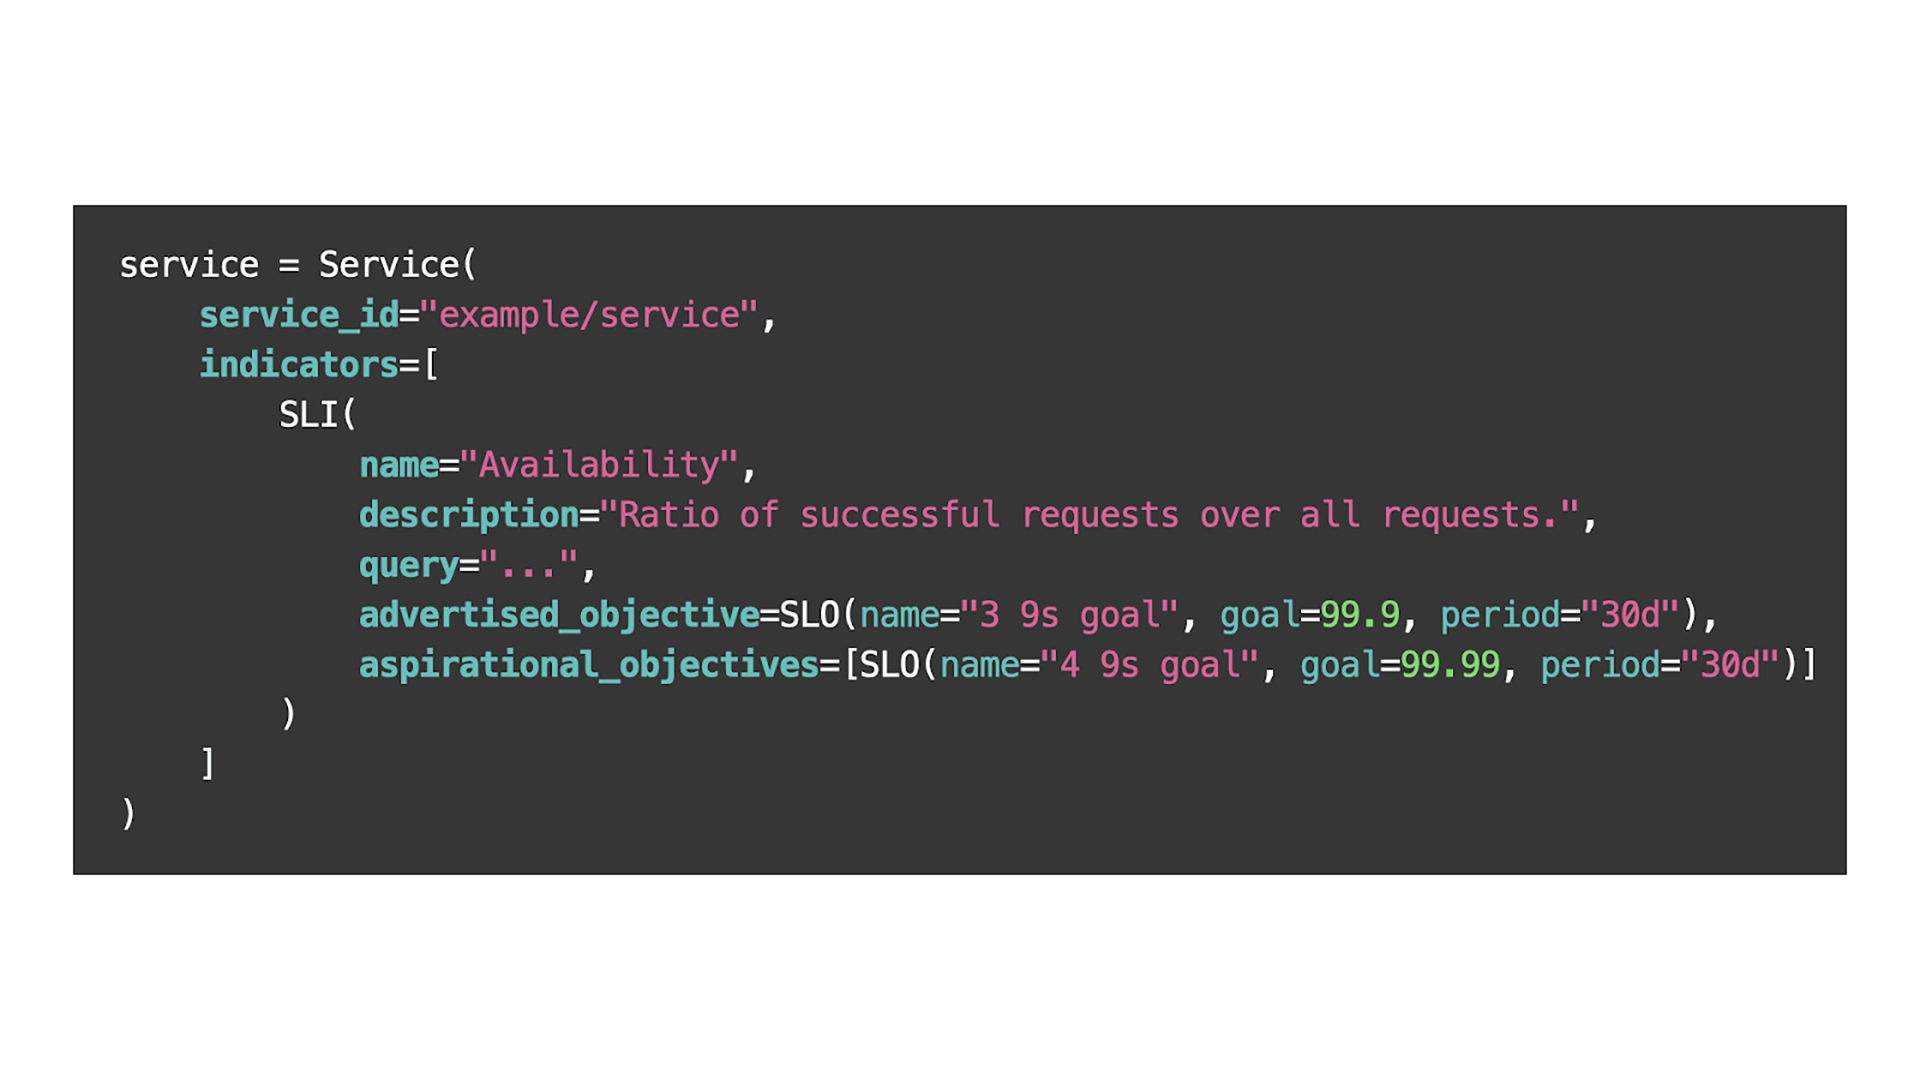
Service owners can onboard by using an editing UI or by writing a configuration file in SLICK's domain-specific language (DSL). A config includes the service name, queries that produce SLI time series, and associated SLOs.
Interfaces for service owners
Dashboards
SLICK dashboards show real-time SLI data and historical trends drawn from long-term, high-retention storage.
Periodic reports
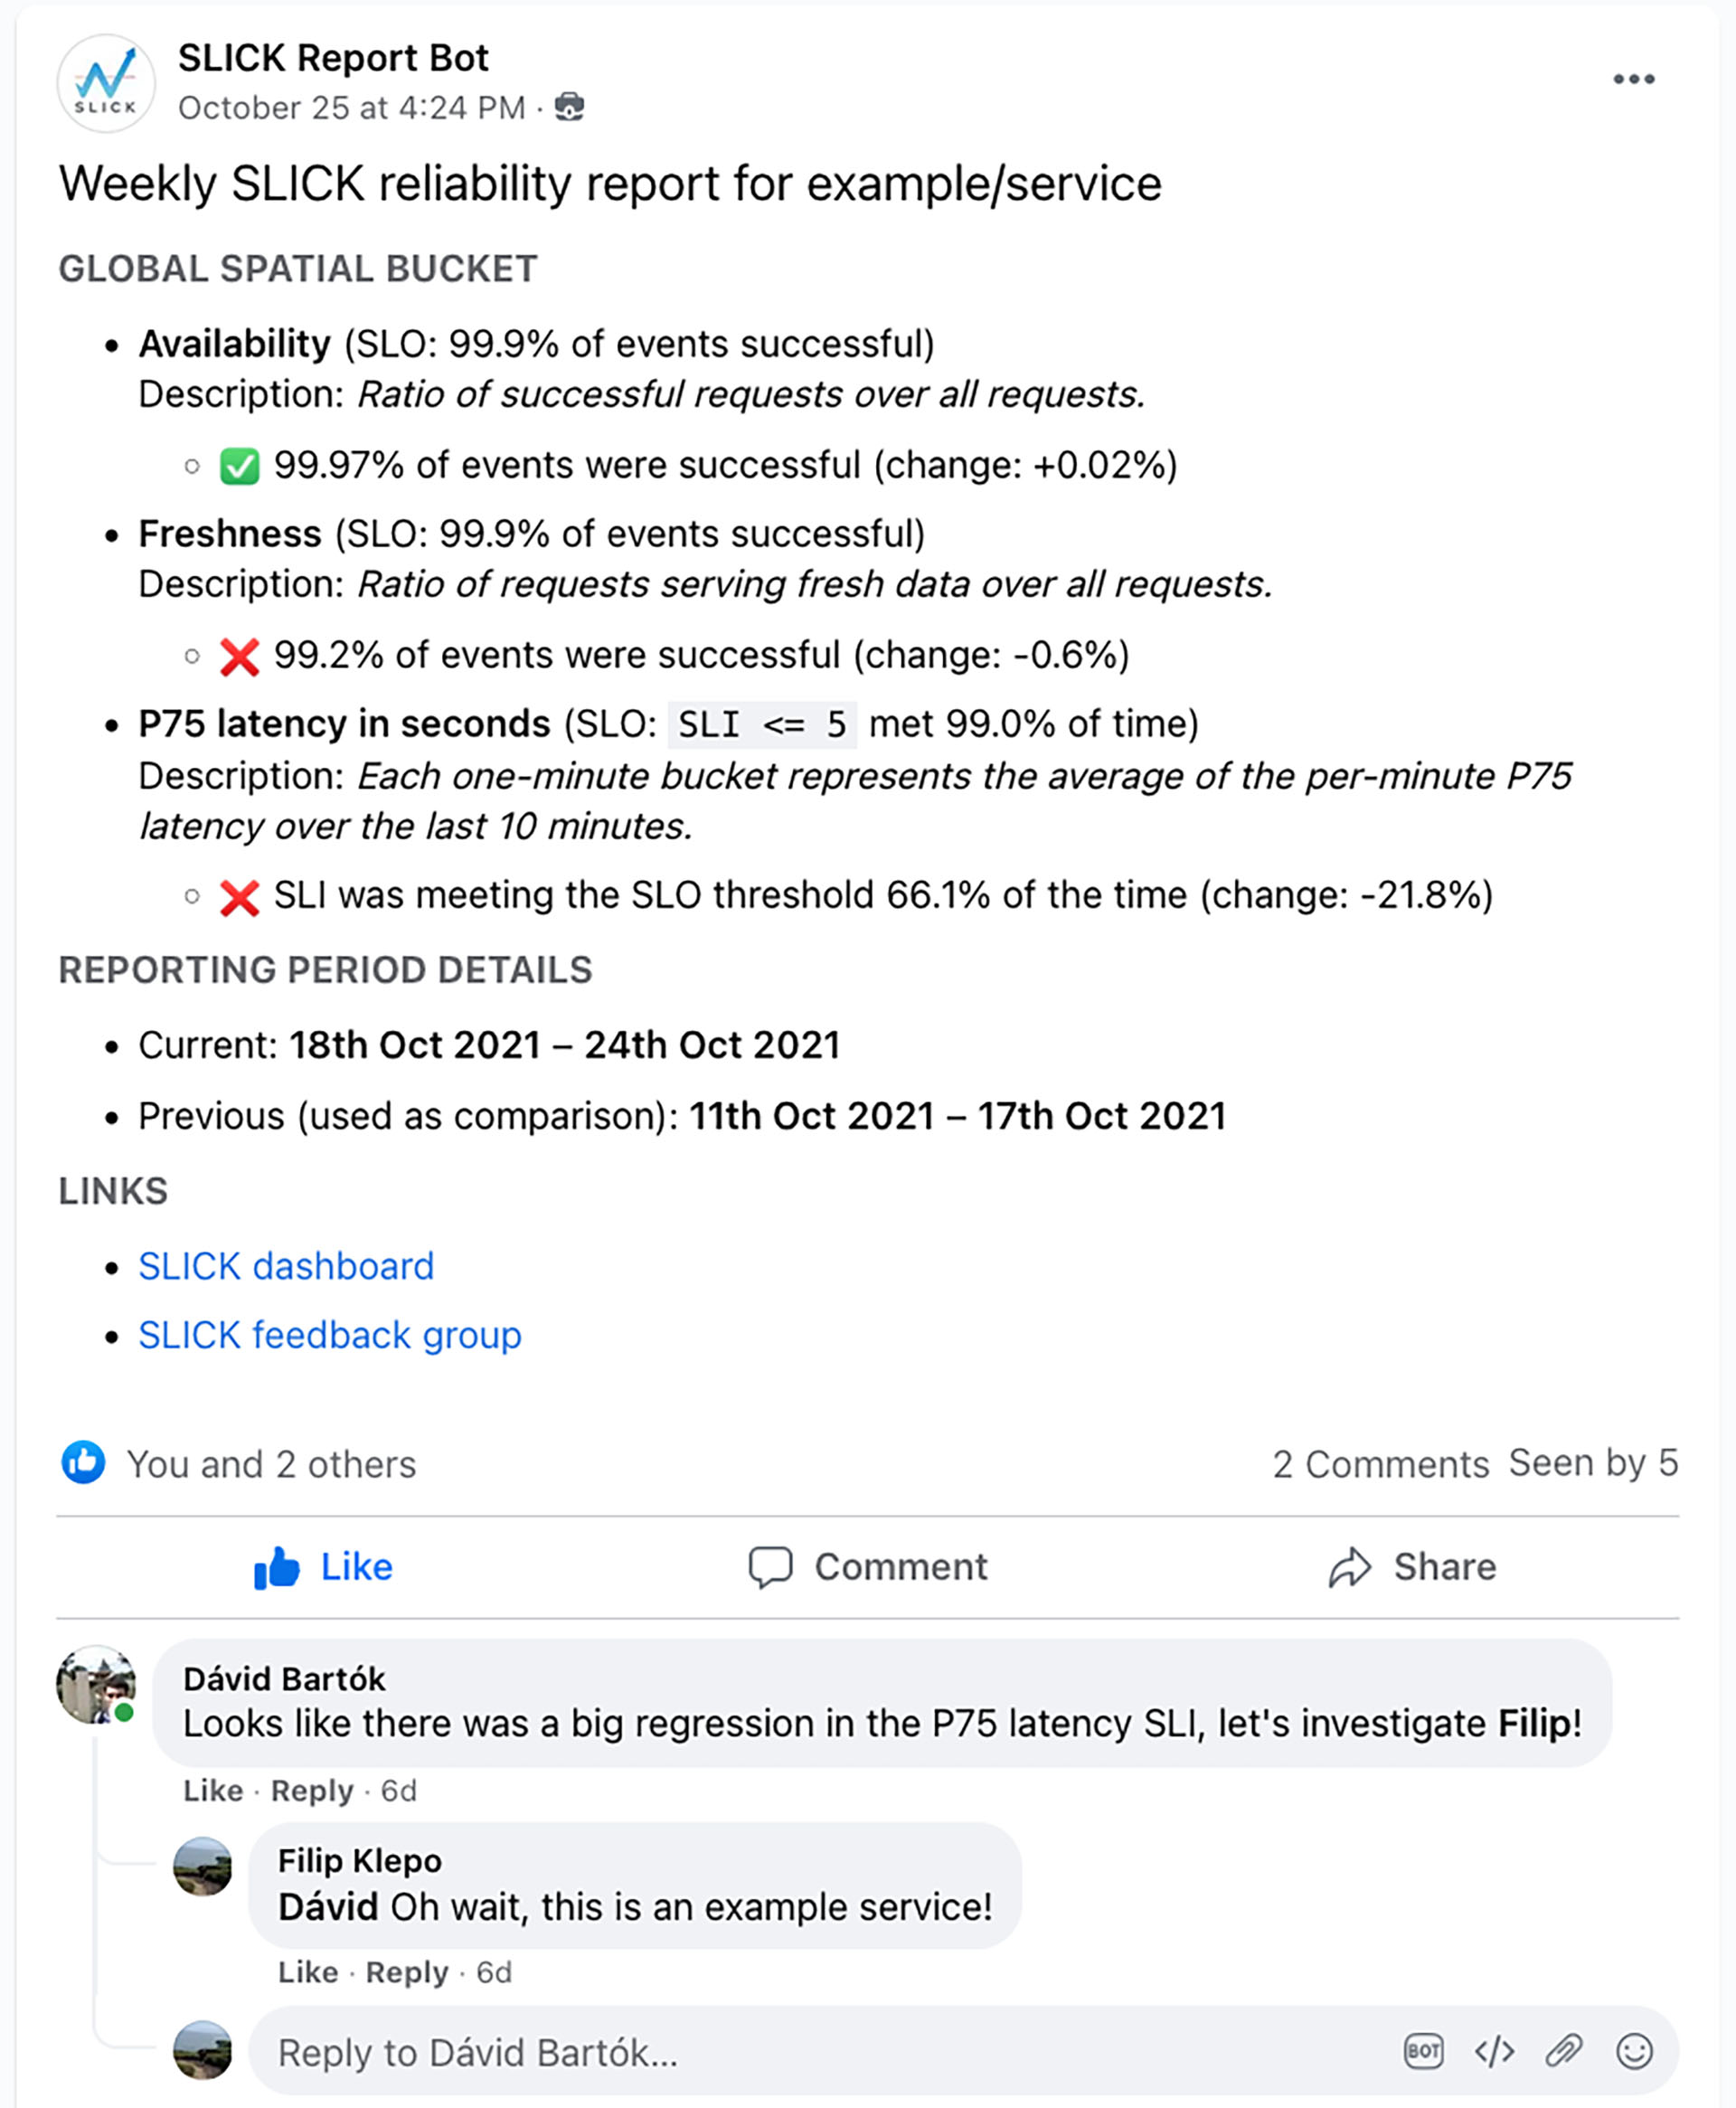
Engineers can receive automatic summaries of SLO performance, posted to internal groups on a schedule. These reports help owners monitor regressions and run retrospectives—and the comments on these posts often become a forum for reliability discussion.
CLI
A command-line interface supports operations like backfilling data, generating on-demand reports, and testing the effects of config changes before committing them.
Architecture overview
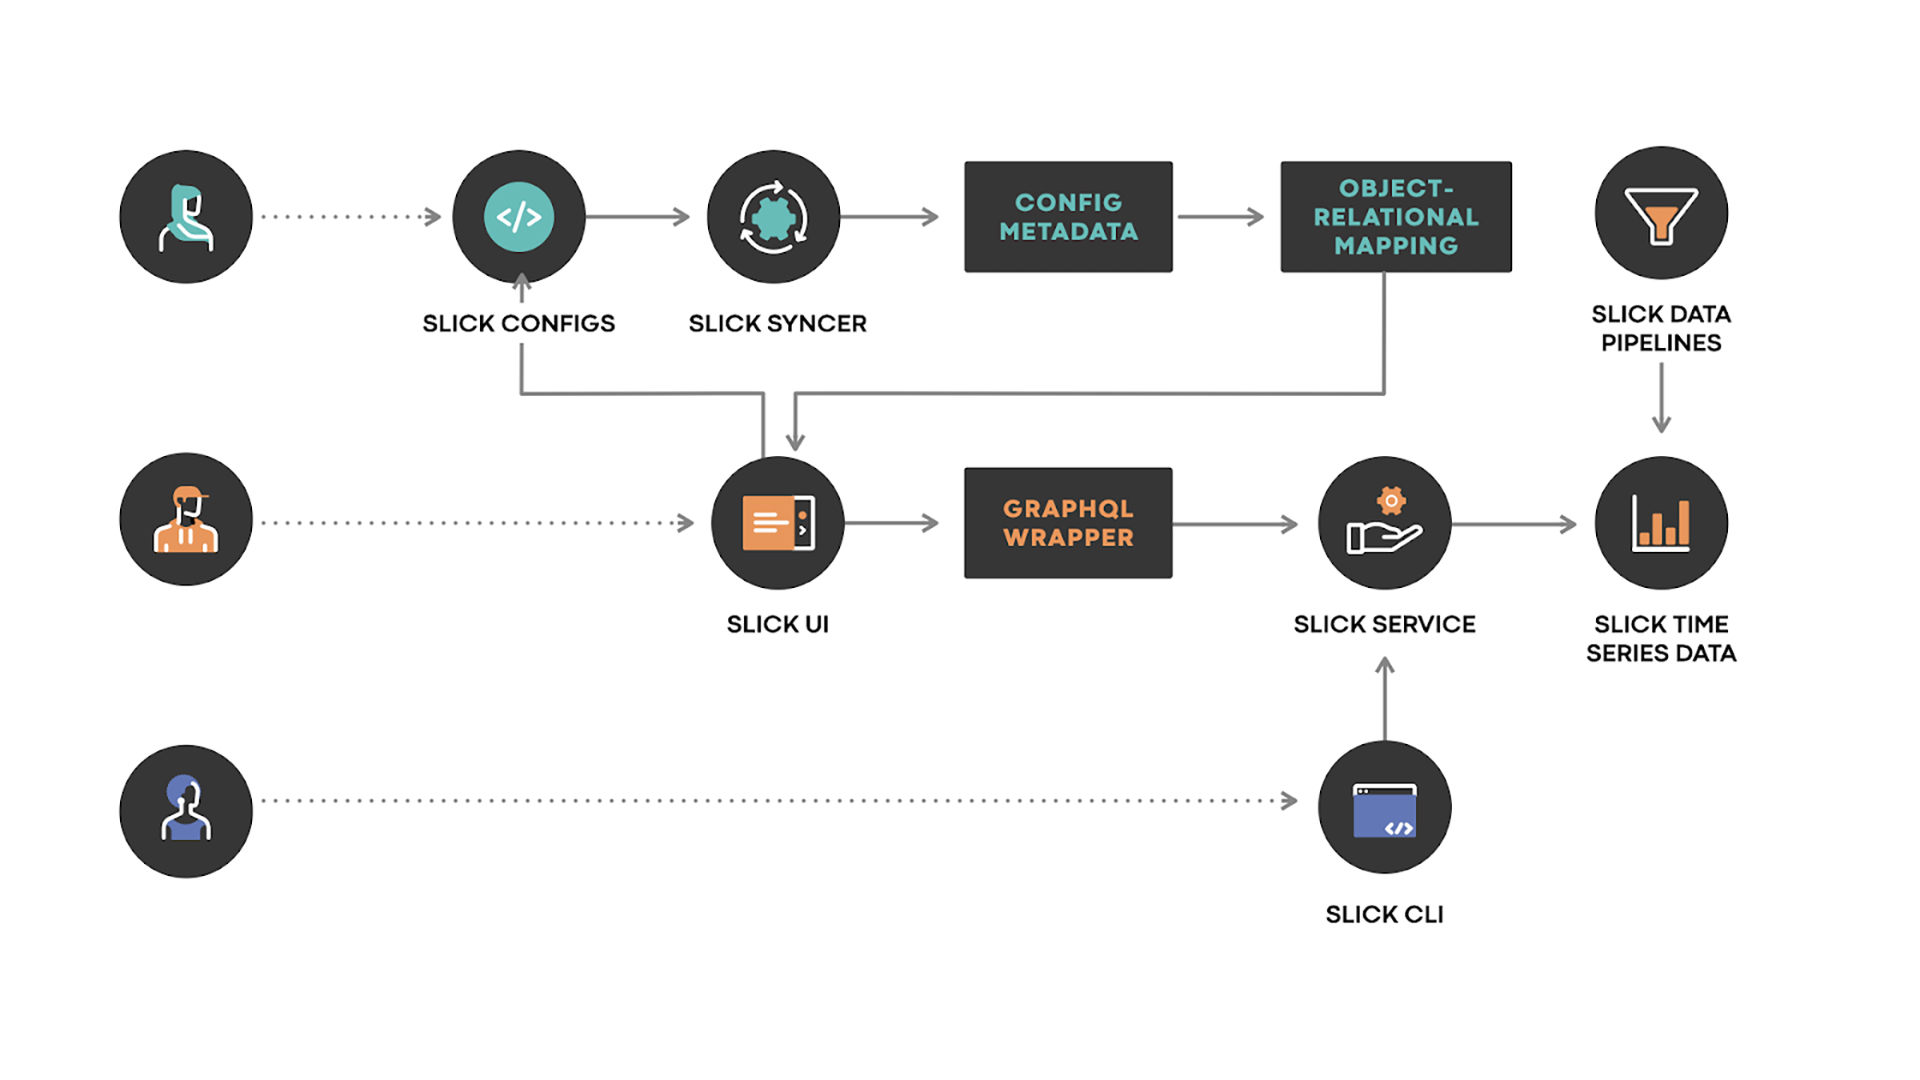
The core components of SLICK are:
- SLICK Configs: DSL files committed by users to the config store.
- SLICK Syncer: Keeps config metadata storage in sync with committed config changes.
- SLICK UI: Generated dashboards per service, plus the searchable service index.
- SLICK Service: An API server that answers queries such as how to compute an SLO for a specific visualization, abstracting away data placement and sharding details.
- SLICK Data Pipelines: Periodically capture SLI data for long-term storage.
Data ingestion
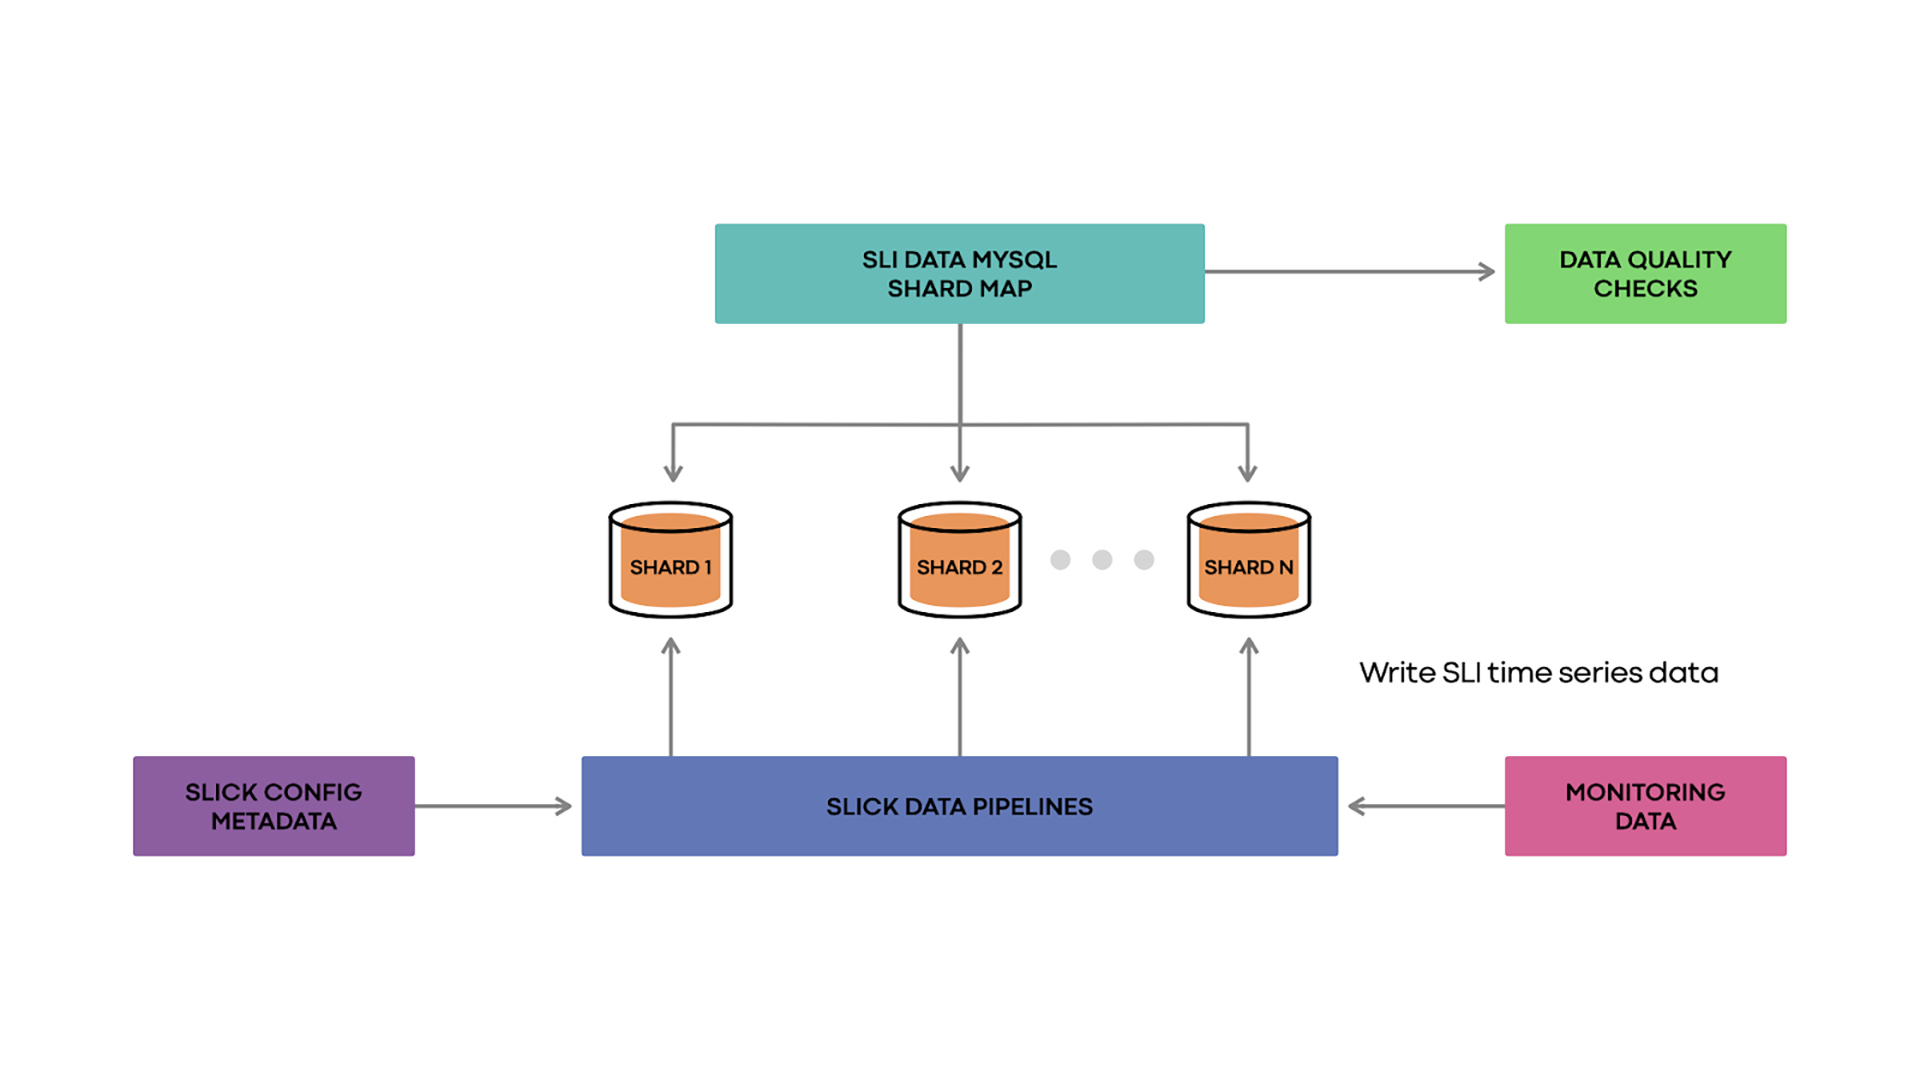
Every hour, SLICK's data pipelines consult config metadata to find all SLI queries. They run those queries against monitoring datasets to obtain raw time series at one-minute granularity. The pipelines then use the SLICK shard map to determine storage location and bulk-insert data into the appropriate shards.
Data quality checks validate pipeline behavior: deterministic testing time series are processed alongside real SLIs, and the resulting database rows are compared with expected values to quickly catch correctness bugs.
Adoption and real-world results
SLICK launched in 2019 and gained company-wide adoption by 2021, with more than 1,000 services onboarded. The following examples use mocked data to preserve confidentiality, but the shapes of the charts remain accurate.
LogDevice: catching a read availability regression
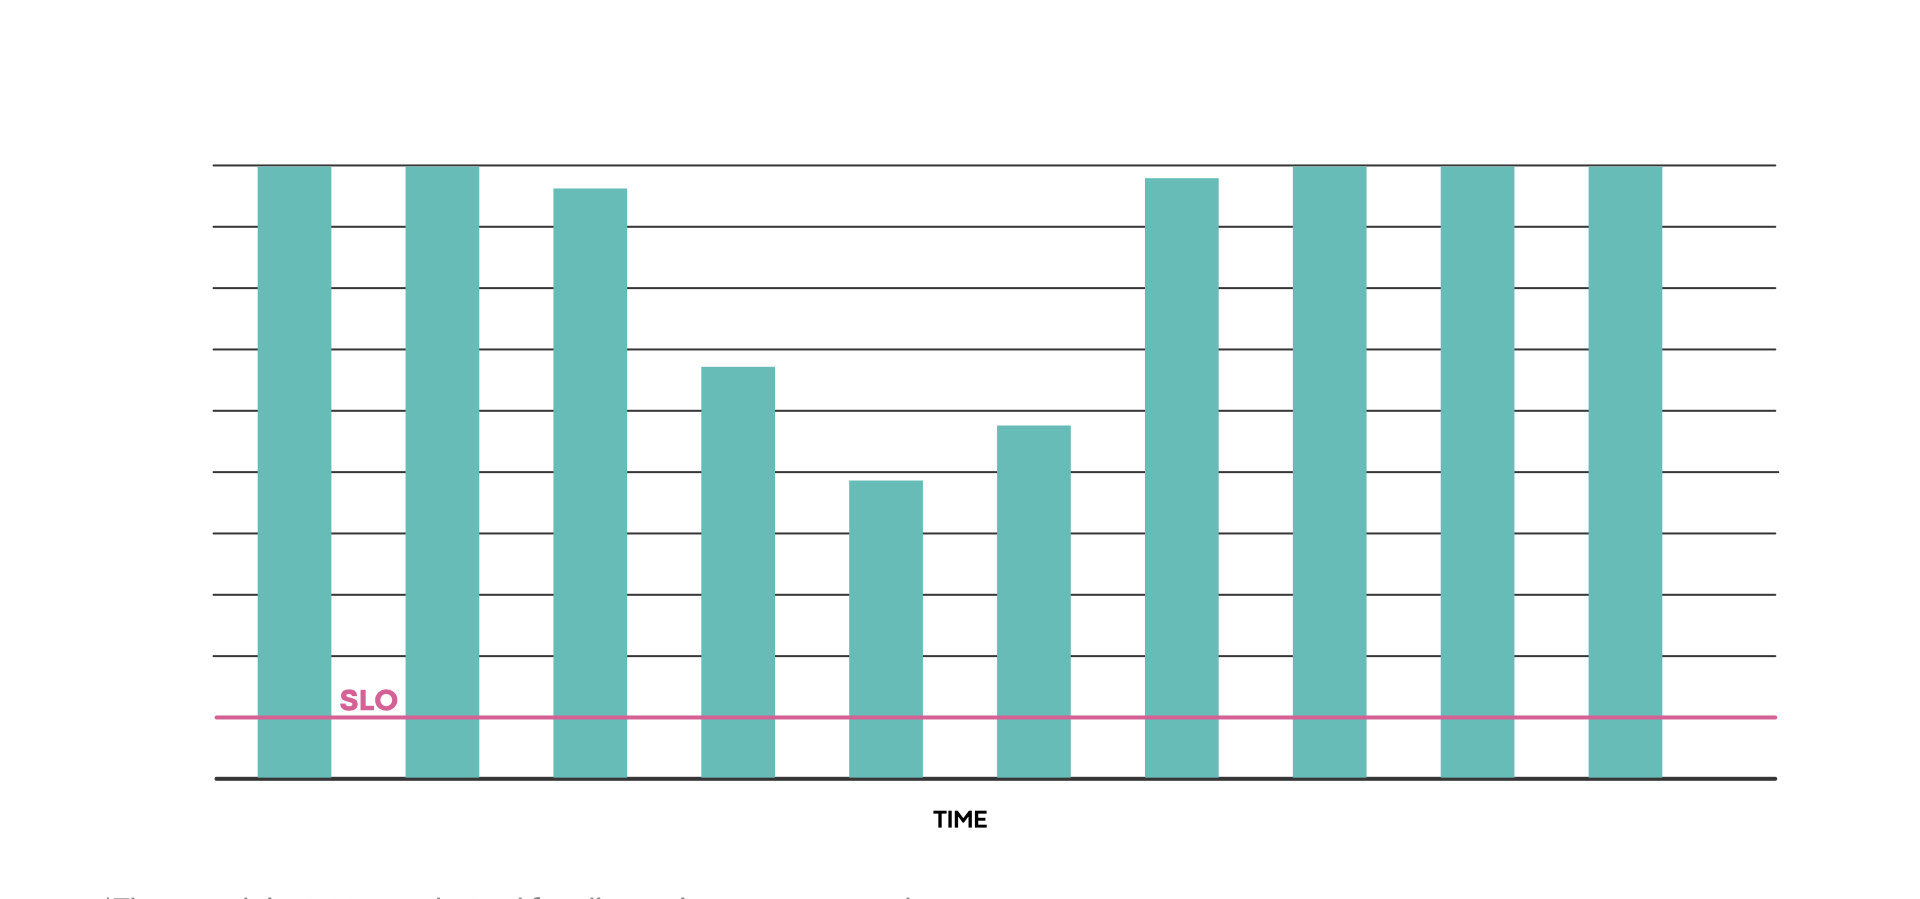
LogDevice, Meta's distributed log storage system, used SLICK to detect a regression in read availability. The team identified the root cause, fixed it, and confirmed via SLICK that service levels had been restored.
Backend ML service: from missed SLO to resolved outage
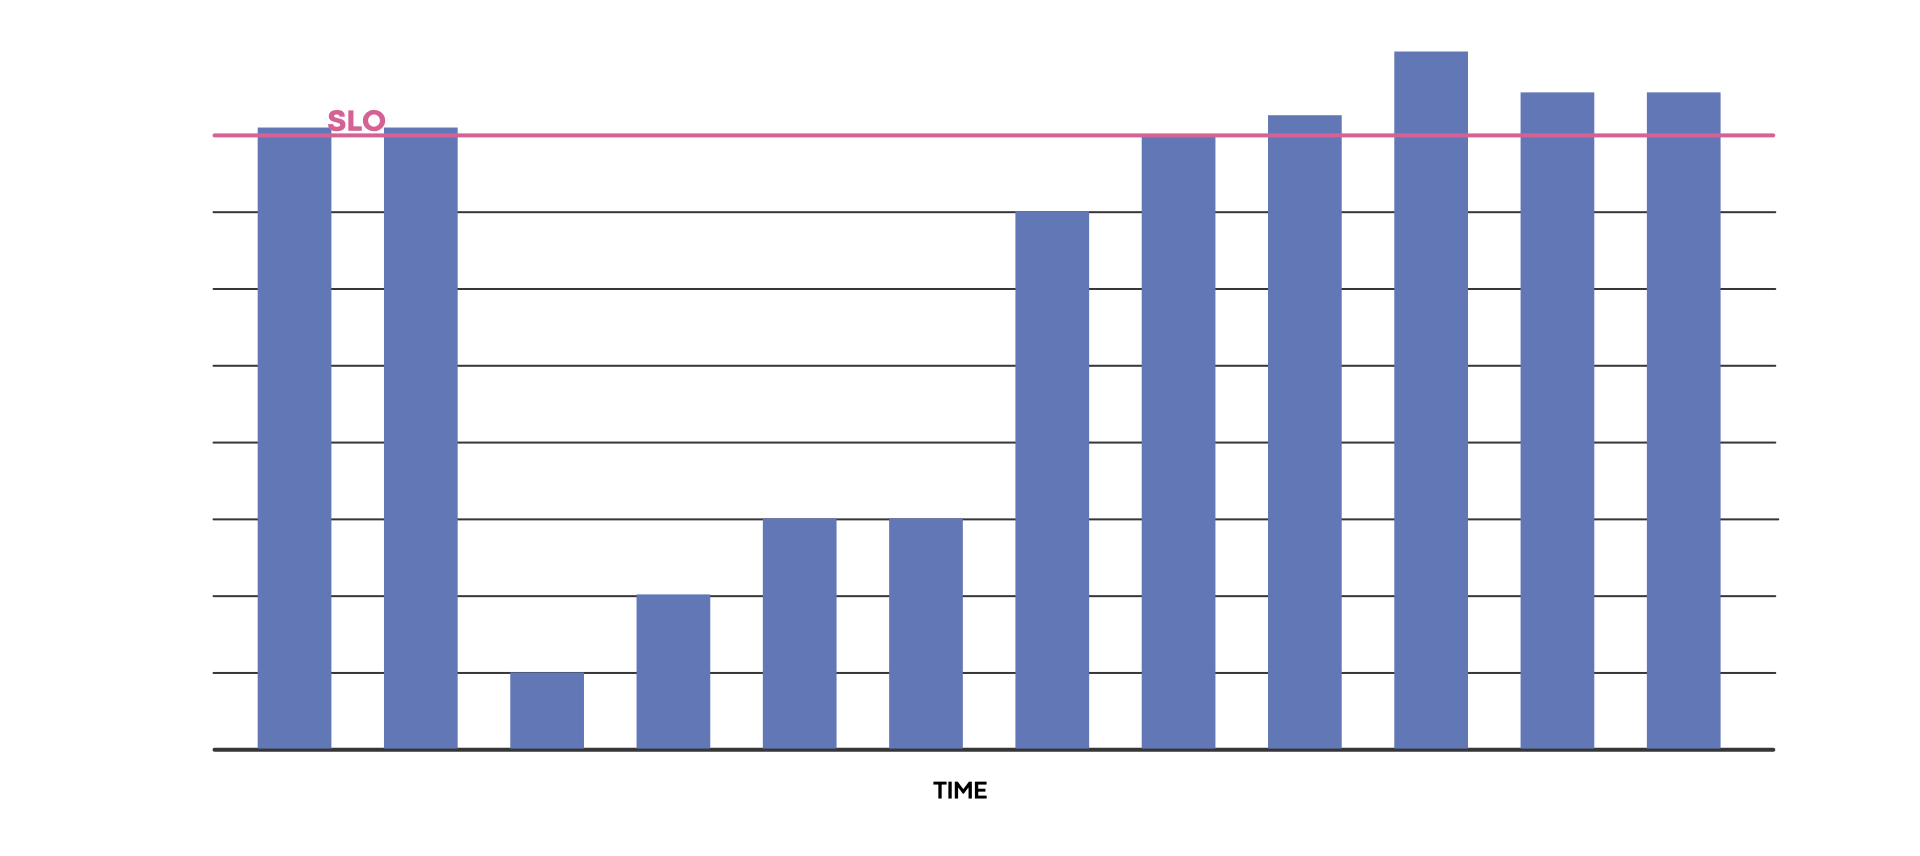
A critical backend ML system that serves end users across Meta's apps experienced a significant reliability regression in 2020. SLICK consistently showed the service missing its SLO, which triggered a reliability review. The team investigated and fixed the root cause, and the service returned to meeting its targets.
Lessons and next steps
Meta's experience with SLICK has reinforced several lessons:
- Long-term tracking is essential for spotting trends and planning reliability work over extended periods.
- SLOs need to be part of daily engineering conversations, not just strategic planning.
- Introducing SLOs strengthens overall service reliability.
Going forward, the SLICK team plans to focus on:
- Aligning services' SLOs with those of their dependencies, so teams can see how upstream systems impact their performance and where mismatched expectations might cause cascading failures.
- Providing actionable suggestions for improving reliability, drawing on past experience to guide service owners toward meeting their SLOs.
- Scaling SLICK to support more teams—which means meeting Meta's own SLOs for reliability and scalability.


