A Cleaner View of Deployment Activity
Since introducing Log Drains, teams have been able to forward invocation logs for Serverless Functions and Static Files to dedicated inspection tools like LogDNA or Datadog. That separation lets the platform concentrate on what it does best: providing immediate, plug-and-play realtime logs within the dashboard itself.
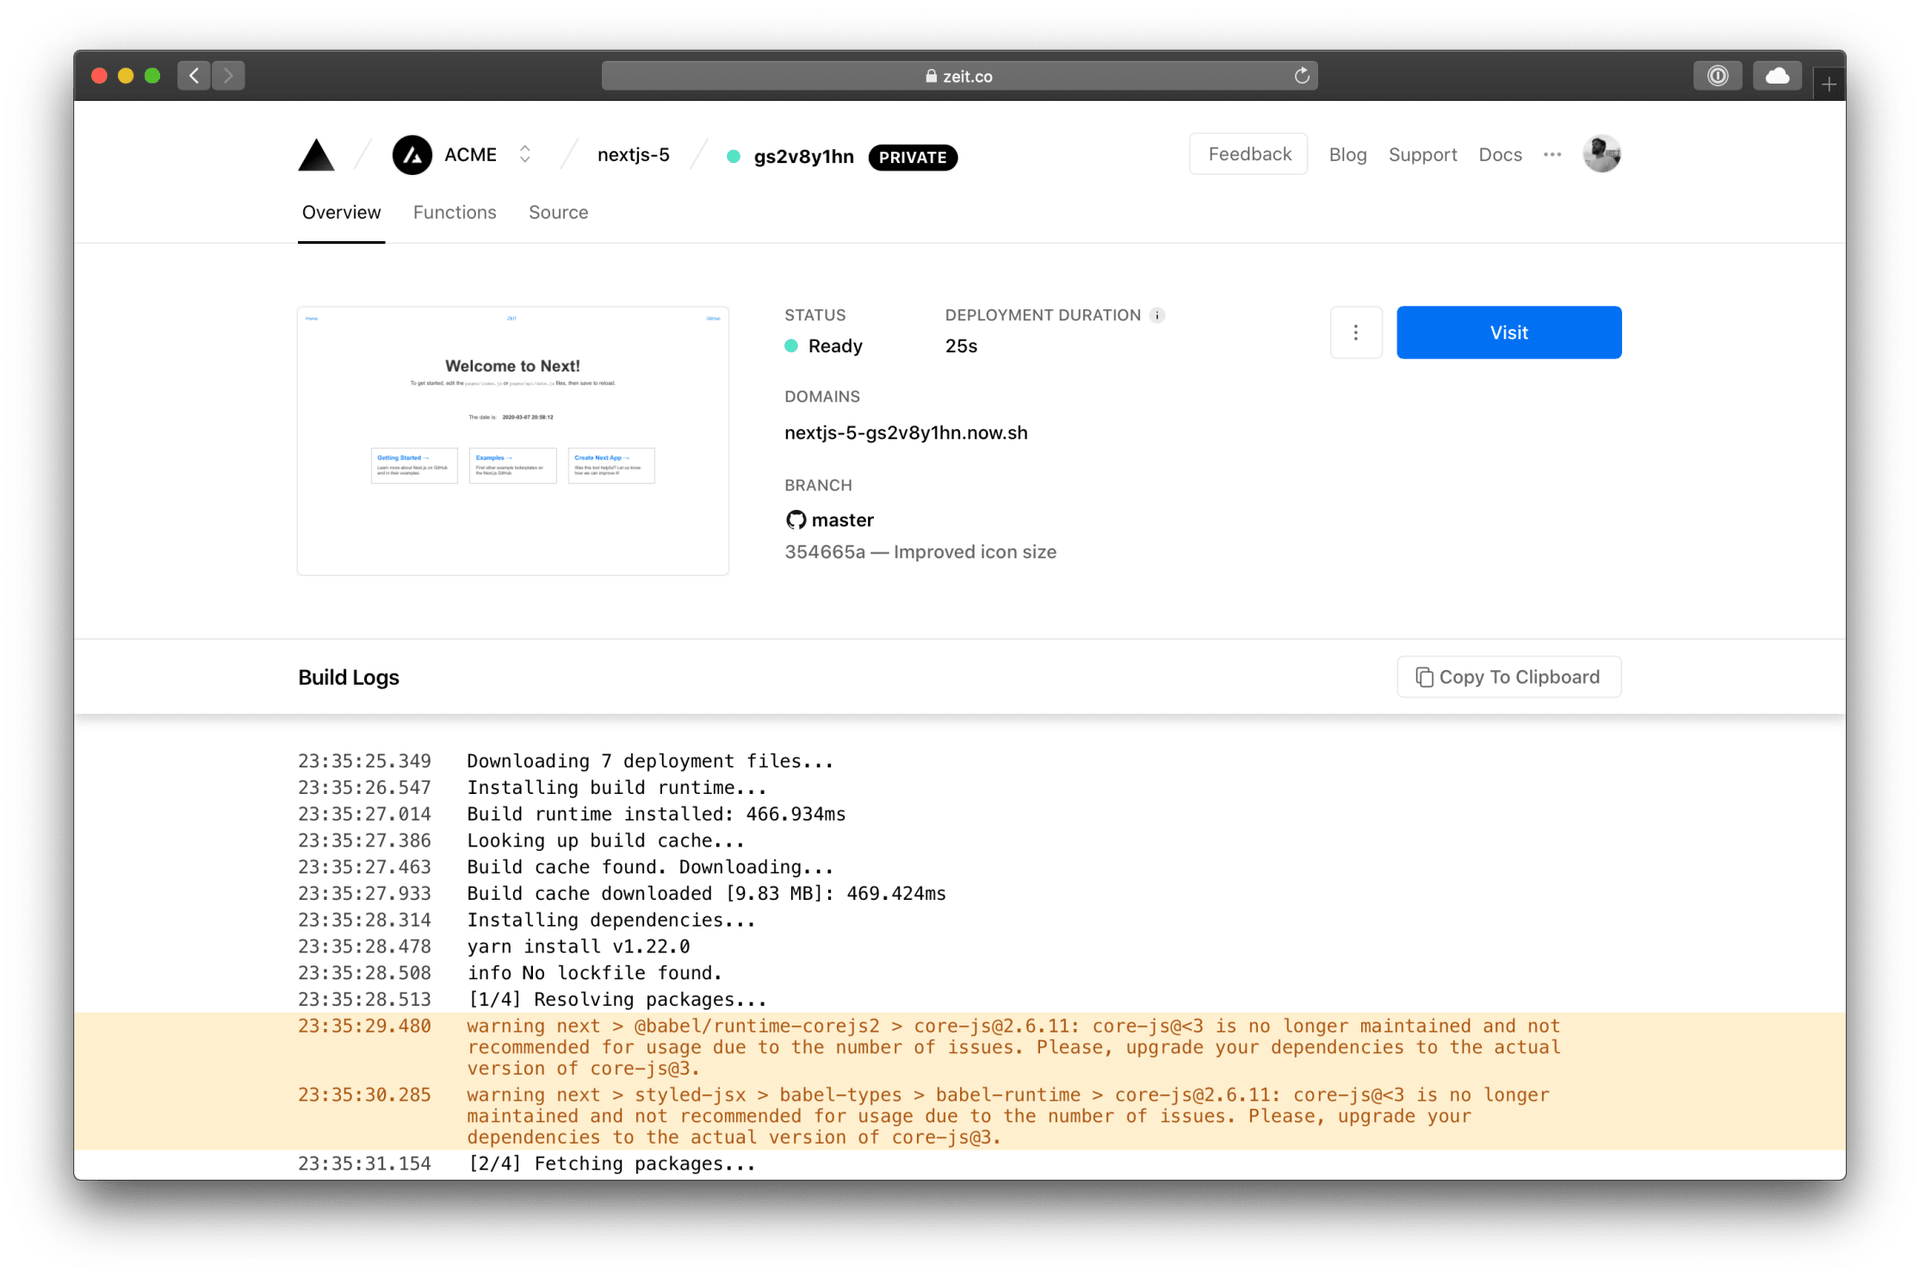
Redesigned Build Output
Every new Deployment already ships with detailed output showing how your source code is compiled and packaged. That build trace now gets a visual refresh, making it easier to scan through the stages of a deployment from start to finish.
Streamlined Function Monitoring
For deep-dive log analysis, the recommended path remains installing one of the Log Drain integrations. But when you only need a quick pulse check on traffic, the updated "Functions" tab presents realtime requests in a more readable format.

Error inspection receives the same treatment, putting the most critical production signals front and center without requiring a jump to an external service.

Summary
Together, the updated Build and Serverless Function logs give you a faster way to understand how a Deployment behaves both during construction and in live traffic. For scenarios that demand longer retention or advanced querying, the Log Drain integrations remain the go-to option.


