
Why Performance Regressions Slip Through
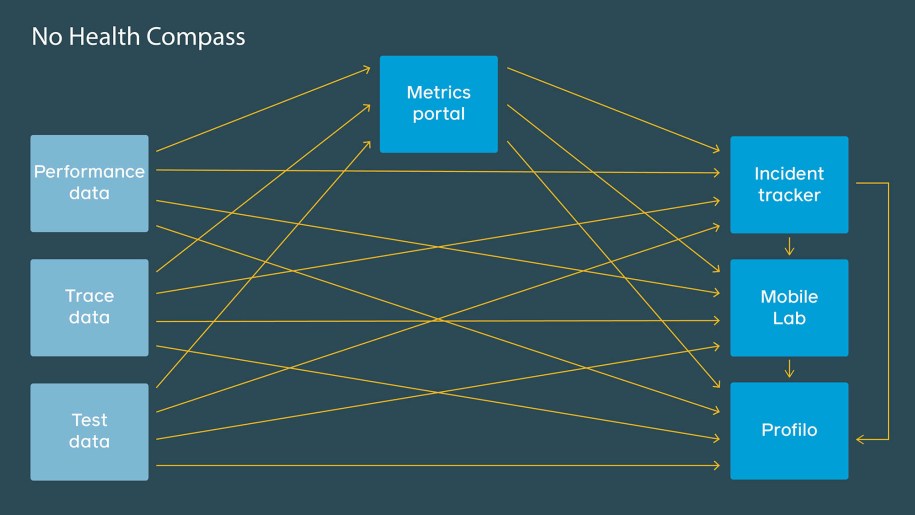
Facebook’s codebase changes constantly as engineers ship features and optimizations across its apps. Every change carries the potential to degrade performance for billions of users, so a suite of automated regression detection tools is applied at each stage of development. Historically, those tools were built independently for each stage, which meant multiple configurations, duplicated or conflicting settings, and a growing number of alerts as the ecosystem scaled to measure thousands of interactions. Engineers spent too much time navigating different UIs and chasing false positives.
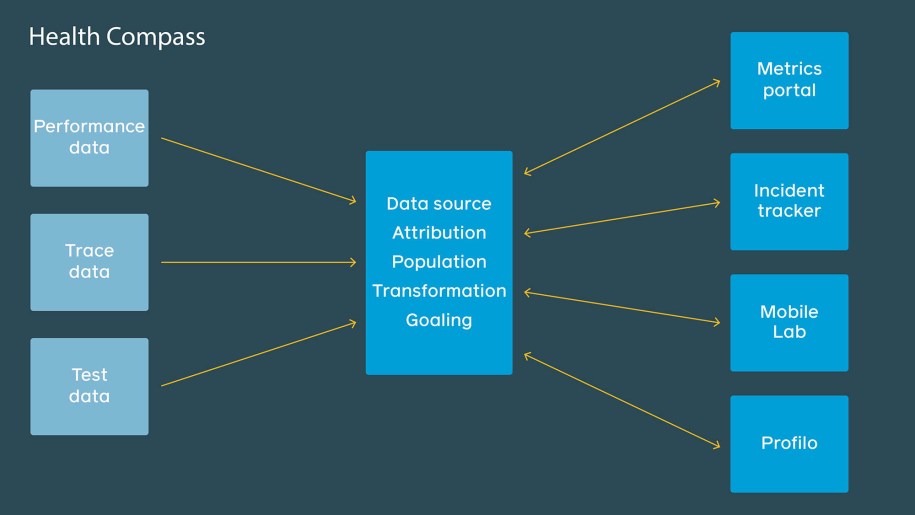
To fix this, we built two systems — Health Compass and Incident Tracker — that unify the performance tooling and consolidate alerts. The result has been a significant reduction in distracting notifications and a clearer path from detection to resolution.
Performance is best understood from production analytics at scale, but regressions that reach that point have already affected real users. The goal at earlier stages is to predict which changes are likely to regress performance, weighing trade-offs in computational cost, accuracy, and debuggability. Consider a code change that alters the complexity of a function:
BEFOREpublic static Post getBestPost(List<Post> posts) {
return posts[0];
}public static Post getBestPost(List<Post> posts) {
return posts.stream()
.max(Comparator.comparing(PostUtil::getPostRank))
.get();
}Different stages catch different things:
- Development: Static analysis (e.g., Infer) can flag that time complexity changed from O(1) to O(N) without running the code. For small lists, the practical impact may be negligible, so such notifications aren’t always useful.
- Continuous integration: MobileLab tests measure performance changes for the covered code. The results depend on how representative the test inputs are — it’s resource-intensive to simulate every real-world condition, so some regressions still slip through.
- Beta: Pushing changes to beta users gives early signals, but that population isn’t a random sample of Facebook users, which can bias analytics.
- Experimentation: A/B testing gates new code paths for a small percentage of users, but not all code can be easily gated, and statistical methods carry false positive and negative risk.
- Production: Instrumentation like Profilo measures the exact impact of a change, but by then, the fix may have to wait until the next release unless it can be mitigated via configuration.
At each stage, tools catch some regressions and miss others, producing noise in the process. We view the pipeline as a funnel where fewer regressions slip through at each step:

The development life cycle as a funnel: some regressions are caught at each stage, and fewer slip through to the next.
Health Compass: A Single Source of Truth for Performance Scenarios
Instead of configuring each tool individually, Health Compass gives engineers one place to describe their performance scenarios. Every tool then shows the same metrics, metadata, and pivots. A small change — like excluding a corrupted data range or subpopulation — is made once and applies everywhere, preventing our tools from disagreeing on metric values.
Performance scenarios are defined as domain-specific Thrift structures in our central configuration management system:
PerformanceScenario(
    name="Facebook for Android Cold Start",
    app=Applications.FACEBOOK_FOR_ANDROID,
    owner=Employees.JEFFREY_DUNN,
    # Connects scenario definition with in-app analytics logging
    data_source=ApplicationAnalytics(module="INIT", event="COLD_START"),
    unit=Units.MILLISECONDS,
    # We track latency of our scenarios over time and help engineers
    # measure their progress toward concrete speed goals for different
    # classes of devices. This definition allows us to show the same
    # thresholds on all charts and provide a baseline for use in
    # regression detection and alerting.
    goals=[
        Goal(
            population=Populations.PIXEL4_USERS,
            aggregation=Aggregations.AVG,
            value=2000,
        ),
        ...
    ],
    # [Continuous Integration] We can connect MobileLab tests with
    # our scenario to monitor commits and provide root cause
    # analysis via bisecting.
    tests=[
        MobileLabTest("android.fb4a.coldstart.3g_network"),
        ...
    ],
    # [Experimentation] We can enable automatic analysis to flag for
    # any impact on your performance metric from ongoing experiments.
    experiment_dimensions=[...],
    # [Beta][Production] Different types of detectors can be configured
    # for a metric so that related signals from all kinds of data
    # sources can be mapped back to the same scenario
    detectors=[
       DetectionConfig(release_channel="beta", ...),
       DetectionConfig(release_channel="prod", ...),
       ...
    ]
    # [Production] Engineers can configure a number of profiler
    # samples to record further analysis. This setting is pushed to
    # devices in near real-time.
    profiler_sample_rate=...,
)
Sample definition for the cold start scenario of the Facebook for Android app, including cross-tool configuration and metadata.
This flexible configuration enables entire products and teams to standardize regression measurement and management across changes. Scenario definitions also create a shared language for describing what regressed — every tool can annotate detected regressions with common metadata, which in turn powers Incident Tracker’s consolidated task view.
Incident Tracker: Consolidating Detection and Notification
When code reaches beta or production, Incident Tracker runs time series regression detection on all analytics for every Health Compass scenario. Its structured understanding of scenarios lets it deduplicate issues across device models and environments. It presents engineers with a single view of a regression, summarizing relevant data across the development life cycle to aid investigation.
Incident Tracker uses two time series analysis methods:
- Week-over-week: Compares the latest metrics against the prior week. This handles metrics that vary by day of week due to user patterns.
- Release-over-release: For mobile app releases, early upgraders are a biased sample skewed toward high-end devices on faster connections. This method creates a separate time series per released version, aligned by time since release. Since the bias is relatively stable, the alignment accounts for the distribution shift and gives a more accurate comparison for a newly released app.
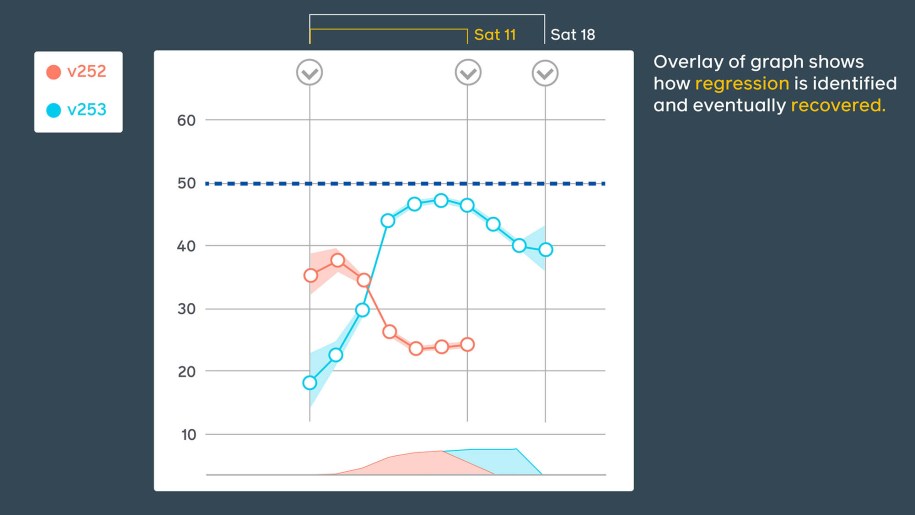
Some tools use overlapping release views to emphasize the timing and scale of regressions.
With many subpopulations to monitor — device type, connection speed, country, and more — plus multiple distribution measures (averages, percentiles), the number of alert combinations is huge. To manage this, we apply standard statistical methods to generate confidence intervals for observed changes. That lets us reason about whether a change is real or just expected variability. Incident Tracker discards regressions based on confidence, tolerance for false positives or negatives, and the magnitude of change, so engineers focus on real, important issues.
Detected regressions from our time series analysis and regression tools are summarized into a single task per issue. Annotations — containing the performance scenario and app version — make this consolidation possible, building trust that reported issues are meaningful. All relevant information is in one place, ending the need to hop between multiple tools to diagnose a problem.
Incident Tracker also pulls near real-time data from different tools to keep metric owners and teams updated on urgent changes, like shifting confidence levels or post-detection data. These task updates help engineers prioritize and act quickly. When a regression is identified, Incident Tracker can automatically kick off actions such as collecting detailed traces — so by the time the engineer opens the task, the data is already there, ready for analysis.
Pushing detection earlier in the development cycle
Health Compass and Incident Tracker already catch hundreds of performance regressions before releases reach production, and the tools handle issues that would otherwise impact billions of users across Meta’s app family. The next frontier is detecting problems at the earliest possible point in the funnel — ideally while an engineer is still writing code.
Attribution is much simpler in the IDE, since a regression can be tied directly to the change that caused it, making the signal highly actionable. But generating accurate results efficiently and quickly at that stage presents major obstacles. Current research is exploring ways to leverage production data to highlight specific lines of code that may have contributed to performance decay, with the goal of surfacing inline suggestions for fixes.
There is also work toward adapting MobileLab’s testing methodology to run automatically in the background during development, delivering results back to the IDE within minutes. Several challenges stand in the way, including:
- Slow build times when optimizations are enabled
- Gathering detailed coverage data
- Applying machine learning to choose the most relevant tests to run
- Redesigning the testing sequence to minimize latency
Role-based interfaces for broader adoption
Performance tooling is dense with jargon and custom workflows, and the learning curve can be steep — especially for engineers unfamiliar with the systems. Health Compass and Incident Tracker are no exception. As the number of Meta family apps and interactions grows, regression management needs to scale beyond a small group of specialists.
To address this, the team is building more intuitive, dedicated UIs tailored to different types of users. Providing different generalized views for specific roles — a performance analyst sees something different from a product engineer, for example — is intended to lower the barrier to entry and make it easier for more engineers to use the tools effectively.


