Why accelerators need their own observability
Application-specific integrated circuits (ASICs) are taking on a growing share of Facebook's data center workloads, from AI inference to video encoding. The first-generation accelerator systems deliver 10-30x better performance on large AI models and 3-10x better performance-per-watt than CPUs. Video accelerators, which help process the nearly 250 million videos uploaded daily, achieve a 10x performance-per-watt improvement on 4K content.
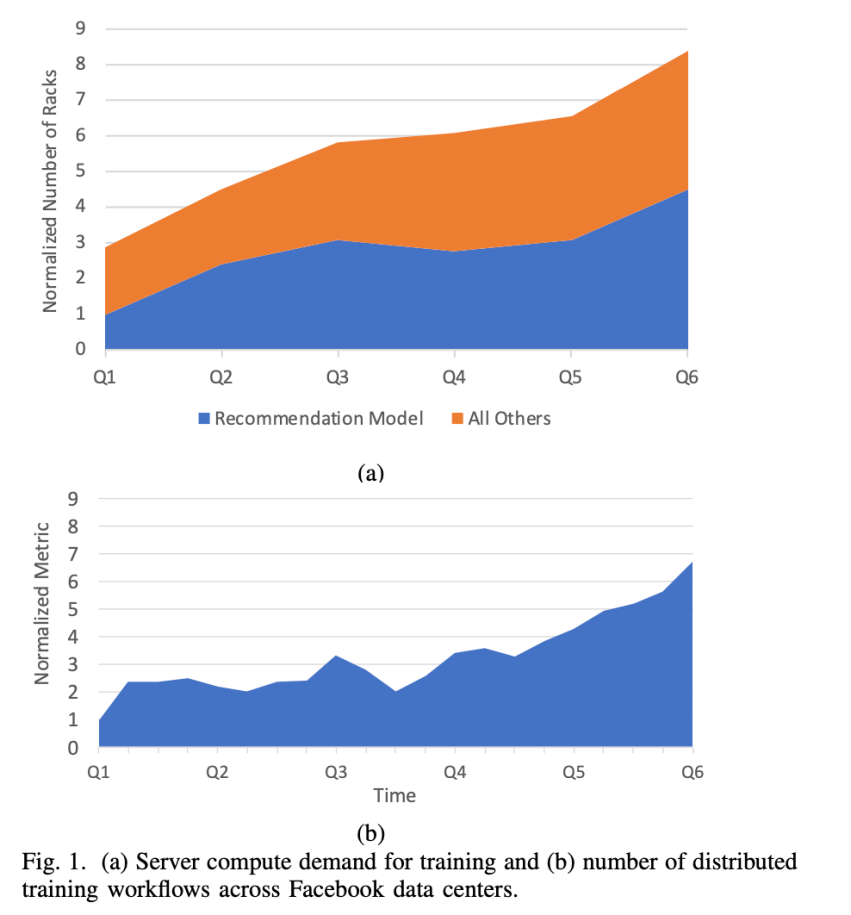
The main driver of the shift toward specialized hardware is the compute curve. AI model complexity has been growing roughly 10x per year, far outpacing CPU performance gains. The infrastructure now handles about 150 trillion AI predictions per day, according to the source article.
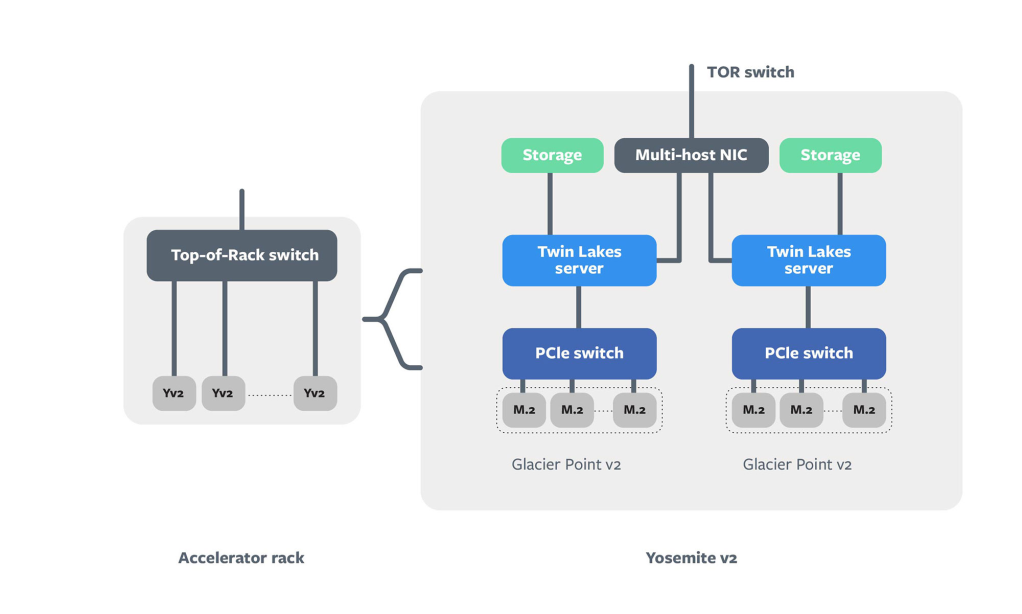
This trend creates an operational problem: in a standard cloud server, the CPU is the most complex component to observe and manage. When accelerators are added to the mix — typically arranged as M.2 modules connected via a PCIe switch to several CPU sockets — the system now has multiple complex hardware and software domains that all require monitoring and tracing.
Operating the accelerator zoo
Rather than a single, uniform platform, Facebook's data centers run multiple types of accelerators simultaneously. The first-generation ASICs deployed in 2020 are already being followed by two or three new second-generation accelerators. Each comes with its own driver interfaces and quirks.
Duplicating observability tooling for each new accelerator is not sustainable. Instead, the company built a trio of tools: Asicmon, a scalable observability framework; Asimov, a specification language for rapid development of monitoring logic; and Atrace, a remote tracing solution for production servers. Asicmon alone supports load balancing, performance monitoring, and automated health checks across hundreds of thousands of accelerators.
Observability for these systems serves three distinct purposes:
- Health monitoring: Track metrics that reveal overheating, faulty conditions, or functional bugs. Automated systems can reboot an accelerator or move it to a repair state based on these signals.
- Performance monitoring: Use system load data to scale AI jobs against variable daily demand and detect regressions caused by software deployments.
- Performance profiling: When jobs time out or perform poorly, engineers need visibility deep inside accelerator operation, and developers need tools to understand how their applications behave on the hardware.
Designing Asicmon
Asicmon is built on three core objectives: abstraction, development velocity, and performance. Abstraction is what allows a metric like device_utilization — defined as a measure of how busy a device is — to be consumed by load balancers without knowing anything about the accelerator's internals:
device_utilization = max(compute_core_active_i) / total_time
The framework maintains an instance of a monitoring module per accelerator device. It periodically probes the driver and computes derived metrics into a local cache, and reads from that cache in response to queries. This design protects against overwhelming the accelerator with counter requests.
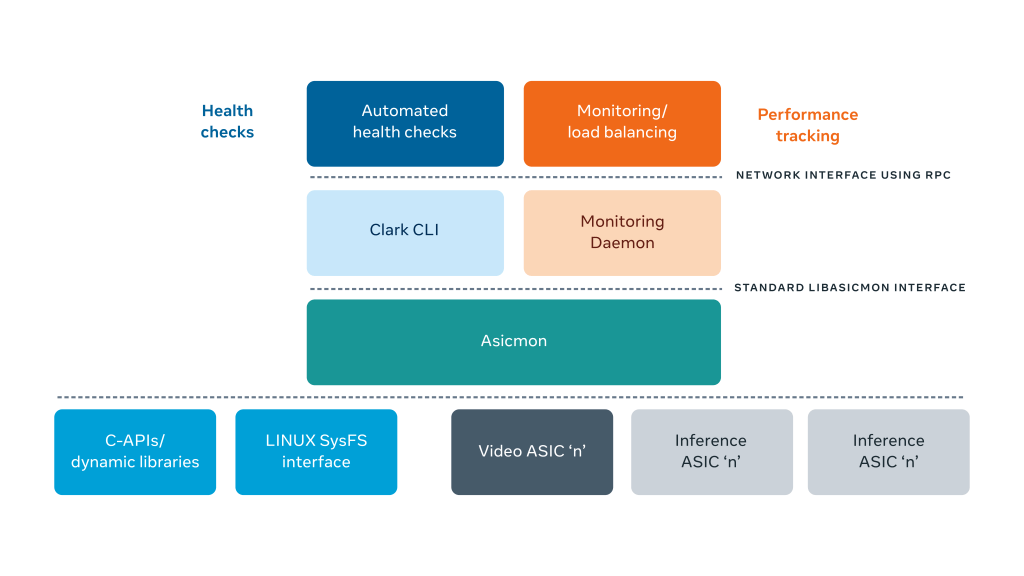
At the architectural level, Asicmon sits between individual accelerator drivers and the internal monitoring infrastructure. Upstream consumers include automated health-check tools that can detect faulty ASICs and remediate them, and a telemetry daemon that publishes performance metrics. Automated load-balancing systems such as Shard Manager consume the counters directly.
Asimov: from specification to C++
While Asicmon solves the problem of having a uniform interface above the accelerator driver, building the glue code between each driver and Asicmon individually remains a bottleneck. Accelerator development timelines overlap and are aggressive, so the company designed Asimov: a Python-like specification language for expressing how to probe accelerator interfaces and how to compute derived metrics.
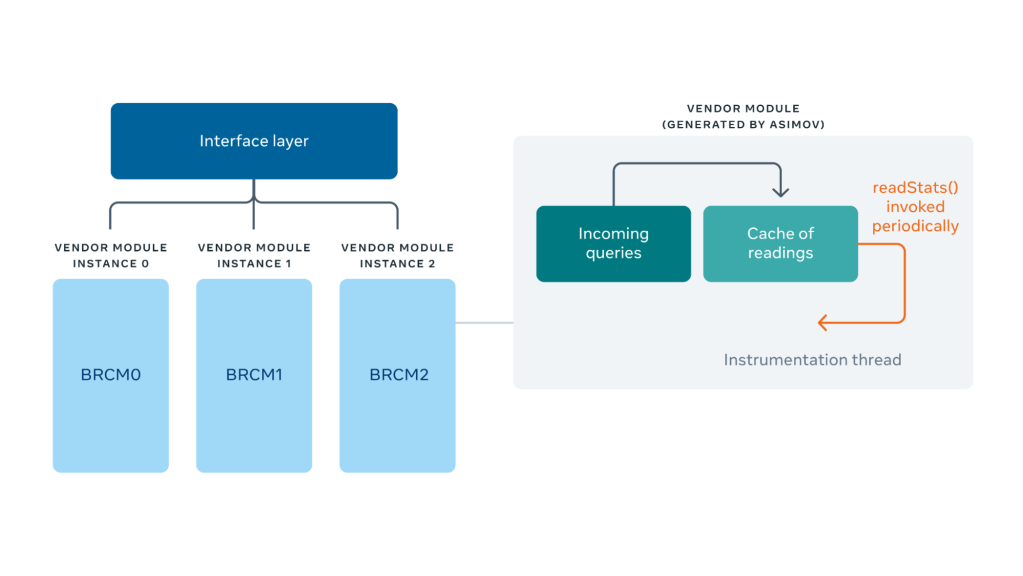
The Asimov compiler emits a C++ implementation of the monitoring module, automatically handling metric caching, periodic reading, and thread safety. Writers of Asimov code do not need to manage those concerns themselves.
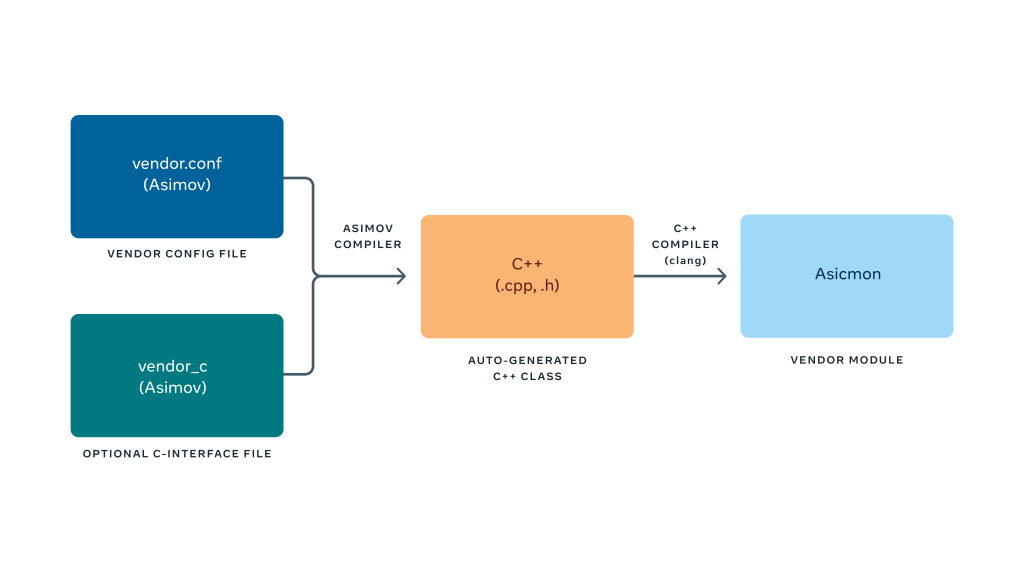
Asimov uses the same internal stats structure as Asicmon, so anything written in the language integrates directly into the framework. The language can read metrics from Linux sysfs files or invoke custom C-library functions provided by a device driver, and it supports equations and conditions for derived metrics just like any conventional programming language.
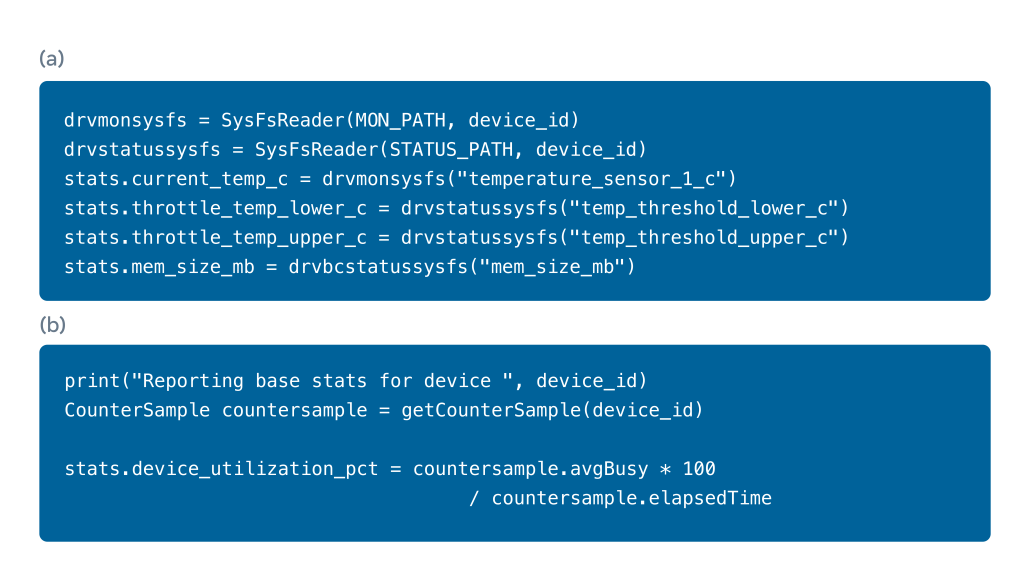
Under the hood, Asimov is implemented with the ANTLR compiler framework for lexer and parser logic; the actual C++ code generation is driven by templates. This lets the language be expressive while keeping the generated code efficient enough for production workloads.
Observing value in practice
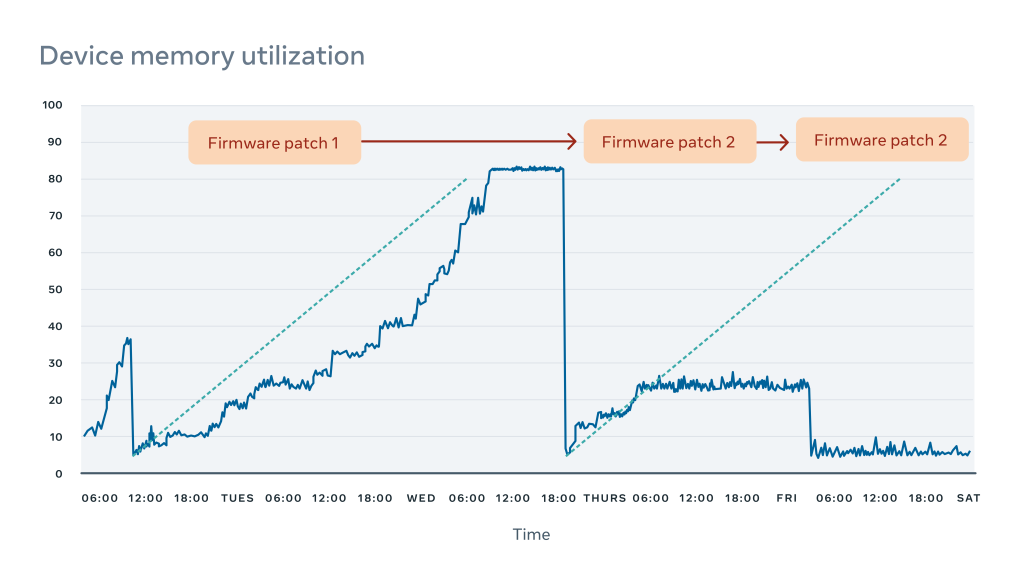
The source article describes a test deployment for video accelerators where monitoring surfaced a memory leak early in the development cycle. Using an Asicmon counter for available device memory, engineers caught the issue, applied multiple driver fixes, and had the problem resolved before the hardware reached production.
The fit with Shard Manager is another area where Asicmon's abstractions pay off. Shards are copies of an AI model that can serve inferences. Asicmon exposes the abstract accelerator utilization metric to Shard Manager, which then automatically scales shard counts to align with changes in traffic and performs rollouts of new model updates.

Asimov also has implications for pace of iteration. The first version took time to build alongside the first video accelerator. The second, which supported the AI inference accelerator, took significantly less time: basic metrics were ready in under a week. Overall, Facebook was able to expand AI accelerator metric coverage from roughly 30 percent to about 75 percent since Asicmon was implemented.
Tracing accelerator workloads
With Asicmon providing system-level observability, the next problem is understanding why performance metrics such as latency and throughput shift over time. On CPUs, that answer usually comes from a stack-based profiler that samples the running call stack. Accelerators, however, rely on specialized hardware units rather than general-purpose cores, so there is no function stack to sample. For inference accelerators, tracing is the appropriate profiling technique: a trace is a time series of events across different system parts, representing functions, operator execution, or data transfers. Traces expose latency and scheduling details and reveal how the CPU and accelerator interact.
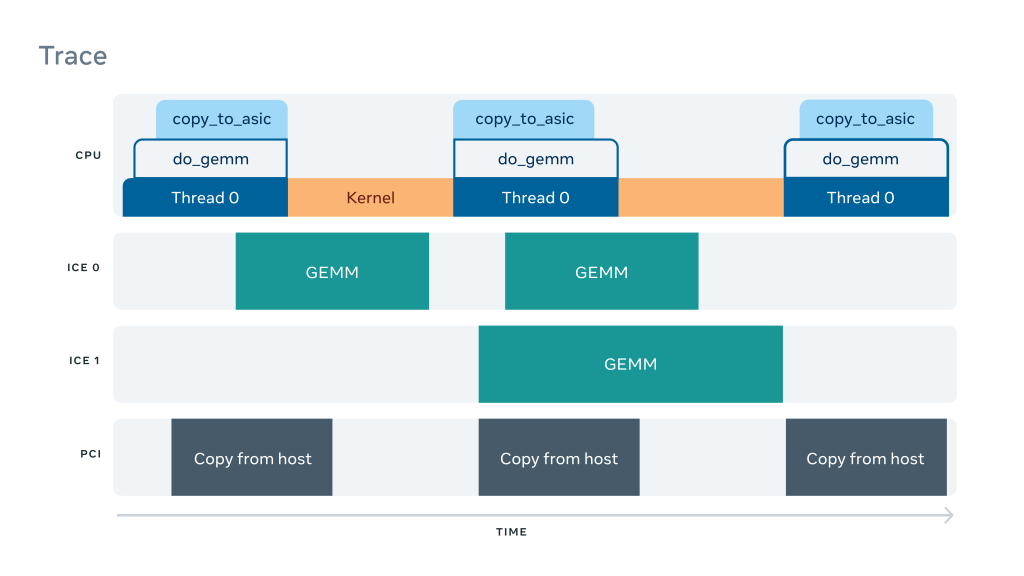
Vendor-supplied tracing tools and APIs exist, but they are built for single servers and are often difficult to use in production. We built Atrace to layer on top of those native capabilities, scaling out collection, processing, and analysis of traces. Two use cases shaped its design:
- Model development: Developers targeting new inference hardware can run the tracing tool locally, and integration with internal visualization and summarization produces faster feedback for iterative model tuning.
- Production: When a CI test flags a performance regression, engineers need to collect traces remotely and on the fly to diagnose the issue.
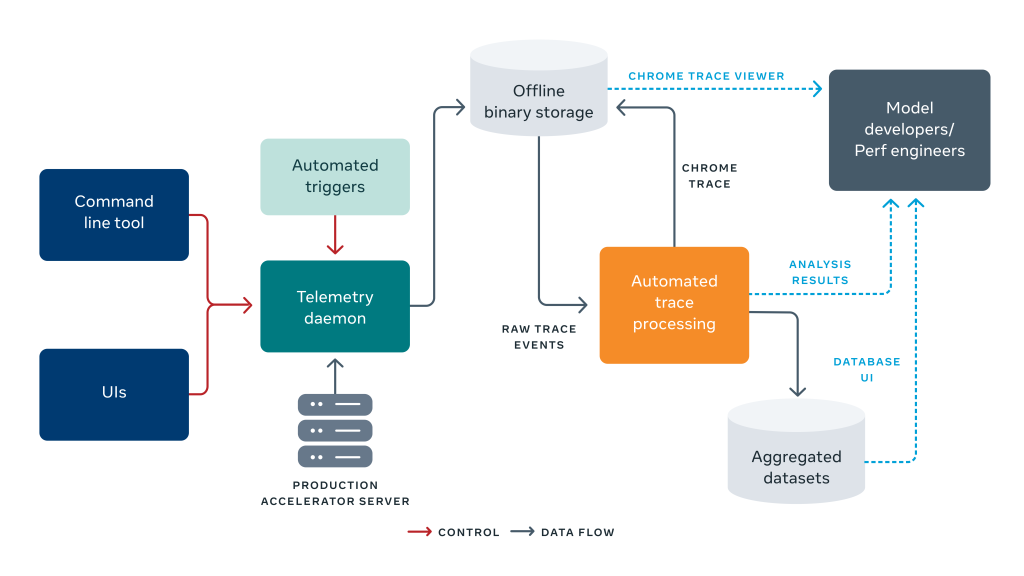
Atrace components remotely trigger and collect traces, storing each one in shared storage for post-processing and summarization. The collection flow runs from trace trigger on the left through collection and post-processing on the right.
Getting signal out of traces
Raw traces are large and hard to read directly. Summarizing them at a higher level is more useful. We built a trace summary that groups statistics by AI operator type, as shown below.
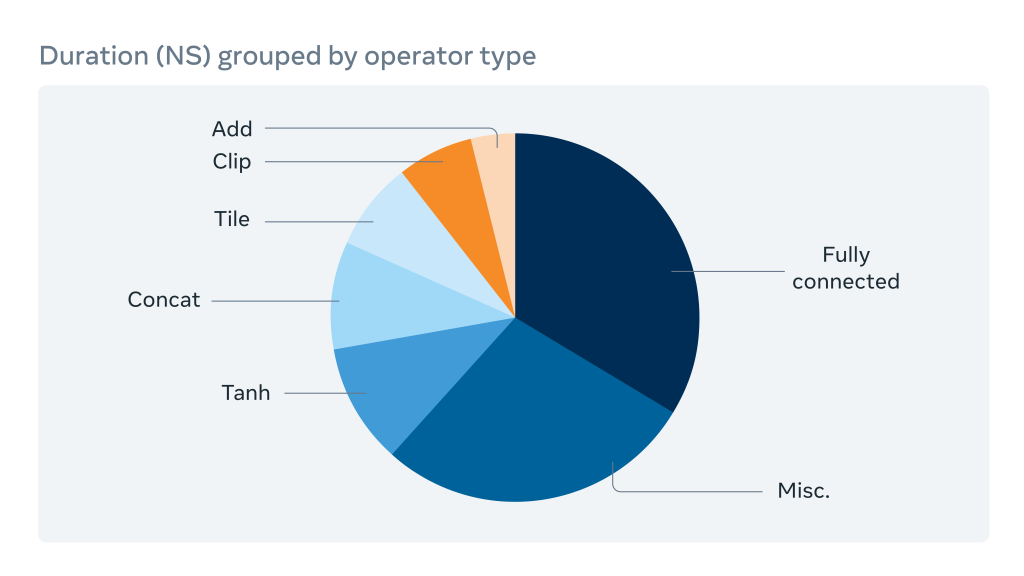
This operator breakdown shows engineers which operator types consume the most execution time and are worth optimizing. It also supports comparisons between software versions to diagnose performance regressions.
For advanced users, visualization is available through both the open-source Chrome trace viewer and an internal Facebook trace visualization tool, all from a single click. Automated analysis can also derive a critical path for operators by using the AI model's dependency graph combined with trace statistics. That analysis supports latency optimization and highlights issues such as operator imbalance; it helped close a 10 percent latency gap between Caffe2 and PyTorch versions of one AI model.
Inference requests traverse multiple software layers: the application, the PyTorch framework, and Glow, an open-source graph lowering compiler for accelerators. Complex models for video understanding or natural language processing may run partly on a CPU and partly on an accelerator, making cross-layer tracing and correlation necessary. We prototyped trace correlation in Glow and PyTorch so CPU operations in the Glow runtime can be connected to accelerator activity.
What's next
Beyond support for next-generation AI and video accelerators through Asimov and Asicmon, we are exploring several directions:
- Open specifications: Accelerator chip makers lack standardized monitoring interfaces. We are working with the Open Domain-Specific Accelerators (ODSA) project toward a common industry specification.
- Trace tooling: We are investigating automatic optimization recommendations from traces and better visualization integration, including with TensorBoard.
- Distributed tracing: Microservices that use accelerators don't run in isolation, so we want to correlate distributed traces from the Canopy tool with system-level accelerator traces, enabling end-to-end latency debugging.
The authors thank collaborators Jerry Liu, Thiara Ortiz, Jeremy Yang, Ashwin Poojary, Deng Pan, Craig Ross, Ashwin Narasimha, Gisle Dankel, Michael Anderson, Allan Di Wu, Yinghai Lu, Satish Nadathur, Garret Catron, and Jack Montgomery.


