
The debugging problem at ML scale
Meta’s products rely heavily on machine learning models for recommendations, content understanding, and content generation. Productionizing these models involves distinct phases, each with its own failure modes: data pipelines that assemble training information, training workflows that build and refine models, evaluation systems that test them, and inference systems that serve them in production. At any point, multiple model snapshots may be running as A/B experiments. Prediction quality can degrade from many sources—shifts in training data distributions, problems at inference time, model hyperparameters, or system configuration—and pinpointing the cause is disproportionately hard at Meta's scale.
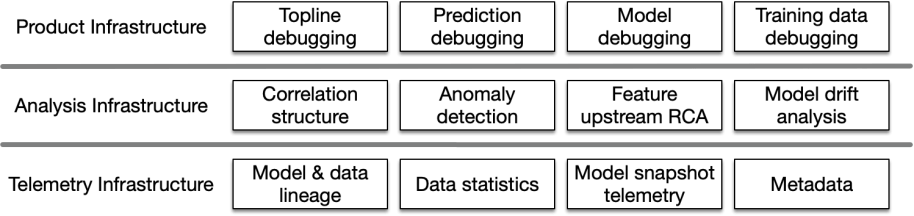
Engineers historically needed deep, specialized knowledge of the specific pipelines and telemetry involved, plus significant cross-team coordination, just to begin triaging a production issue. Root-cause work was done with shared notebooks and ad hoc code covering only small parts of the full debugging loop. To change that, Meta built the Prediction Robustness program, and under it, HawkEye: a toolkit for monitoring, observability, and debuggability of the end-to-end ML workflow.
A decision tree for triage
Rather than a collection of point tools, HawkEye is built around a decision tree that codifies the debugging process into a guided workflow. Each branch narrows the problem space: alert to top-line anomaly, top-line anomaly to suspect model snapshot, snapshot to feature or model issue, feature to upstream data pipeline problem. Continuous instrumentation and analysis layers underneath feed each step, so on-call engineers navigate the same path an expert would, without needing to know all the internal telemetry or coordinate across many teams. Debugging time has dropped by an order of magnitude on complex production issues.

Typical debugging sessions start with an alert: a key product metric, a model validation failure, an anomaly in gradient or loss during training, a prediction anomaly, or a feature distribution shift. HawkEye offers guided exploration on top of the needed analysis components for all of these entry points, and one top-line anomaly investigation can encompass several subordinate workflows.
From product metric to suspect snapshot
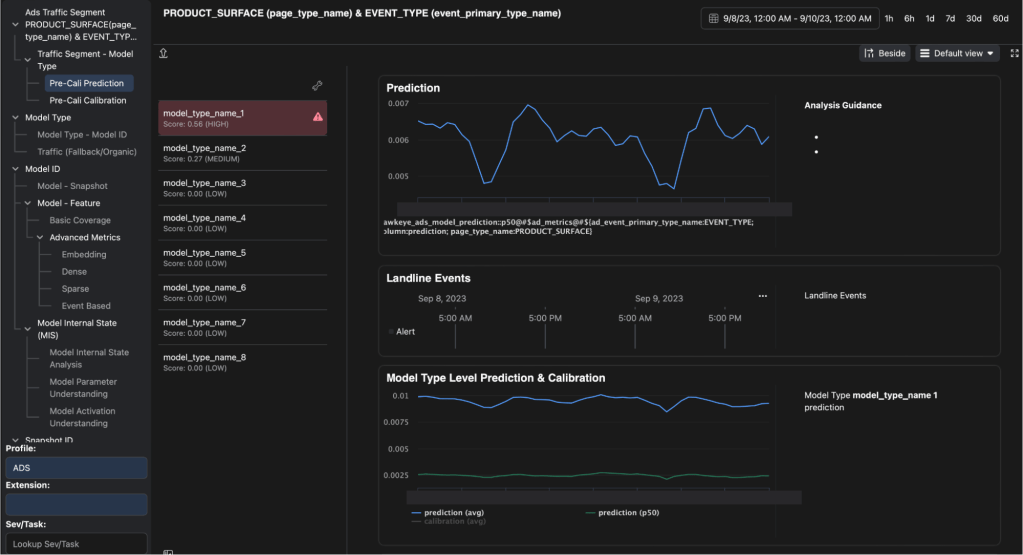
When a top-line product metric degrades, the first question is which model, infrastructure component, or traffic pattern caused it. Because multiple models may serve different segments or run as experiments, and experiment traffic changes over time, this is not straightforward. HawkEye correlates the top-line degradation with prediction-quality issues across all running experiments to surface the models likely responsible.
Once those models are flagged, the next step is aligning the degradation timeline with snapshot rollout history for each model. This narrows the candidates to a small set of recently introduced model snapshots.
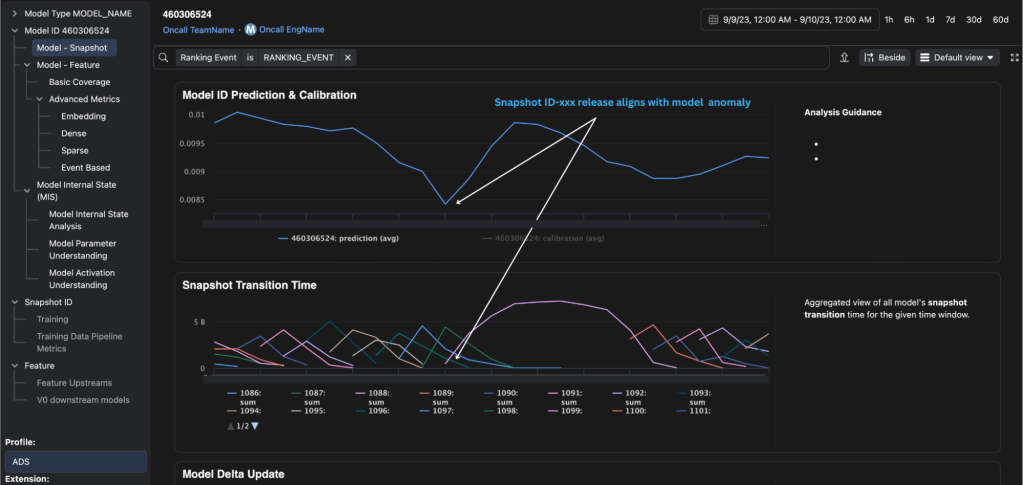
That separation matters because the correct response differs by cause. Rollback to a previous, stable snapshot provides immediate mitigation, but old models bring their own robustness risks. If the problem is a bad snapshot—caused by training data or the training process itself—rolling back merely defers the issue.
Zeroing in on features
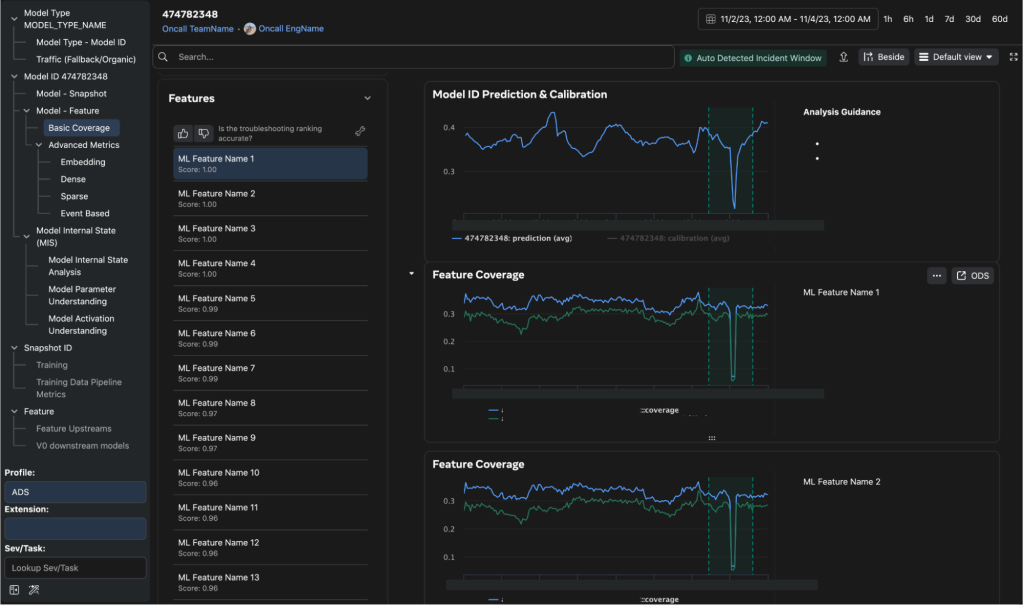
Serving models consume thousands of features, each backed by its own pipelines, at high request rates. To isolate which features drive a prediction anomaly in real time, HawkEye samples model inputs and predictions continuously, then computes correlations between time-aggregated feature distributions and prediction distributions during a degradation window.
That correlational analysis is fast but limited. HawkEye also runs feature ablation over serving-model snapshots to measure changes in feature importance between snapshots, a stronger signal indicating that a feature has a materially different impact on predictions than it did previously. Ablation is slower because it must cover the full feature-distribution hyperspace, so HawkEye presents both—real-time correlation for immediate triage, feature-importance drift for deeper investigation—as a ranked feature list for the on-call.
Tracing features upstream
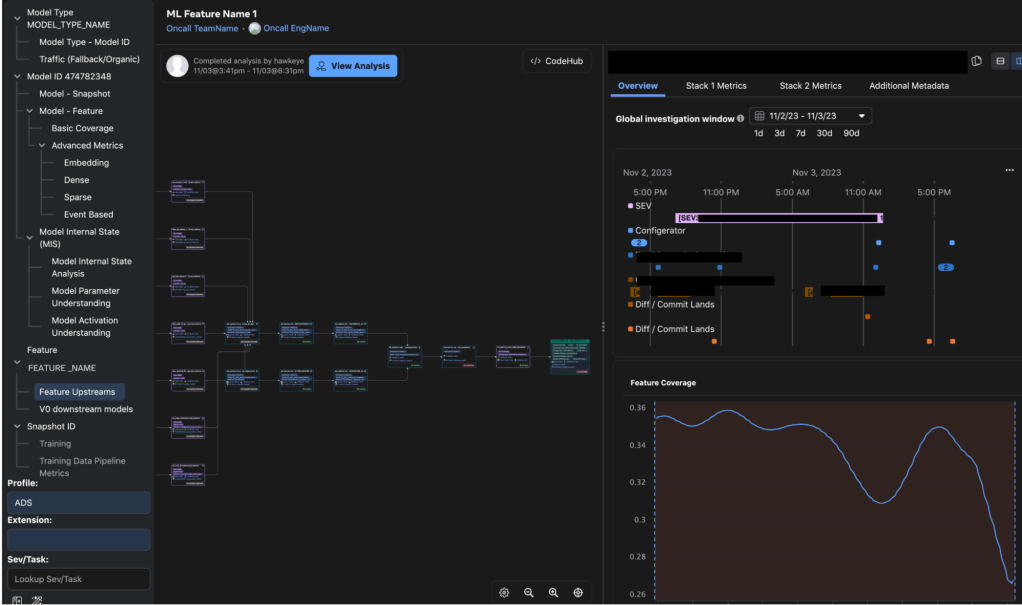
Even once a feature is isolated, the originating fault often lies further back. Features are produced by complex transformation pipelines, potentially including real-time joins, and stored by systems owned by different infrastructure teams. HawkEye keeps lineage metadata for every feature, tracking upstream data dependencies, transformation code, and configuration changes alongside statistical summaries of each node in the lineage graph.
Engineers move visually upstream along the graph, comparing statistics of lineage nodes against expected baselines. HawkEye correlates the problem feature with upstream data issues and provides a confidence measure for each candidate cause. Model anomalies are not required to trigger this investigation: feature health alerts can open the same workflow, so pipeline problems are caught before they reach a live model.
When the model itself is the problem
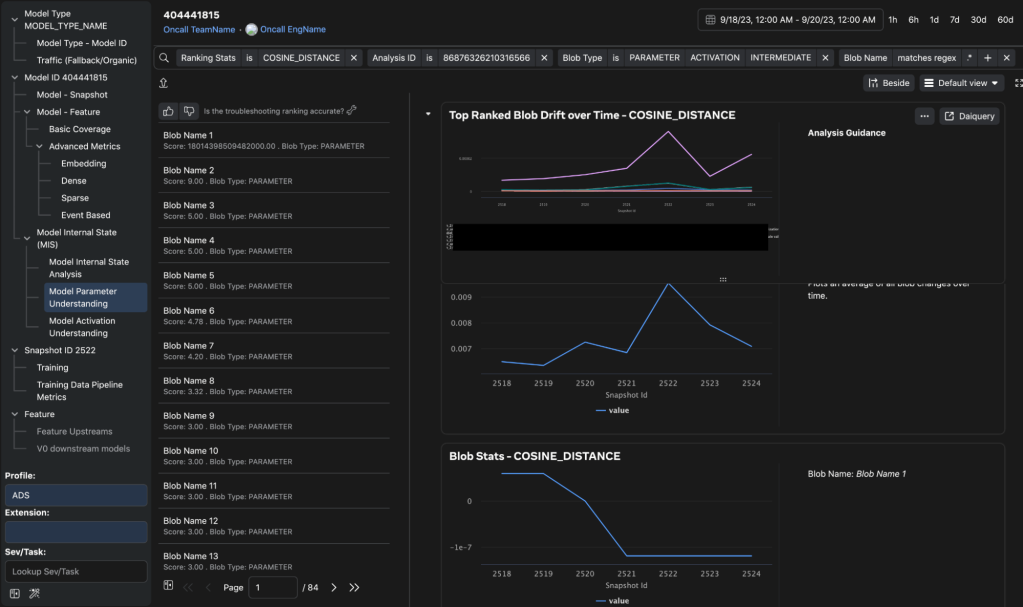
Feature quality is not the only suspect. The training run that produced a snapshot can introduce errors—through hyperparameters, architecture, or the training data. To distinguish model-bred problems from feature-bred ones, HawkEye compares current snapshot weights and biases against historically stable snapshots. Model parameters are normally stationary across versions; substantial divergence points either to corrupted training data or to loss/gradient explosion during training.

HawkEye also runs inference on each newly published snapshot using recent feature data, capturing neuron outputs and activation tensors along the forward pass. When a snapshot contains NaNs or extreme activations, HawkEye uses those tensors to walk upstream toward the input layer and downstream toward the output layer, attributing the problem to specific input features or tracing its effect on predictions. That graph walk also exposes architectural improvements—missing layer normalization, clipping, or new operators—that would prevent the issue.
Back to the training data
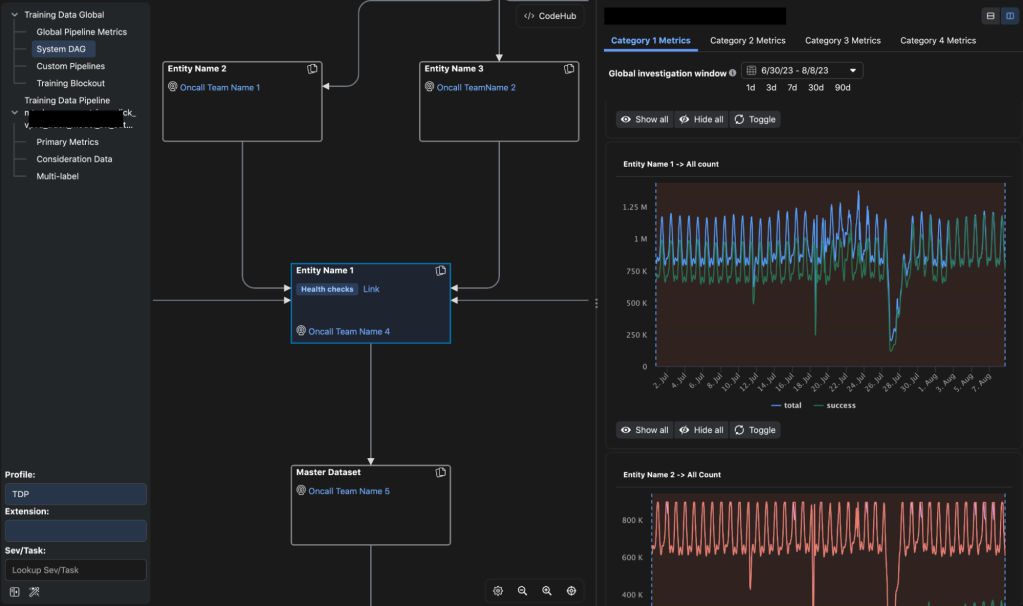
If training itself is the suspect stage, HawkEye links each snapshot to the pipeline that produced it. Engineers can inspect training data statistics at partition granularity and training-time metrics such as learning curves and loss evolution during training. The goal is to spot drift between training and serving label distributions, label imbalances, or corruption that crept in through complex upstream data pipelines.
When bad training data is confirmed, HawkEye surfaces the relevant pipeline health and offers mitigation actions, including pausing affected pipelines to stop additional damage from bad snapshots while the root cause is addressed.
What’s next
HawkEye continues to expand as new root causes emerge in production, growing both the workflows and the product surface around them. Meta is also piloting extensibility in the product and backend components so product teams can add their own generic or specialized debugging workflows on top of HawkEye’s infrastructure.


