Why CSS audits are awkward
Auditing code usually means scanning it for bugs or irregularities, including performance problems. In most languages the task is fairly concrete: something works or it does not. CSS breaks that assumption. Browsers mostly ignore errors, and the same visual result can be reached through many different rules. Linters and editor extensions help catch mistakes, but they stop short of the real target — a stylesheet that accumulates excessive colors, typographic definitions or z-index values is messy and unstable even when it parses cleanly.
Reaching that deeper level means looking at browser tooling, online analysis and command line utilities.
Chromium DevTools: inspecting first
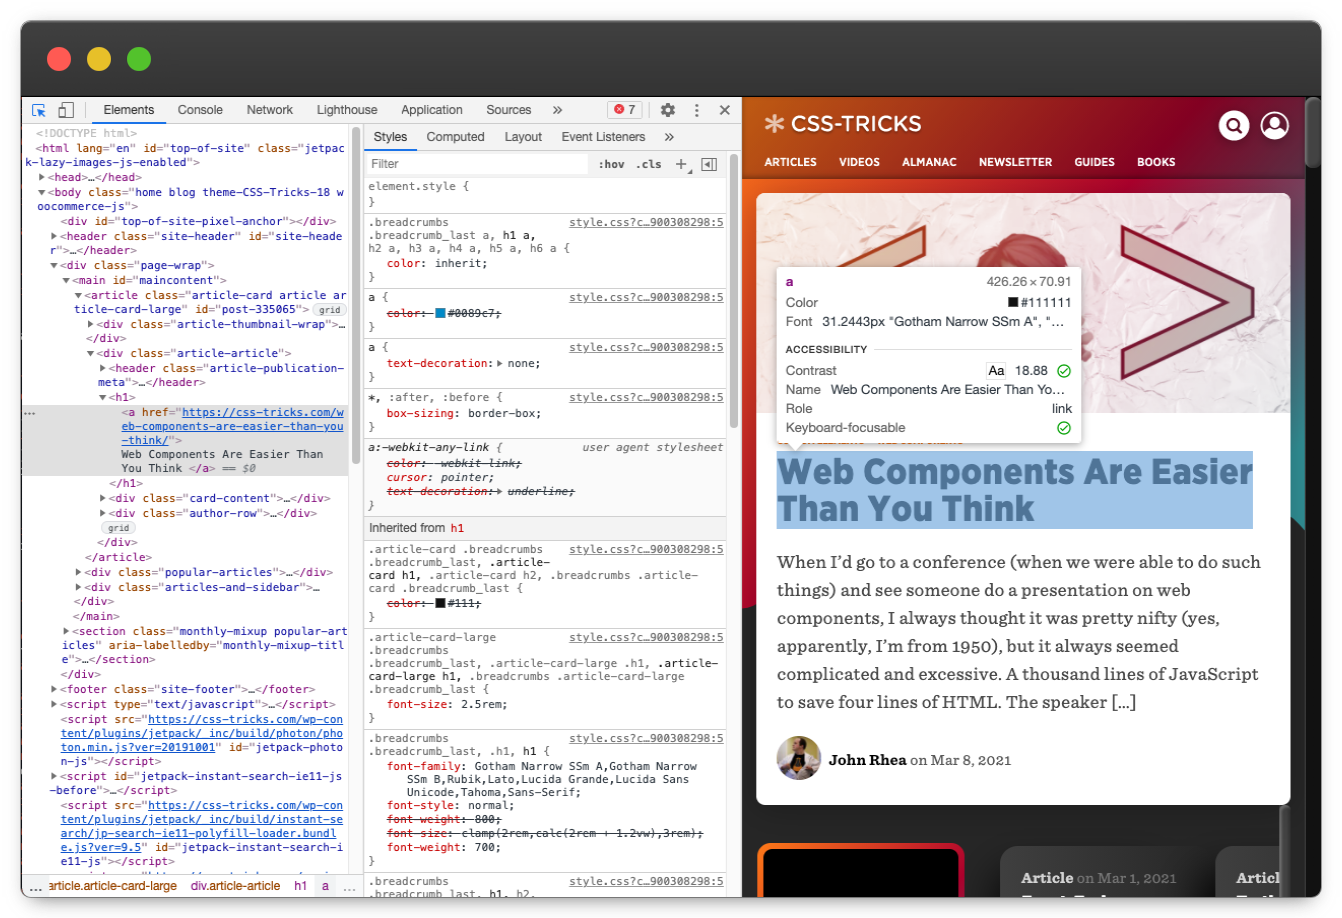
The Inspect tool is the manual entry point: select an element and review the rules applied to it, with additional details on colors, fonts, size and accessibility.
Layout and overview features
The Grid and Flex inspector is enabled in Settings under Experiments, by turning on CSS Grid and Flexbox debugging. It is mainly a layout debugging aid, though it also answers quickly whether Grid or Flexbox is used on a page at all.

CSS Overview is enabled the same way. Open it with CMD+Shift+P, type “css overview” and choose “Show CSS Overview.” It summarizes colors, fonts, contrast issues, unused declarations and media queries — a fast read on overall health. A proliferation of near-identical grays or too many type definitions signals a style guide being ignored, or perhaps never written.

Coverage, Rendering and performance timing
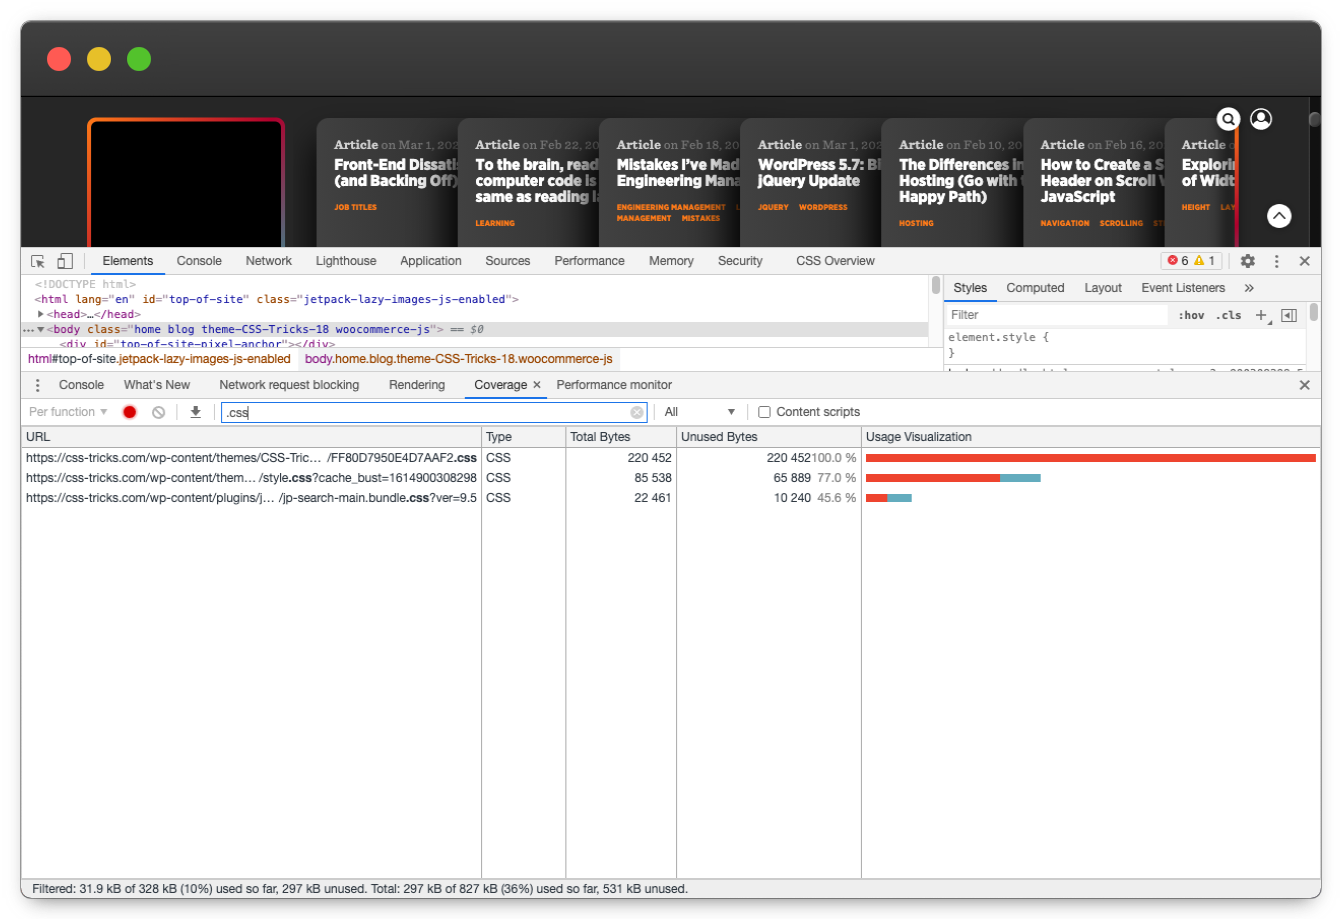
Coverage reports how much code is used and what percentage of the page’s payload it represents. Reach it through CMD+Shift+P → “coverage” → Show Coverage, then hit refresh; typing “.css” into the URL filter narrows the view to stylesheets. High coverage suggests CSS is generated per page rather than shared, which has implications for caching strategy.
The Rendering panel (same shortcut, “rendering”) offers three options worth using:
- Paint flashing draws green rectangles on repaint, exposing areas that cost too much to render.
- Layout Shift Regions draws blue rectangles when layout shift occurs; the “Slow 3G” preset under the Network tab makes these easier to spot, and screen recording slowed down afterwards helps pinpoint them.
- Frame Rendering Stats shows GPU and frame usage in real time, useful for diagnosing heavy animations and scrolling problems.
These go beyond a conventional audit, but they are essential for knowing whether CSS is efficient and does not drain a device’s battery. Other settings serve debugging instead: emulation, forcing prefers-color-scheme or the print media type, and disabling local fonts.

For runtime cost, the Performance Monitor (same shortcut, “performance monitor”) tracks how many recalculations and layouts an interaction or animation triggers.

The Performance panel records all browser events during page load. Enable “Screenshots” and “Web Vitals,” then note First Paint, First Contentful Paint, Layout Shifts and Largest Contentful Paint, along with the pie chart showing painting and rendering time.

None of this is a classic auditing tool, but it reveals which CSS features are in play, how efficient the code is and how it performs — all central to an audit.
Browser-based analyzers
Specificity Visualizer: paste in CSS and get a chart of specificity against position in the stylesheet, plus two charts showing usage of specificities. A large share of red markers indicates selectors worth rewriting; screenshots make a useful before-and-after record.

CSS Specificity Graph Generator plots the same property differently, revealing how selectors are organized. Its own guidance: “spikes are bad, and the general trend should be towards higher specificity later in the stylesheet.”

CSS Stats takes a site URL and produces segmented analytics — declaration count, colors, typography, z-index values, specificity and more. Save the output for later comparison.

Project Wallace compares and visualizes changes across imports, so you can see how the codebase changed between states — handy when you need to demonstrate that a refactor improved things. It is free for one project, with paid plans for more.

Command line utilities
Wallace runs with just wallace plus a site name and prints a full CSS report. The most telling numbers are how often !important appears, the count of IDs, and the top specificity value with how many selectors reach it. Unlike CSS Stats, it extracts inline CSS as well as external files, which is why the two reports disagree.

csscss identifies rules that share the same declarations, surfacing duplication and opportunities to trim the codebase. It only runs on Ruby, and de-duplicating may not be worthwhile given current caching mechanisms.

Also worth a look
- Color Sorter — sorts CSS colors by hue, then saturation.
- CSS Analyzer — generates an analysis for a string of CSS.
- constyble — a CSS complexity linter built on CSS Analyzer.
- Extract CSS Now — pulls all CSS from a single page.
- Get CSS — scrapes all CSS from a page.
- uCSS — crawls sites to identify unused CSS.
Running a codebase through any of these and improving even one part of it is the point. Organized, well-written CSS means less time debugging and more time building.