
Quantifying the revenue impact of speed improvements
After you've made your company's site noticeably faster, the question becomes: how do you show stakeholders the revenue your work has generated? One effective approach is calculating the relative mobile conversion rate (Rel mCvR). This metric helps quantify the effects of site improvements while filtering out external factors like marketing campaigns that can obscure your findings.
Why relative mobile conversion rate?
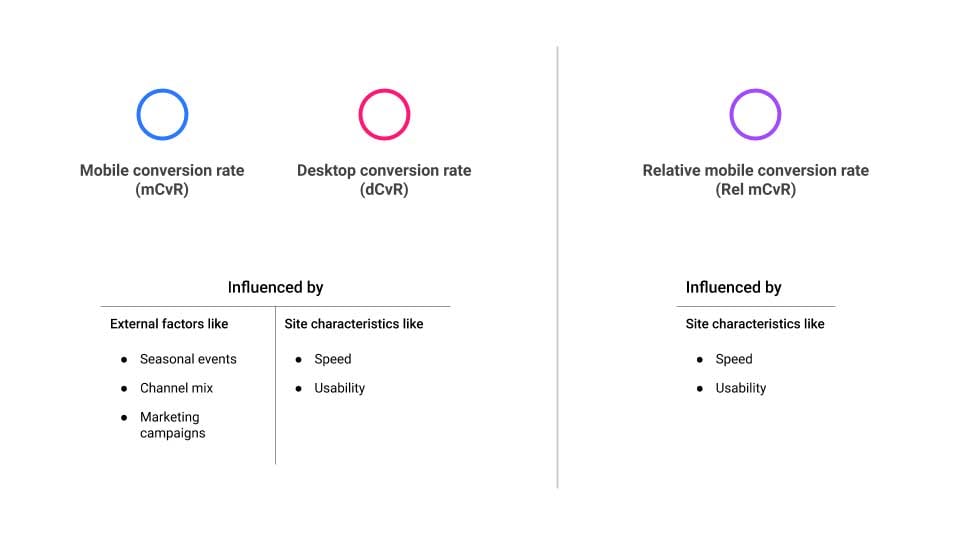
A site's conversion rate is influenced by both site characteristics—such as speed and usability—and external factors like marketing campaigns, seasonal events, and channel mix. Since speed improvements are most visible on mobile, that's where you should focus your analysis. However, looking at the mobile conversion rate alone is noisy. Instead, the relative mobile conversion rate divides the mobile conversion rate by the desktop conversion rate. External factors tend to affect both desktop and mobile equally, so this ratio reduces noise and makes it easier to see whether increases in mobile effectiveness were actually driven by speed improvements.
Running the analysis with Google Analytics
To get started, you'll need access to your site's Google Analytics account, or you can collaborate with your analytics team. If you don't have an account, you can set one up using the official Get started with Analytics guide.
Follow these steps to prepare the data:
- In Google Analytics, click Admin. Under View, choose View Settings and copy the View ID.
- Open the template spreadsheet and click File, then Make a copy.
- Insert the View ID into fields B3, C3, and D3. If your Analytics uses goals instead of Ecommerce Conversion Rate, change fields B6 and C6: remove
ga:transactionsPerSessionand typega:goalConversionRateAllin both fields. - In the spreadsheet, click Add-ons > Google Analytics, and choose Run reports. The results will appear on the sheet labeled Rel mCvR.
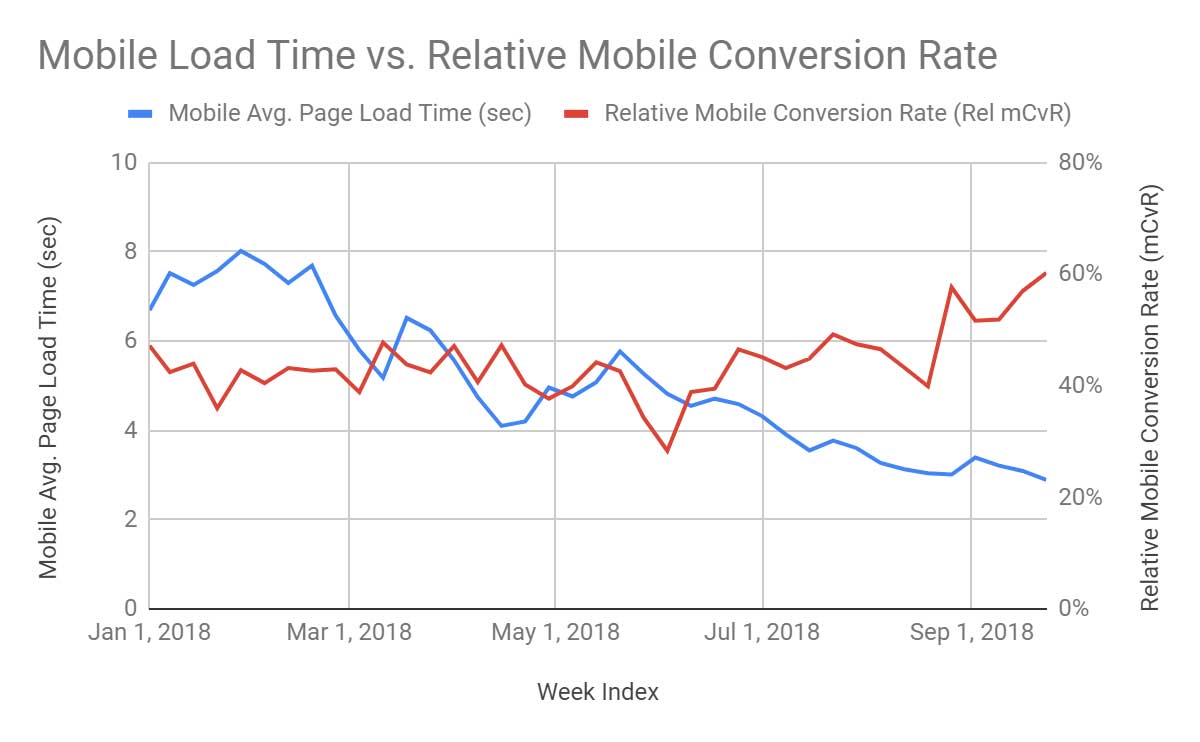
You should now have a chart similar to the one shown here:
Interpreting the results
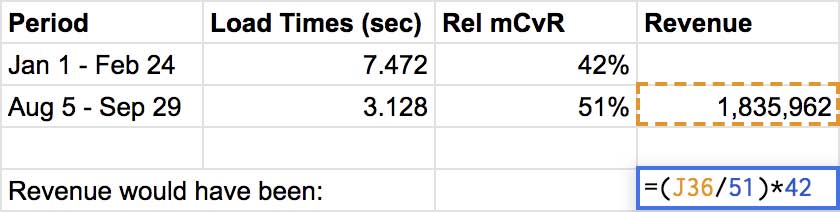
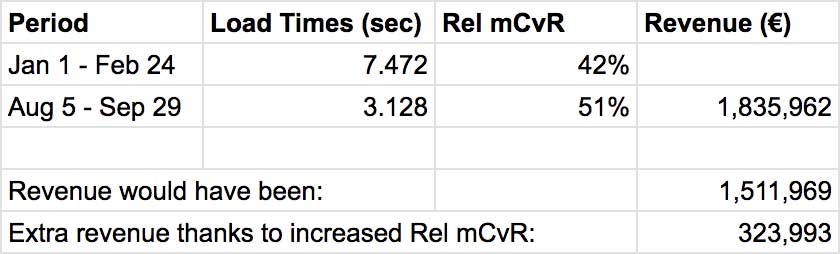
Next, you'll compare two periods from the chart: one before the speed optimization (when load times were high) and one after (when load times should be lower). In the example below, that's eight weeks in Jan–Feb compared to eight weeks in Aug–Sept.
In a new sheet, calculate the average load time and Rel mCvR for both periods. Then, pull the revenue generated from mobile visitors during the period after the optimization. Revenue data is available in Google Analytics under Audience > Mobile > Overview.

Now estimate what revenue would have been if Rel mCvR had not improved. Divide the actual revenue (€1,835,962) by the current Rel mCvR (51%) and multiply by the pre-optimization Rel mCvR (42%).
Finally, subtract the company's actual earnings from the hypothetical figure where Rel mCvR stayed flat.
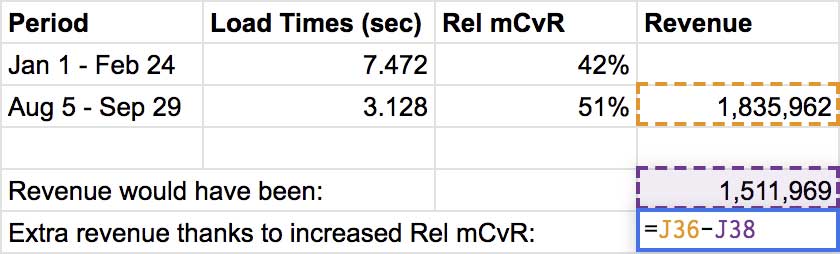
In this example, the company earned an additional €323,993 over eight weeks directly attributable to the improvement in Rel mCvR—in other words, thanks to a faster mobile site.
Caveats to keep in mind
Rel mCvR is not a perfect measurement. Other site changes, such as UX improvements, can also influence the metric. Consider these points when relying on the results:
- Isolate changes. Verify that speed was the only major site change during the period you study. If other changes occurred, Rel mCvR reflects the combined effect, not speed alone.
- Watch for desktop-only changes. Any event affecting the desktop site but not the mobile site can skew the ratio. If such changes occurred, exclude that period from your analysis.
- Understand the channel-shift concern. You might worry that an increase in Rel mCvR merely reflects conversions moving from desktop to mobile rather than an overall gain. Remember that Rel mCvR increases only when mobile conversion rate rises faster than desktop conversion rate, so the calculation already errs on the conservative side, providing a built-in safety margin.
Key takeaway
Despite its limitations, Rel mCvR is a low-cost way to estimate how much a speed optimization contributed to revenue—without resorting to server-side tests or slowdown experiments. Quantifying the performance–revenue relationship makes the value of engineering work tangible for non-technical stakeholders, helping you secure support for future performance projects.



