

Anatomy of a Bundle
Statoscope, created by Sergey Melukov, is a toolkit for inspecting, analyzing, and validating webpack bundles. The project began in 2016 as a demo called "Webpack Runtime Analyzer," intended to offer browser-based, real-time insight into bundle internals — functionality previously limited to console utilities. After a pause, Melukov revived the idea in 2018 with deeper webpack experience, releasing the first full version of Statoscope in October 2020 with a broader feature set.
Understanding what Statoscope surfaces requires a quick look at how webpack structures output. A typical configuration with two entry points, such as a main page and an admin area, produces the following hierarchy:
module.exports = {
  entry: {
    main: './main.js',
    admin: './admin.js',
  },
}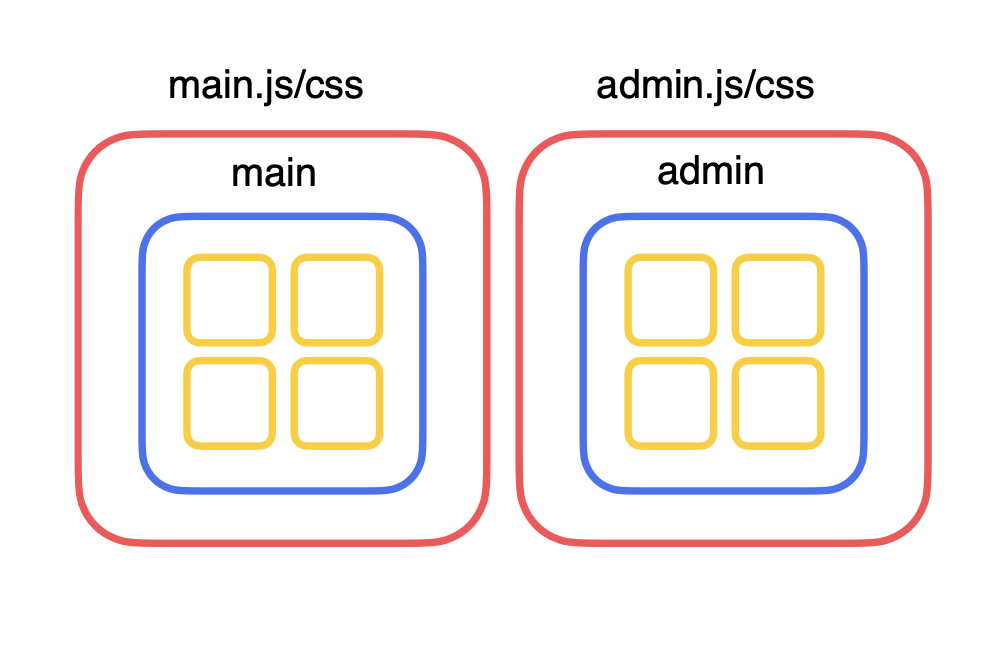
Each JavaScript or TypeScript file becomes a module. Modules are grouped into chunks, which correspond to entry points or dynamically loaded portions of the app. Chunks are ultimately wrapped into assets — the final files emitted to the dist or build directory.
Webpack’s build pipeline involves five stages:

- Parse input files (JS, TS, CSS) into an abstract syntax tree.
- Build a dependency graph by resolving imports and exports between modules.
- Optimize the graph — deduplicating, merging, or removing unused exports to shrink output.
- Render assets from the optimized graph.
- Write the generated files to disk.
Statoscope works with the stats.json file that webpack generates during this process. This file contains a complete record of modules, chunks, and assets, which Statoscope reads to produce an interactive HTML report.
Collecting Stats
There are two ways to obtain stats for Statoscope. The quickest is to run webpack with the --json flag, directing output to a file, then upload that file to the Statoscope sandbox site:
$ webpack –json stats.jsonFor richer data, add the Statoscope plugin directly to your webpack configuration:
config.plugins.push(new StatoscopeWebpackPlugin())The stats file itself aggregates internal webpack data — module identifiers and paths, the chunks they belong to, and the resulting assets — into one large JSON document:
{
  "modules": [/*...*/],
  "chunks": [/*...*/],
  "assets": [/*...*/],
  "entrypoints": {/*...*/},
  /*...*/
}
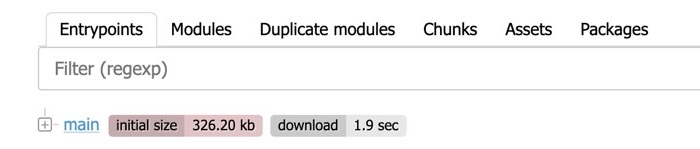
A module entry in the stats typically includes its identifier, file path, and a reasons field listing where the module is imported and used. Statoscope translates this raw information into a visual interface grouping entrypoints, modules, chunks, and assets:
{
  "identifier": "babel-loader!./src/index.js",
  "name": "./src/index.js",
  "reasons": [/*...*/],
  /*...*/
}
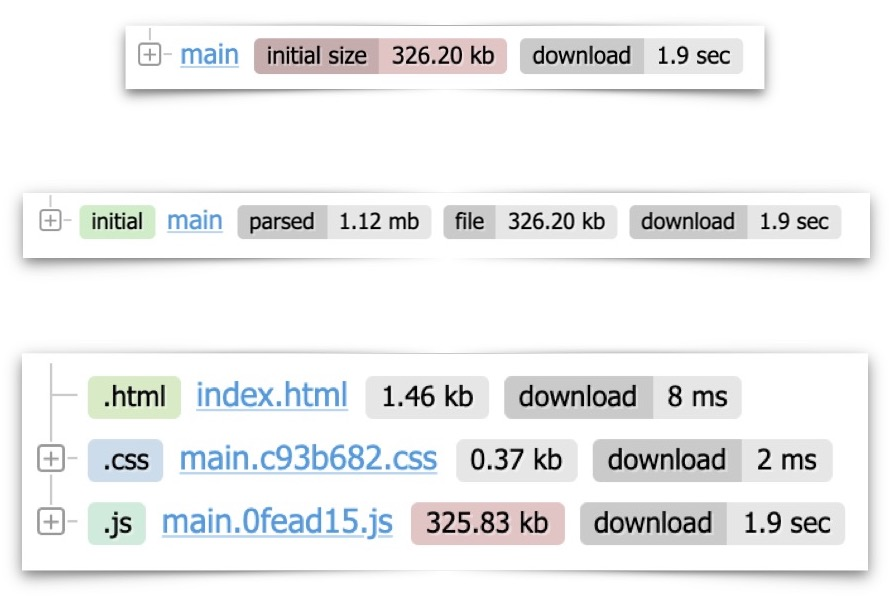
Statoscope distinguishes two chunk types:
initial: loaded when the page first loads.async: produced by dynamic imports, loaded only when needed — useful for code-splitting large libraries that don’t belong on the critical path.
Dependency and Size Insights
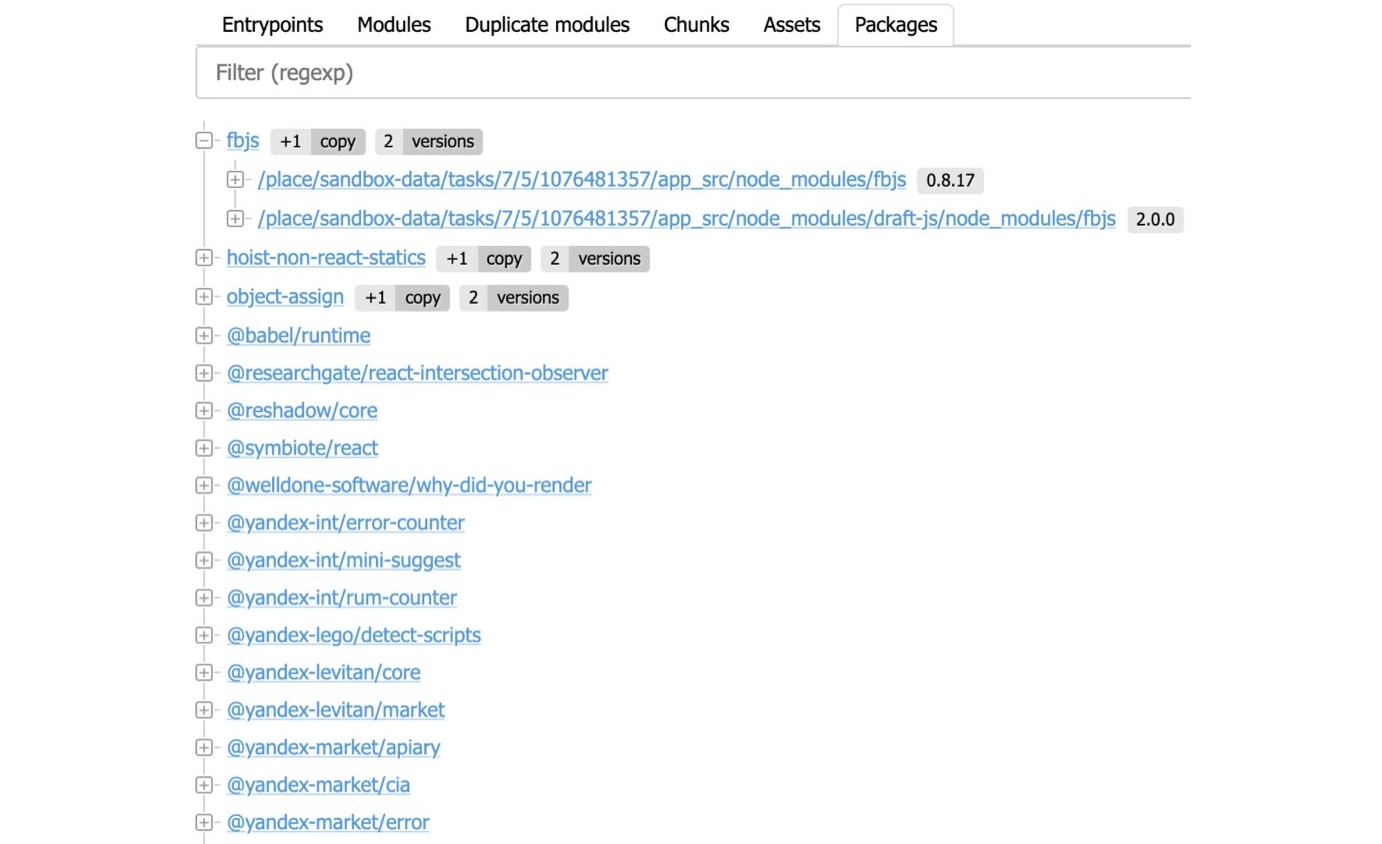
Beyond structural visualization, Statoscope derives a package tree from the stats, revealing which npm packages are bundled and how many copies of each exist. This matters because two dependencies may rely on different versions of a shared package, silently duplicating it in the final bundle. Statoscope flags such cases — for example, when fbjs 0.8.17 appears at the root while version 2.0.0 is pulled in by draft-js — prompting a dependency update to eliminate the duplicate.
Webpack’s raw stats do not include package version information; Statoscope enriches the data to make this analysis possible.
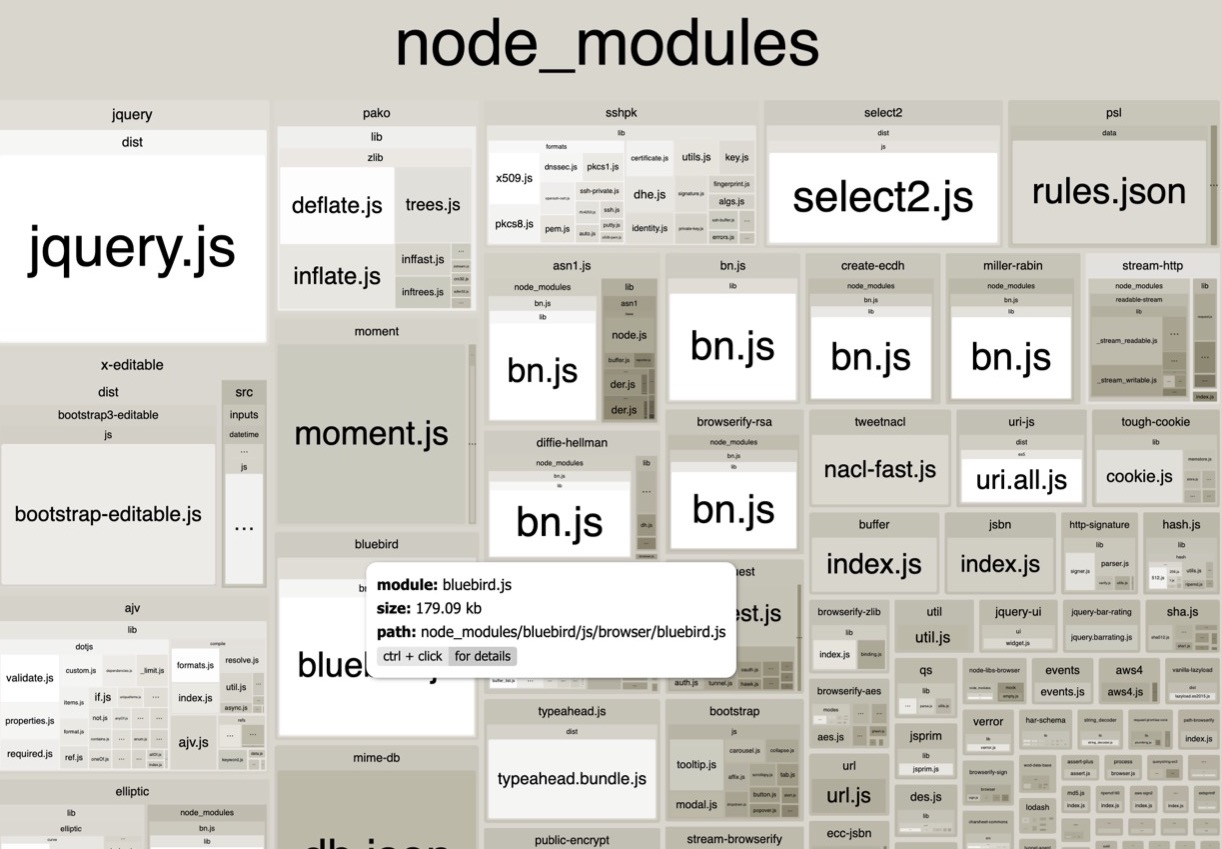
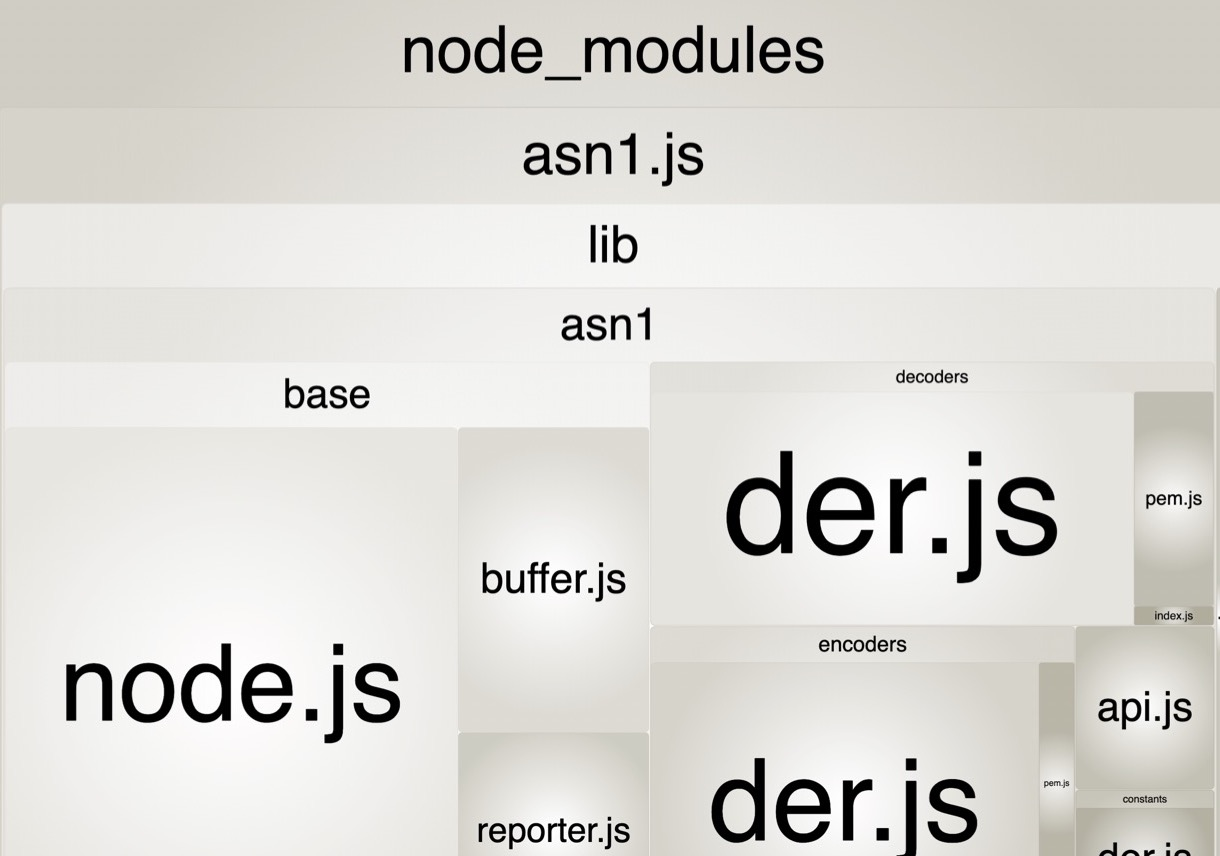
Statoscope also includes a module map for exploring how modules are connected. While similar in spirit to tools like Webpack Bundle Analyzer, which inspects webpack’s internals, Statoscope works from the stats file and consolidates module, chunk, and asset analysis into one view. Individual package pages let you drill into why a particular dependency is heavy:
Comparing Builds
One of Statoscope’s most useful capabilities is comparing two stats files side by side. Selecting a previous and a current stats file highlights what has changed across the bundle — which modules were added, removed, or resized, and which chunks were introduced or dropped:
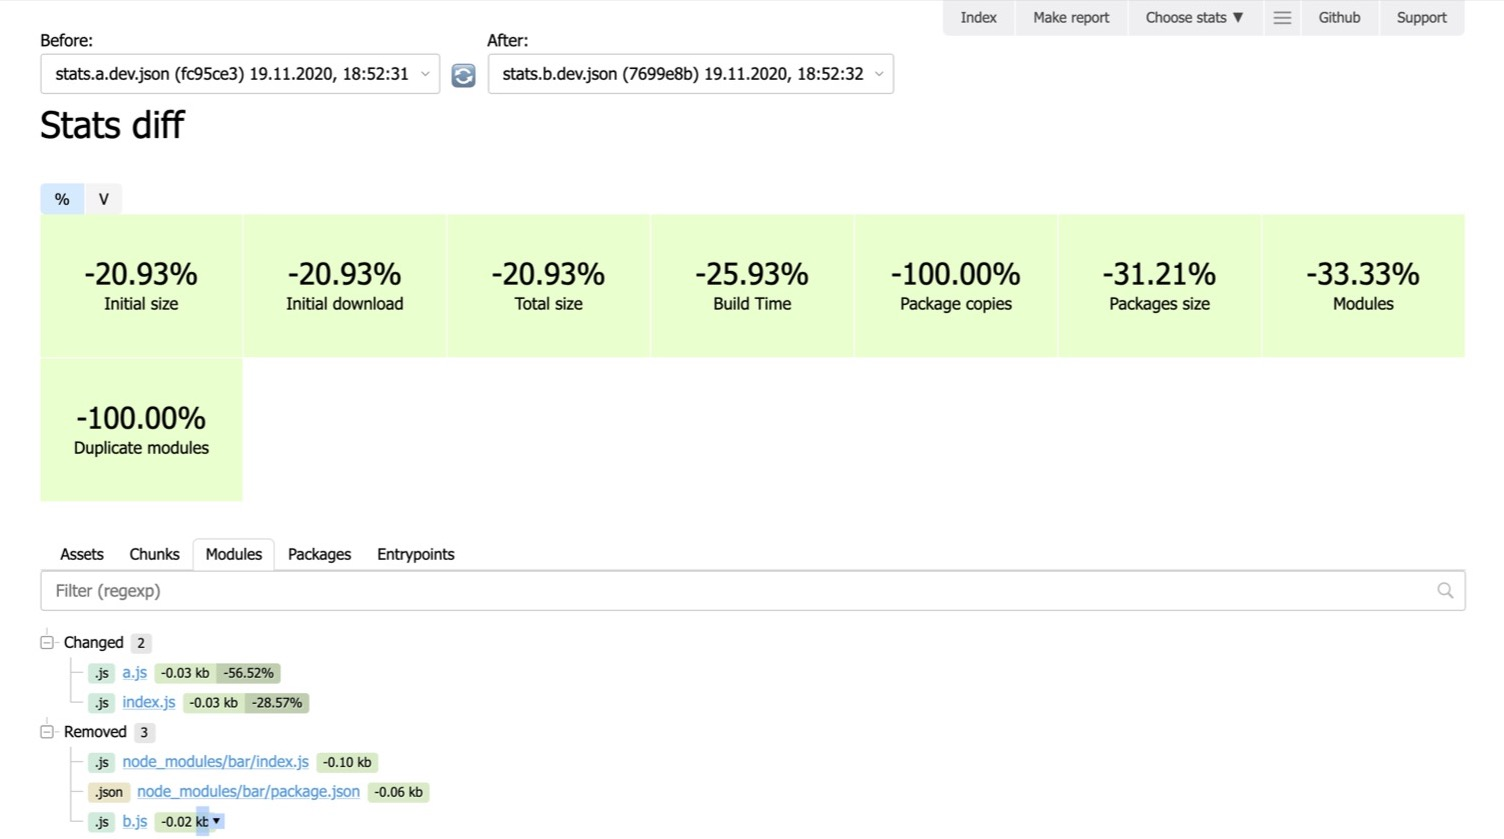
This workflow fits naturally into a feature-branch review: generate stats from master and from your current branch, then check whether the new feature increases bundle weight before merging. Statoscope surfaces exactly where and how the size has shifted, so regressions are caught early rather than discovered after deployment.
Roll Your Own Reports
When the built-in reports aren't enough, Statoscope lets you define your own. The challenge it solves is practical: stats files are .json blobs that can reach several gigabytes. Extracting anything meaningful means writing a lot of code in a ad-hoc format nobody wants to parse by hand.
Querying With Jora
The first tool for cutting through that noise is jora, a query language for JSON. Consider the task of listing all modules sorted by name. In plain JavaScript, that's a verbose loop. In Jora, it collapses to a single query over the compilations and their modules:
compilations.modules.sort(=>name)Jora behaves similarly to tools like jq, so familiar patterns apply. Three examples show its range. Filtering narrows a set by a condition, say, modules over a thousand bytes:
modules.[size > 1000]Mapping transforms the data structure itself, like flattening modules into objects with a new size field:
modules.({module: $, size})A "map call" goes further by generating a function that returns the transformed object on each iteration:
modules.(getModuleSize(hash)).sizeRendering Views With Discovery.js
A query result is just data; you still need interface elements to make it readable. Rather than forcing you to write and host a full React application, Statoscope leverages Discovery.js, a platform for declarative UI. It ships a ready-made kit of buttons, titles, badges and indicators, shown on the left side of its workspace:
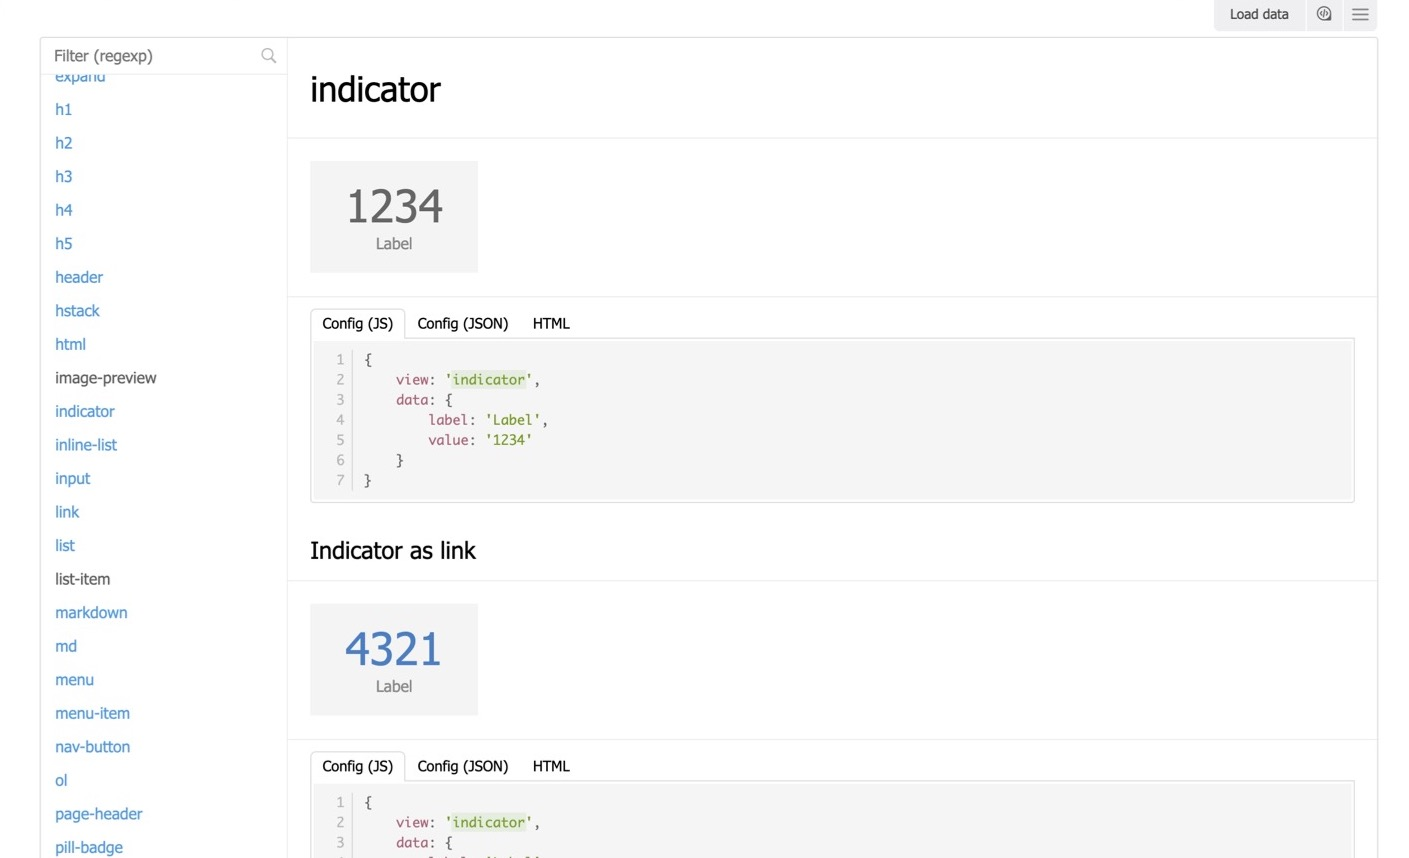
The key feature is that composition is described in JSON. A layout definition can request an indicator view, binding a label and value to data fields:
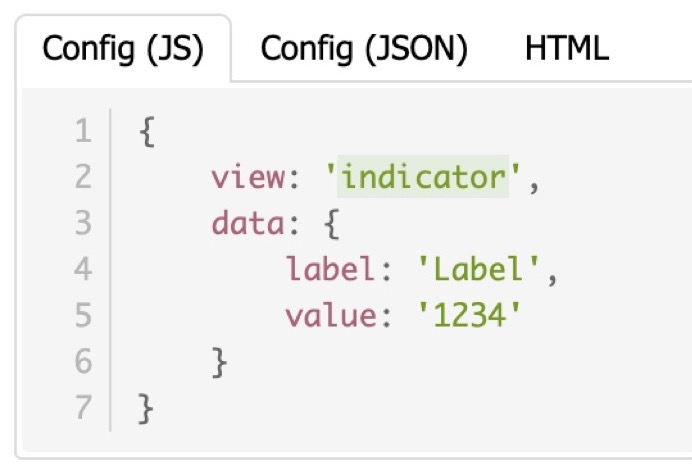
From there, the platform renders the HTML. The flow becomes: query the data with jora, describe the view with a Discovery.js layout, and the report is fully formed.
On-the-Fly Reports
Statoscope exposes this combination of query and layout through its Make report interface. In the browser, you type a jora query in one field, set the layout JSON below it, and get the resulting report immediately. A simple example takes all modules from every compilation, sorts by size, and puts the heaviest at the top:
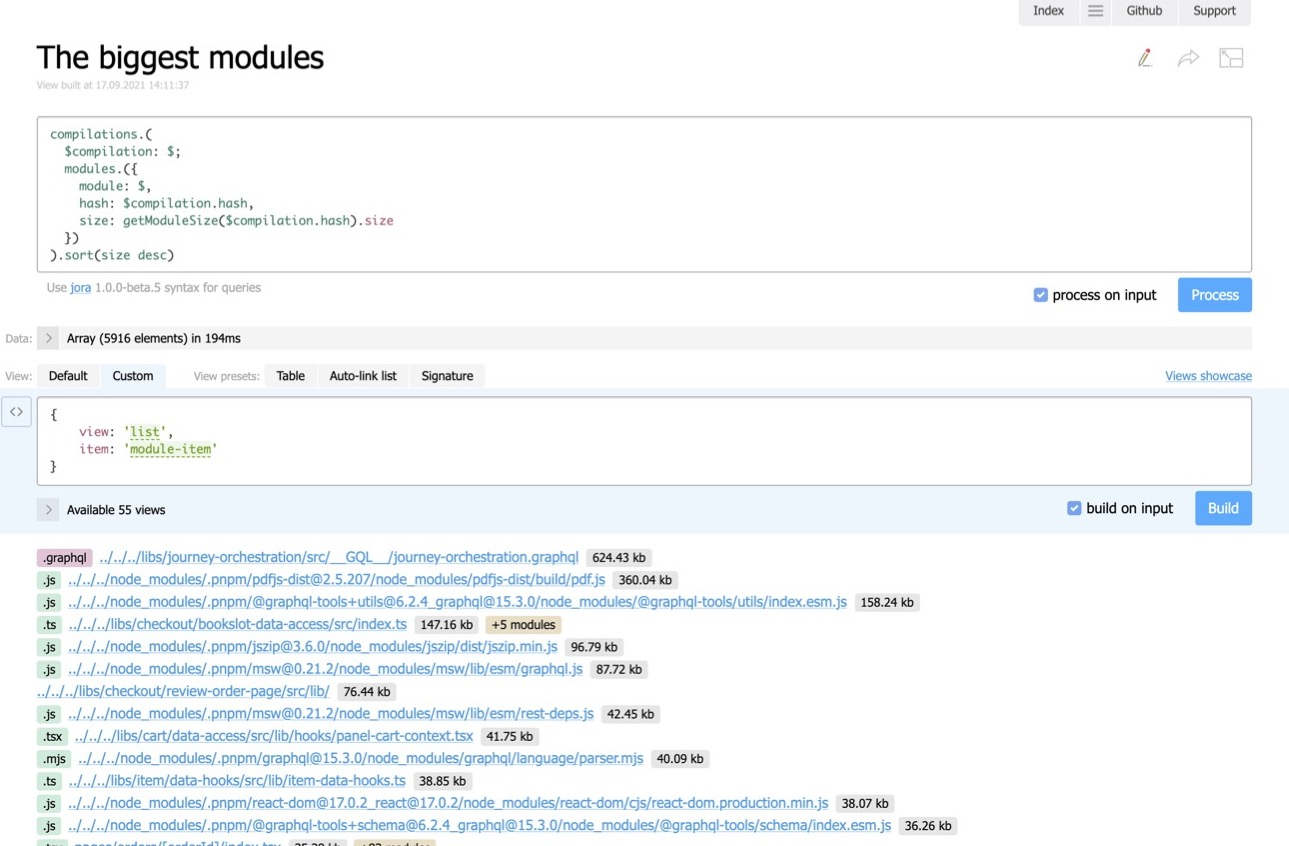
This being a URL-based report, it's shareable. Run it in CI, copy the link into your chat, and a colleague opens it to see the identical view.
Embedding Reports In CI
Reports can also be baked straight into the HTML generated by the Webpack plugin. Another way is to use the plugin's reports property directly in your Webpack configuration:
new StatoscopeWebpackPlugin({
  reports: [
    {
      id: 'top-20-biggest-modules',
      name: 'Top 20 biggest modules',
      data: { some: { custom: 'data' } }, // or () => fetchAsyncData()
      view: {
        {
          data: `#.stats.compilations.(
            $compilation: $;
            modules.({
              modules: $,
              hash: $compilation.hash,
              size: getModuleSize($compilation.hash)
            })
          ).sort(size.size desc)[:20]`,
          view: 'list',
          item: 'module-item',
        },
     },
    },
  ],
})
The report's name appears at the top of the configuration snippet, with a data source on the line below. That data hook is important because it allows external metrics to flow in. If you track things like daily build durations in separate storage, you can reference them here and render a chart that shows how the bundle changed over time — Discovery.js handles line graphs too. Any embedded report appears in a dropdown inside the UI report:
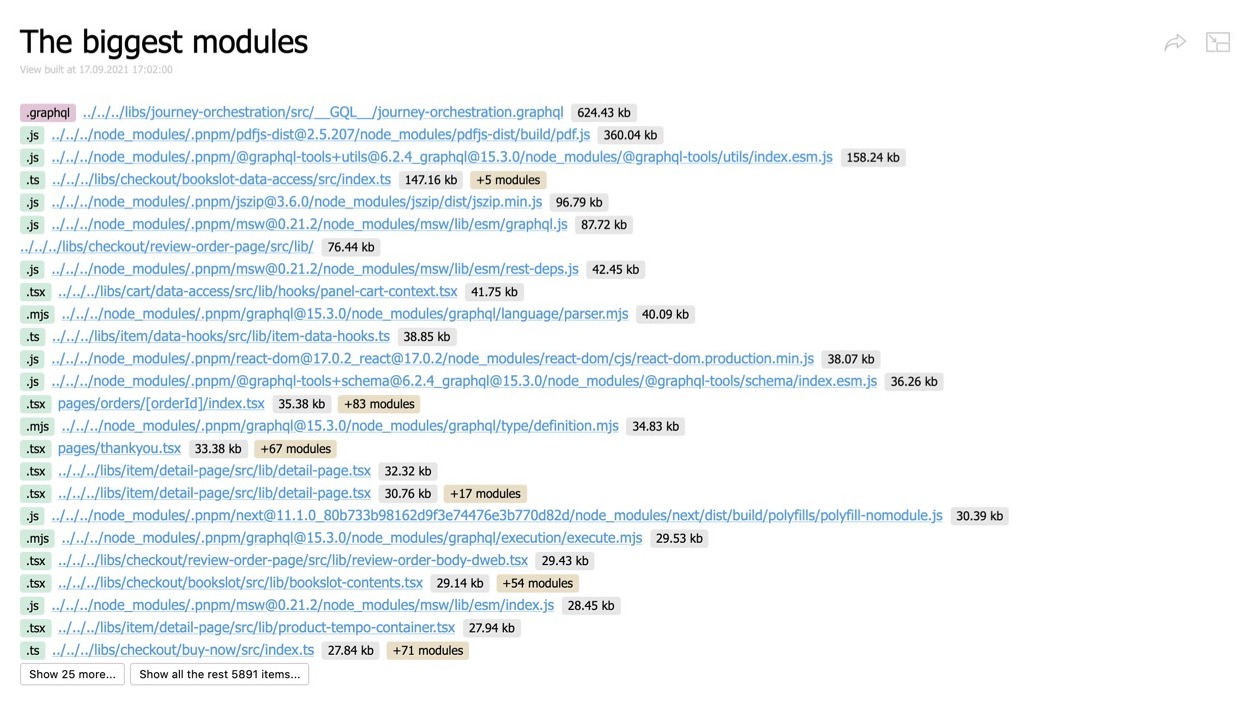
The distinction between the two embedding strategies matters for distribution. Generating a report on the fly produces URLs that encode the query and view. Embedding into the HTML report creates a self-contained file from CI; it doesn't rely on URL parameters, making it easy to share as an artifact.
Validation Rules
Statoscope's validation feature answers a very specific need: keeping pull requests that bloat the bundle out of the main branch. The author's search for an easy way to check stats files found nothing suitable, so the Statoscope CLI emerged from that gap. It's a console utility, built deliberately to be a plugin platform rather than a hardcoded tool, with validation rules for Webpack bundles at the moment and a roadmap for other bundlers — Rollup and esbuild being the candidates.
Installing the pieces is straightforward:
npm install -D @statoscope/stats-validator-plugin-webpacknpm install -g @statoscope/cliThe behavior mirrors ESLint. There's a config where you declare plugins and rules, and a validation run reports either to the console or as a detailed HTML report. Two reporters ship with the tool currently: console and stats-report. The HTML format matters, because scanning text-based console errors for a large bundle quickly becomes unreadable. Validation output in HTML builds an interactive tree where entries highlight, collapse, and link to their related source modules:
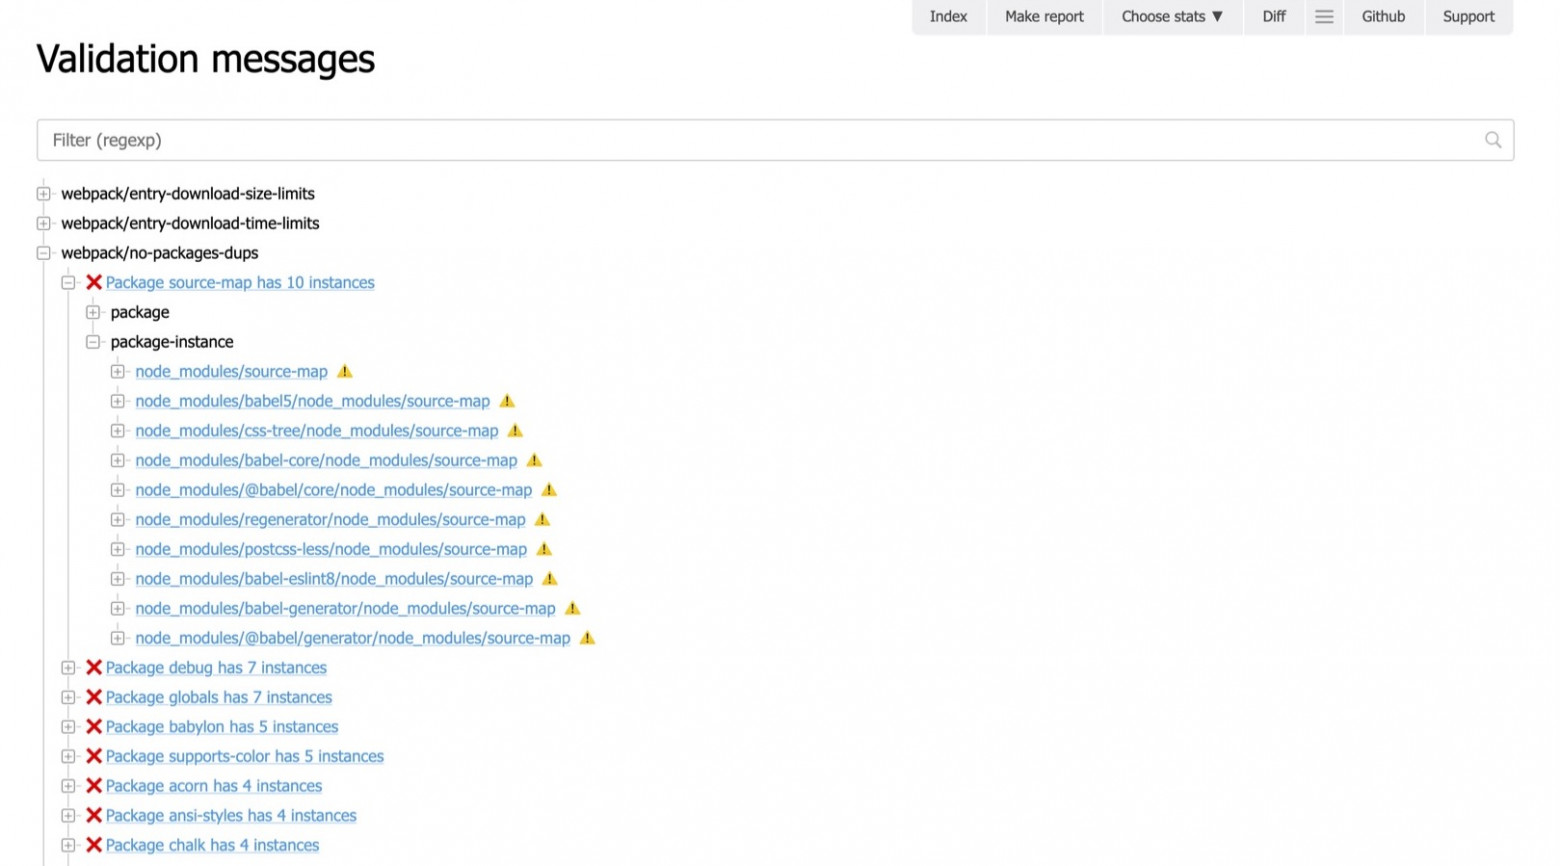
That tree includes a filter field, a clear improvement over piping console logs through grep.
Configuring Rules
The validation configuration follows the same plugin model as ESLint, including the property named rules:
module.exports = {
  validate: {
    // use a plugin with webpack-specific rules
    plugins: ['@statoscope/webpack'},
    reporters: [
      // use console reporter
      '@statoscope/console',
      // use reporter that generated an HTML-report with validation results
      ['@statoscope/stats-report', {open: true}],
    ].
    rules: {
      // a rule that fails validation if build time is worsen at least 10 seconds
      '@statoscope/webpack/build-time-limits': ['error', {global: 10000}],
      // you maight use any other rules
      }
    }
}
Roughly a dozen rules are available, and each is documented in the plugin's README within the Statoscope repository. Practical examples include a per-resource budget for the initial bundle, a limit on client-side loading time, and a check that rejects duplicate instances of a package. Depending on the rule, the configuration spaces for thresholds vary; a 3G download-time guard, for instance, requires specifying the connection profile and the allowed budget.
The actual validation command expects a path to the stats file:
$ statoscope validate --input ./stats.jsonReference Comparisons
Some checks compare one stats file against another. The terminology is split into two roles: input refers to the current bundle file under test (typically from your branch), while reference is the base file — for example, the one built from the master branch. This enables comparative rules, such as forbidding a size increase beyond 2% relative to the reference. Checks of that nature surface errors in both console and browser outputs, giving you precise numbers around whether a PR is actually an improvement or a regression.
Querying Stats From The CLI
The webpack stats.json contains everything about modules, chunks, and assets, but pulling a specific value out of it — say, total bundle size or module count — is awkward if you only have the visual report. The statoscope query CLI command solves this by letting you run a Jora query directly against stats files. You specify the query and the target stats, and the utility prints the answer, for example the number of modules in the bundle.

Queries can be saved to a file and reused. For instance, you might keep a query.jora file, run it against a stats file, and write the output to result.json. A common use case is extracting validation error counts to include in an automated pull request comment.

Statoscope In CI
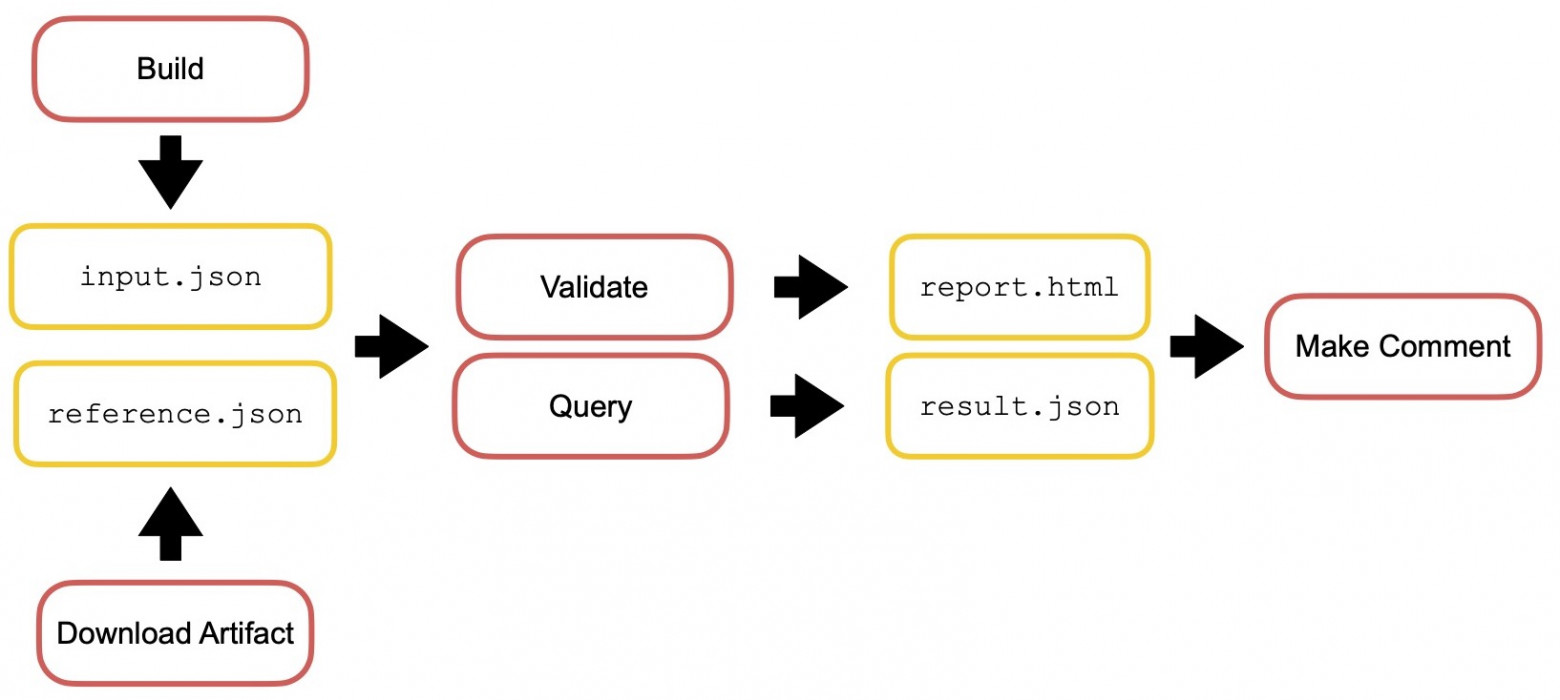
Wiring validation and queries into a GitHub Actions workflow gives you a complete bundle-checking pipeline. The process relies on two artifacts: input-stats from the current branch and reference-stats from the master branch.
For every commit merged into master, you build the bundle, extract its stats, and save it as reference.json using GitHub's built-in artifact storage. For each pull request commit, you do the same but name the file input.json, then download the stored reference.json. Both files feed into statoscope validate — which produces a report.html — and statoscope query, which outputs a result.json.
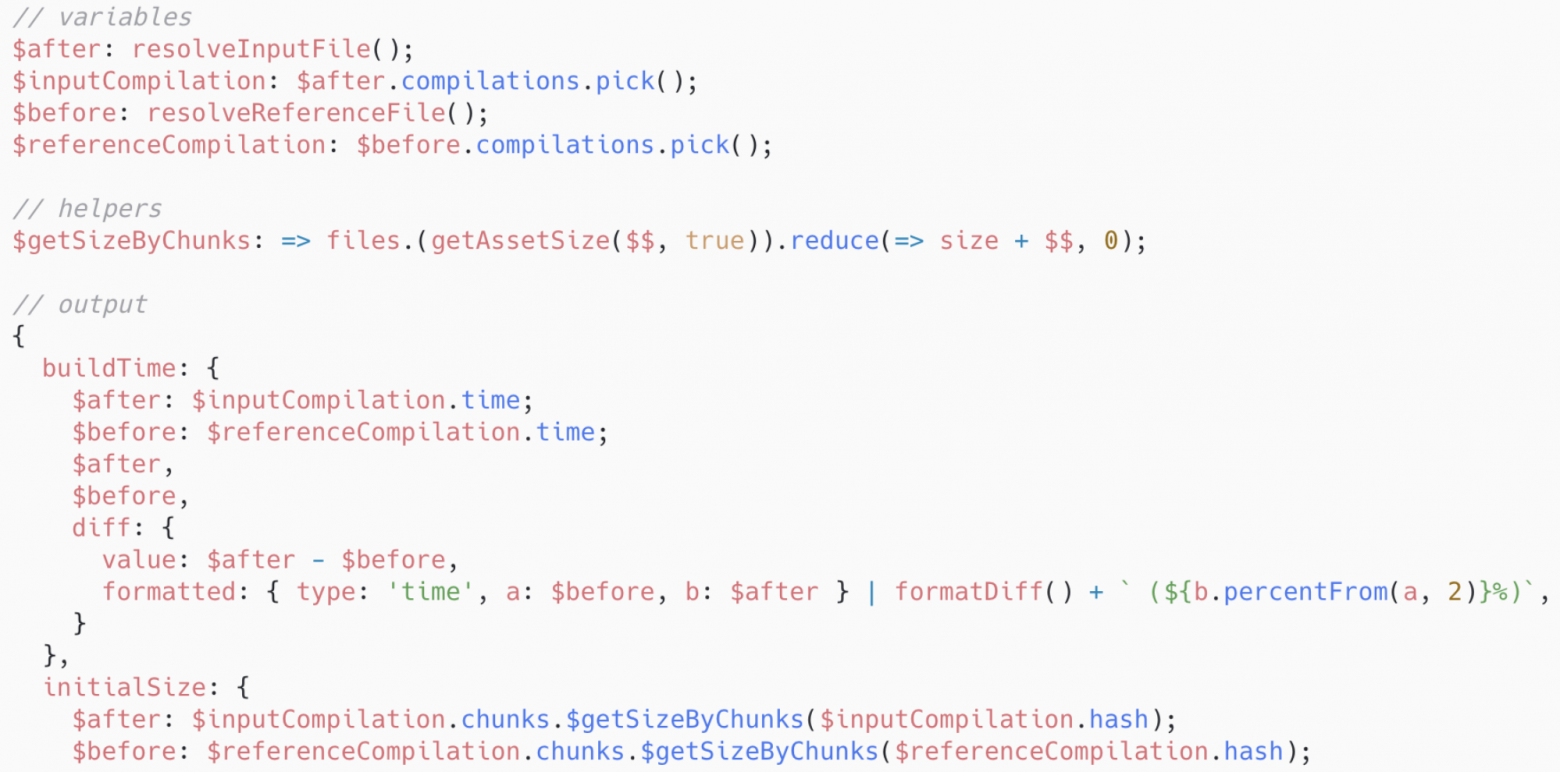
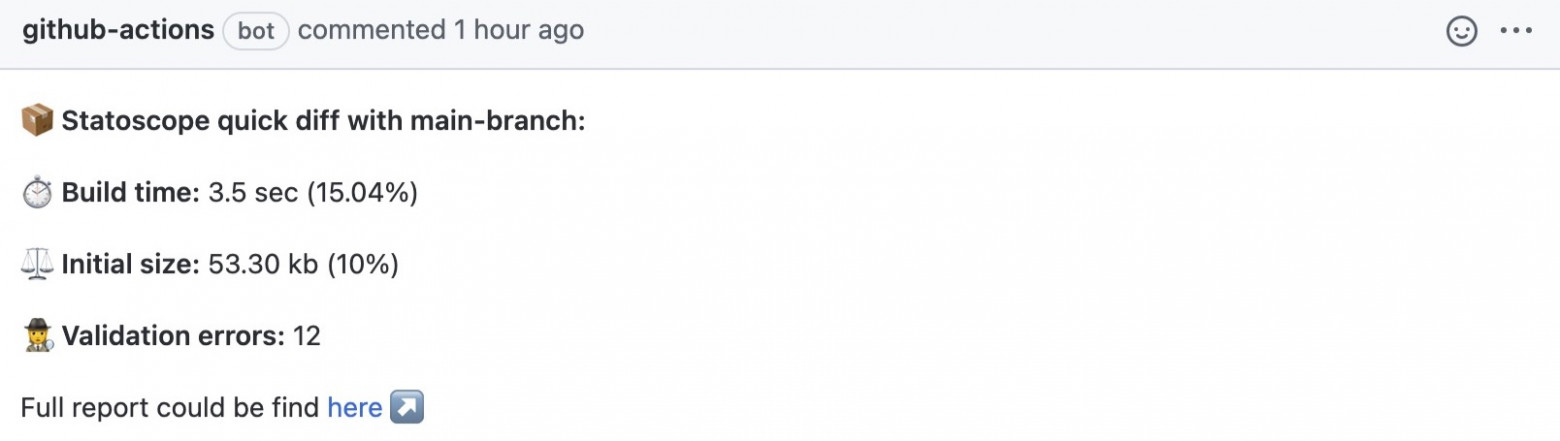
With those two outputs, you can generate a bot comment on the pull request. A Jora query can, for example, compare build time and initial bundle size between the reference and input stats, reporting the delta. It can also dump the number of validation errors as JSON.
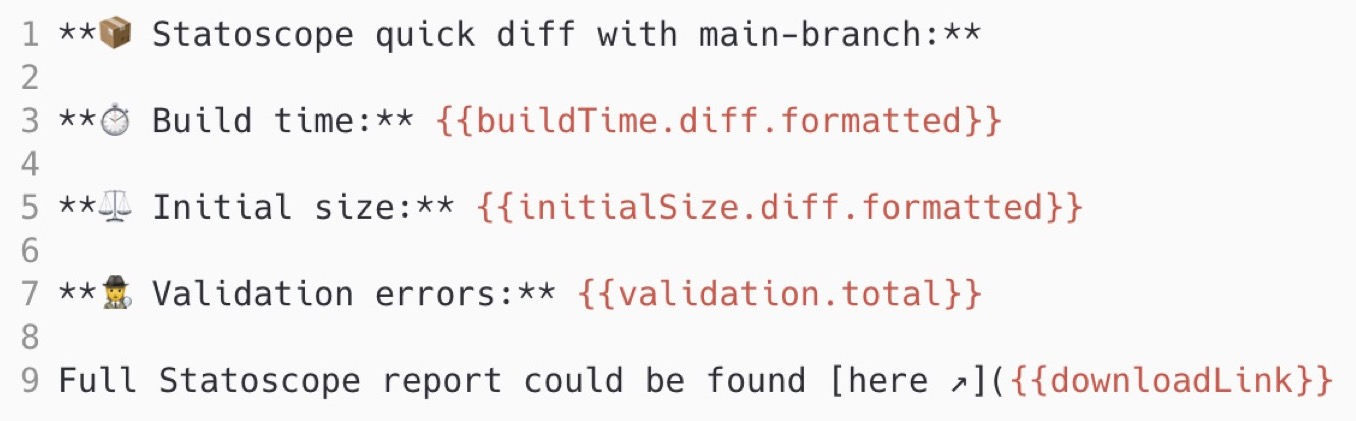
The comment itself is assembled from a template — the example below shows a minimal one — rendering the query results and linking to the full report.
Note: Moustache is only one option for templating; any template engine works.
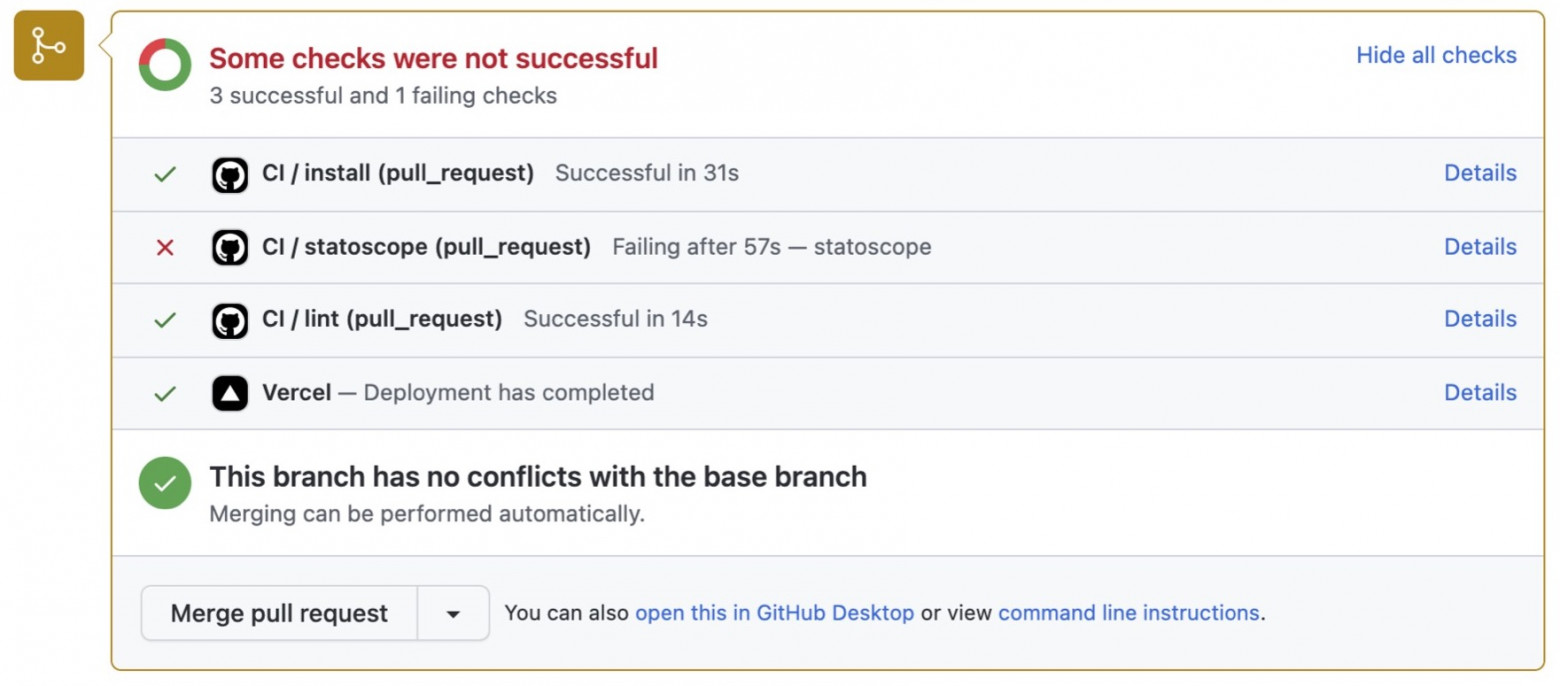
This entire flow runs as a separate CI check alongside your regular code checks. If validation fails, the Statoscope check shows a red cross. To find out why, follow the link in the generated report.
The full GitHub Action implementation — including templates and Jora queries — lives in the statoscope.tech repository. It is actively used: every pull request to that repo gets a report. The workflow files contain the complete source code, so you can see exactly how the pieces fit together.
Project Direction
Several larger efforts are underway for Statoscope, all aimed at making it bundler-agnostic and more extensible:
- Custom
statsformat: Convert all bundler outputs into one universal format to decouple Statoscope from any single bundler. - UI extensibility: Support plugins so the interface can be customized and extended.
- Other bundler support: Remove references to webpack from Statoscope's core, moving them into plugins.
- Simpler setup: Publish a pre-built GitHub Action so you can install it instead of copying workflow source code.
- Unified documentation portal: Consolidate package-specific readmes into a single, well-organized site similar to Jest's.
remplsupport: Bring Statoscope into the browser's developer tools during watch-mode development, eliminating the need for constant report generation.- Config analysis: Offer real-time advice on effective webpack configuration changes.
- Optimization recommendations: Suggest specific actions to reduce bundle size, down to expected savings in megabytes.
- Redesign: A new UI is in Figma prototypes, courtesy of Danila Avdoshin.
- Bundle rating: A personal goal to compare bundle quality — how efficiently the configuration uses webpack's capabilities.
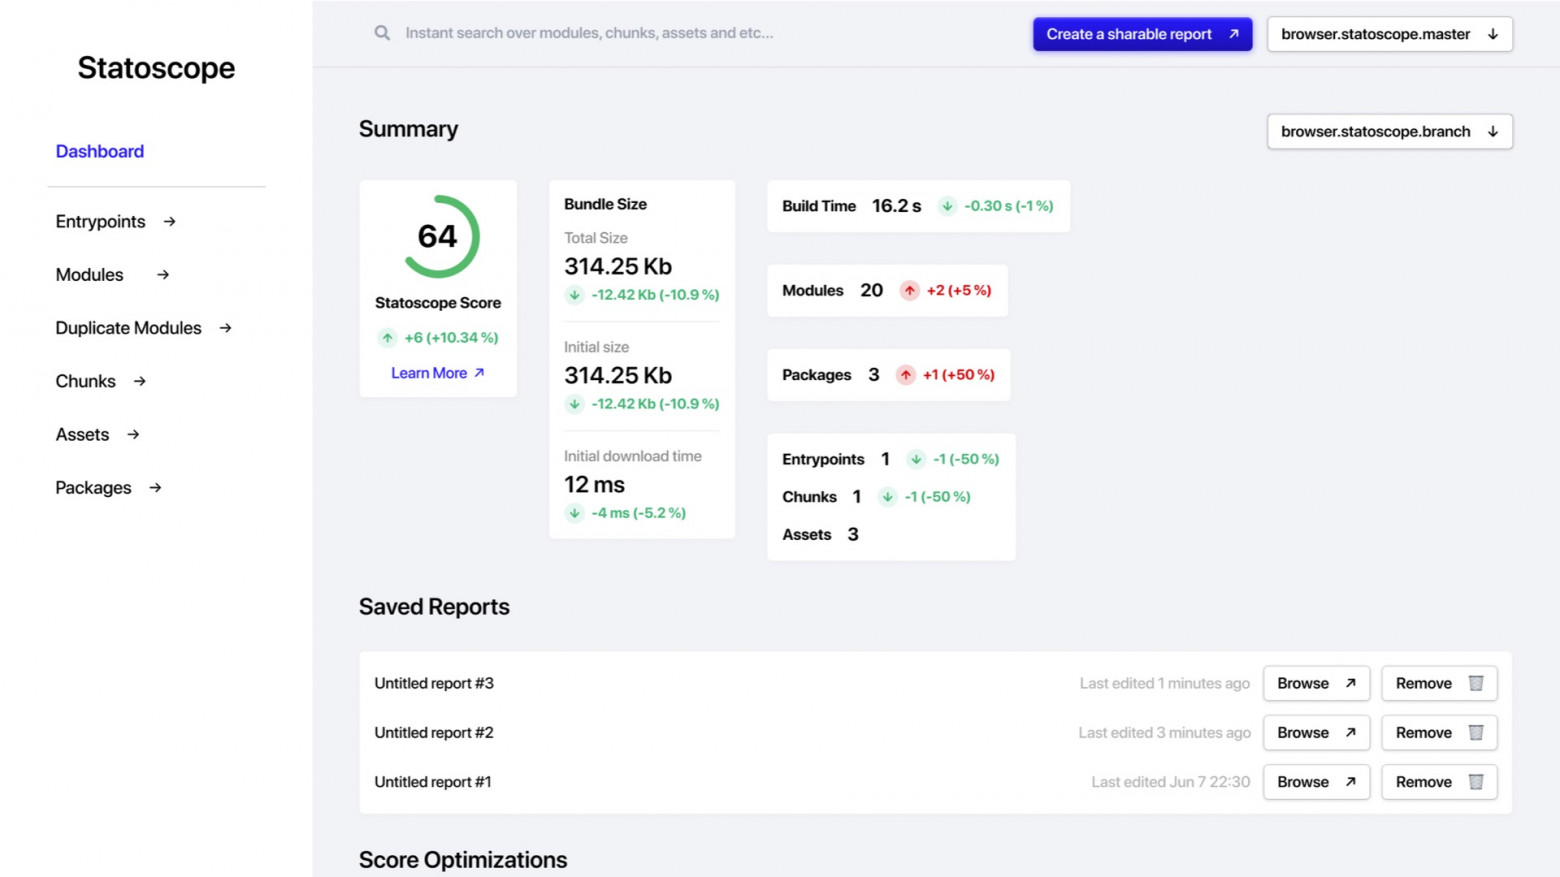
Statoscope is open source, so issues and pull requests are welcome. The project maintains active issue responses, and contributors can pitch in on any of the above workstreams. The planned flexible UI would let you choose which blocks appear on a page, so you could, for instance, swap out a module list for a chart.
Getting Involved
To start using Statoscope today:
- Try the
statoscope.techsandbox, which includes demo data. - Add
@statoscope/webpack-pluginto your project — it collects more data than webpack's default stats. - Use
@statoscope/clifor validation, queries, and automated comments. - Learn Jora for writing reports and rules.
- Explore Discovery.js.
Statoscope is also integrated into Andrei Sitnik's size-limit package. Running size-limit with the --why flag now opens Statoscope to explain size increases. Feedback and questions are welcome via issues, and stars on the GitHub repository are appreciated.



