
August was a difficult month for availability. We published a separate blog post covering the incidents in detail, and we continue to invest in architectural improvements and the move to Azure for additional capacity. Platform growth continues at the same time. We try to prioritize the highest-impact work while keeping risk low, though as August showed, risk cannot be eliminated entirely.
Incidents ultimately reshape priorities. As repair items, we improved capacity monitoring and management, corrected retry policies that had amplified impact, and hardened core services. Durable work streams also advanced.
Migration and capacity progress
On August 11, GitHub ran a production MySQL primary from Azure for the first time. Client-observed write impact stayed minimal, and customers saw no impact during the transition. We repeated the pattern with two additional primaries on August 27, with more scheduled over the coming weeks at increasing complexity as we learn from each failover. Read traffic hit new highs: migrated services peaked at 60.4% of reads from Azure, the monolith at 64.3%, and Git reads at 54%.
The 24-table authentication-core cohort moved off mysql1, GitHub's oldest shared database, removing roughly one million queries per second from its replicas. Query-hygiene work removed another 120,000 queries per second and eliminated approximately 59,000 seconds of wasted database work per hour.
GitHub Actions picked up capacity while longer-term isolation work continues. Job-routing changes shifted 33% of jobs from a constrained production cluster onto spare capacity, cutting peak cache CPU utilization from 98% to 80% and adding an estimated three months of headroom — a near-term containment measure rather than a permanent fix. Pull request isolation advanced as well: authenticated reads for the first production cohort now reach 100%, joining unauthenticated traffic that was already served.
Git overload protection handled 6.4% more traffic while improving 95th-percentile duration by 24% and maximum delay by 78%. Broader edge load-shedding protections also progressed, providing levers that were actually used to mitigate August's incidents.
Monitoring and telemetry improved on several fronts: pull request monitoring now tracks merge, review, and comment failures independently so high read volume cannot mask a failing write path; automated high-impact incident detection began combining customer-support signals with service telemetry on August 21; and API monitoring was recalibrated and validated over 30 days, reducing noise and improving signal quality.
The coming month's work covers the next database primaries, further service and traffic migration to Azure, more attention to shared-database health, additional automation for capacity management and auto-scaling, and wider dependency-failure handling across the pull request experience. The guiding principle is unchanged: availability, then capacity, then features.
Incident: August 06 15:22 UTC (10 hours and 42 minutes)
What happened
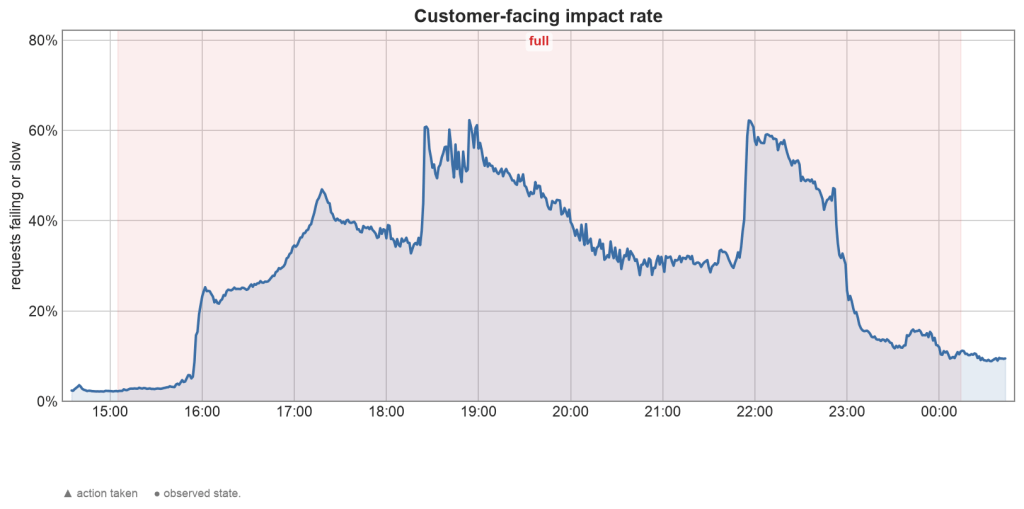
A routine deployment to an internal GitHub Actions service that converts incoming events into jobs triggered the failure. The deployment's contents were not responsible — rolling it back confirmed this — but replacing pods during the rollout briefly reduced capacity in one site and pushed the remaining sites beyond their limit as traffic shifted. A large share of workflow runs failed to start or complete during the middle hours of the incident.
Cause
The affected actions services were running near their capacity and concurrency limits, so a deployment that momentarily lowered the pod count was enough to exhaust headroom. Service mesh sidecars suffered CPU throttling and out-of-memory restarts, which cascaded into cache, DNS, and API errors across several clusters. The ingress service mesh had little headroom of its own and could not absorb the temporary capacity loss. As core services recovered, a latent bug in the job-assignment path slowed things further: runners received already-revoked jobs and got stuck retrying them instead of taking valid work, creating a self-amplifying backlog.
Response
- A routine deployment to an internal actions service briefly cut running capacity in one data center; within minutes the service mesh and remaining pods saturated.
- Failures cascaded across clusters as cache, DNS, and API errors spread and actions infrastructure failures rose. We declared a public incident, identified the triggering deployment, and rolled it back to confirm its contents were not at fault.
- Over roughly two hours we added capacity for the saturated services and throttled incoming webhook-triggered work to let the system stabilize.
- With core services recovering, a large queued-job backlog remained, and a latent bug assigned runners jobs that were no longer valid, leaving them stuck retrying and holding back real work.
- Fixes stopped runners from acquiring invalid jobs, we drained the queues, and we raised the internal rate limits that were slowing recovery. Workflow success rates returned toward normal.
- System-wide queues drained and actions returned to normal operation. A smaller set of self-hosted runners stayed stuck and were recovered manually, and some events from during the incident could not be replayed automatically and had to be re-triggered.
Follow-up work
- Add headroom and enable autoscaling for the service mesh ingress and affected actions services so routine deployments cannot tip them into saturation.
- Make deployments safer by avoiding capacity reductions during rollout.
- Strengthen monitoring for the saturation and database-proxy conditions that preceded the incident.
- Improve load shedding and backlog draining during large actions incidents, and stop runners from getting stuck retrying invalid jobs.
- Ship automatic recovery for self-hosted Actions Runner Controller runners affected by this failure mode in upcoming runner and ARC releases.
Incident: August 17 13:40 UTC (7 hours and 35 minutes)
What happened
Cause
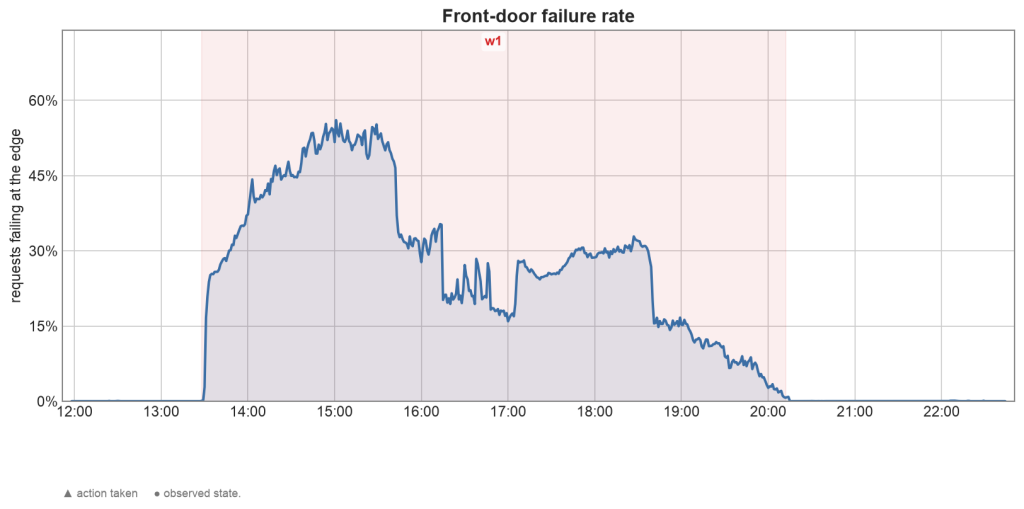
A new traffic peak pushed one datacenter's load balancers past their limits, and a service-mesh sidecar hit its concurrency limit without scaling up. As requests backed up, several load-balancer nodes in the datacenter exhausted their network flow limits, degrading the shared gateway authentication path and causing widespread authentication latency and failures across the many services routed through that datacenter. A latent client retry bug sharply amplified traffic to one internal authentication endpoint, which slowed recovery for the Copilot Token Service. The core weakness combined a service-mesh sidecar that failed to scale up, retry behavior, and clients that were not bound tightly enough to stop a partial degradation from amplifying into a broader overload.
Response
- A new traffic peak pushes a datacenter's load balancers toward their limits; a service-mesh sidecar hits its concurrency limit and does not scale up.
- The overload cascades: several load-balancer nodes exhaust their network flow limits and the shared authentication path degrades, while issues, pull requests, the APIs, actions, Copilot, and other services return errors and slow responses.
- Automated monitoring detects elevated errors, an incident is opened, affected products are marked degraded on the public status page, and engineers from the affected services converge.
- Engineers trace the failure to network saturation on the load balancers in a single datacenter and start shifting some traffic to another datacenter and reducing gateway retries to relieve pressure.
- The team stops the load-balancer processes on the saturated nodes and blocks the retry-triggering requests to the most-affected internal endpoint, producing broad and immediate recovery.
- Remaining authentication errors caused by client retry amplification are stabilized by ramping traffic back up gradually; after a sustained period of healthy telemetry the incident is resolved.
Follow-up work
- Correct autoscaling policies to account for service-mesh sidecar concurrency and capacity, not just the host service.
- Audit request, concurrency, and scaling limits for the service mesh across affected services.
- Review retry and backoff limits across gateways and clients so partial degradation cannot amplify into broader overload.
- Fix the client retry behavior that amplified authentication traffic.
- Improve load-balancer capacity monitoring and strengthen regional failover safeguards.
Incident: August 20 14:43 UTC (9 hours and 54 minutes)
What happened
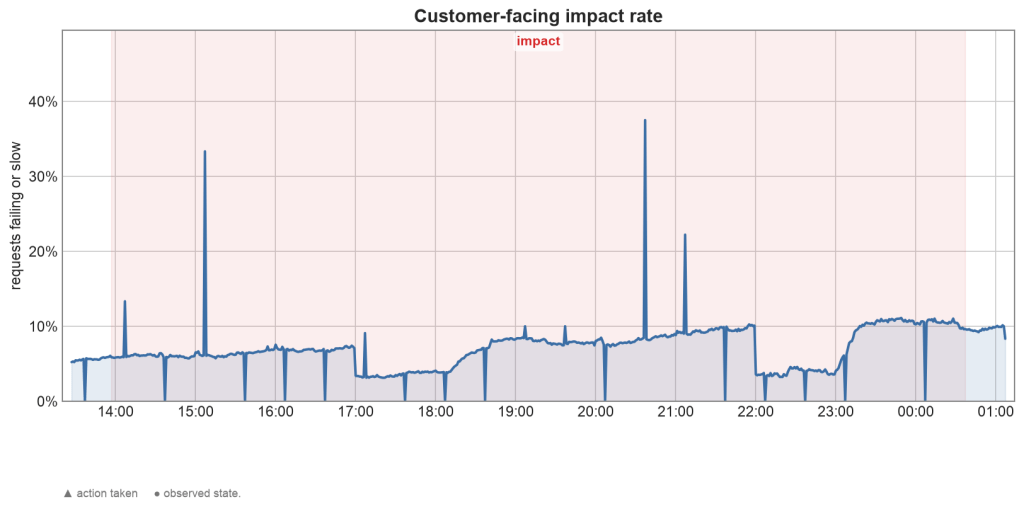
The Copilot cloud agent task was affected during the incident window, but the tasks themselves ran to completion, so no work was lost. Once processing caught up, the correct status and results appeared — waiting a short time or checking back later would have shown the current state. At least 54 organizations saw Copilot Cloud Agent task status and results lag well above their normal level, and per-minute customer-facing impact peaked at 37.5% of measured task-status activity.
Cause
Copilot cloud agent stores each task's status and results in a managed cloud database. One region of that database suffered a provider-side outage, so calls reading and writing task status in that region began failing and running slow. The processors streaming task-status updates into the database fell behind as latency climbed, because their throughput is bounded by a fixed number of processing partitions sized for normal latency plus headroom. The latency went well past that headroom, so the backlog grew instead of clearing. A storage configuration on the database also made the affected region slow to fail over, so the first failover attempts did not take effect and recovery took longer than expected.
Response
- A region of the managed cloud database storing Copilot cloud agent task status began failing and running slow after a provider-side regional outage.
- On-call engineers were paged, opened an incident, and traced the errors to the affected database region.
- Engineers began a regional failover, but it did not take effect — a storage configuration made the region slow to move — so task-status updates kept backing up.
- The team forced the affected region offline and shifted task-status processing to a healthy region; write latency stayed elevated and the backlog kept the status view delayed.
- Additional streaming capacity was added and the provider's region gradually recovered, letting the processors work through the backlog so task status and results caught up.
- Latency returned to normal, the backlog cleared, and the incident was mitigated and resolved.
Follow-up work
- Remove the database storage configuration that made the affected region slow to fail over, so a single region's problems can be exited quickly.
- Improve runbooks for regional failover of this database, including a vetted, ordered list of fallback regions that keep the service healthy.
- Review failover priority so the next region chosen is the next-best healthy option.
- Make task-status streaming more resilient to elevated database latency so a latency spike does not immediately throttle throughput and build a backlog.
- Improve monitoring and escalation on the managed databases.
August 26: Actions runs fail and queue as a shared database saturates (2 hours 50 minutes)
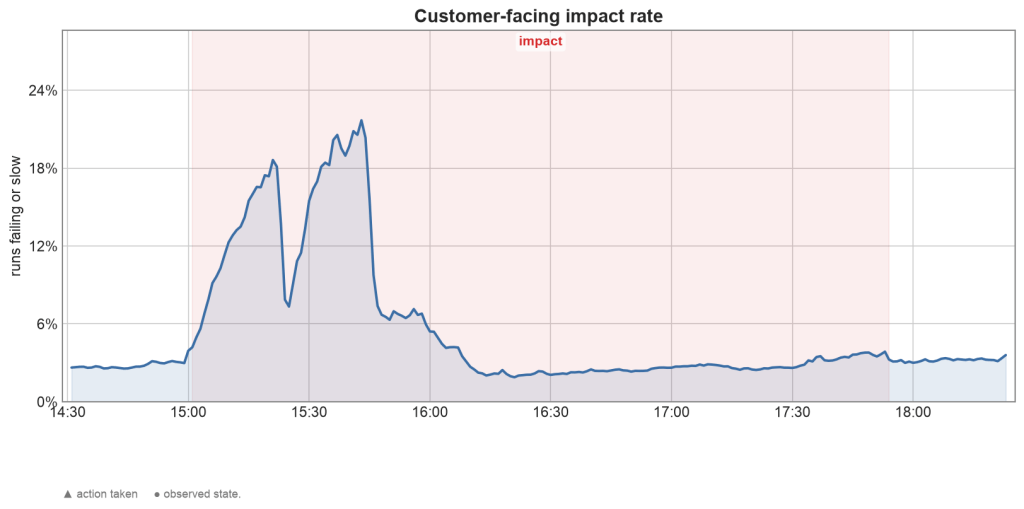
Copilot code review and some GitHub Pages deployments that run on top of actions were affected during the window. Delayed runs generally started after the backlog drained, and runs that failed to start succeeded when re-run afterwards. A small set of runs created in the earliest part of the incident could not be recovered that way and had to be started fresh.
Cause
Shared infrastructure services have not kept up with month-over-month actions growth and peak load. A burst of events arrived on top of an already-high load and pushed the database past its tipping point: query times climbed and the database primary saturated. The internal service that converts incoming events into runner assignments could not keep up, so runs failed to start and queued well past their normal start time.
The primary failover helped only partially. Throttles applied to relieve inbound load were initially set slightly too high to fully protect the database, so recovery had to be ramped up slowly and manually. No automatic circuit breaker existed to throttle inbound actions load when the database showed early signs of stress, leaving the protective throttling to be applied and tuned by hand during the incident — one of the learnings from it.
Response
- A burst of events landed during a daily traffic peak while a shared database used by actions was already near its limit; write and query pressure on the primary rose sharply.
- The event-to-runner-assignment service fell behind, runs began failing, and investigation started.
- The database primary was failed over to a replica, which improved things briefly but did not fully mitigate; runs continued to fail or start late.
- Inbound event processing was throttled to let the database recover. Core service health returned once throttling and service restarts took effect, with inbound work now intentionally slowed.
- Throttles were raised gradually with telemetry checked at each step to avoid re-overwhelming the database, until full event processing was restored and the delayed work drained; the incident was marked mitigated.
- A subset of jobs on larger and self-hosted runners stayed stuck waiting for a runner. A change was deployed to release them, and follow-up work continued to clear runs left showing as queued.
Follow-up work
- Improve query efficiency of database usage by optimizing specific code paths in the client code.
- Add an automatic circuit breaker that throttles inbound actions load when the database shows signs of stress, rather than relying on manual throttling.
- Add protections around how often the service falls back to the database primary when a replica is lagging, so a fallback cannot compound database pressure.
- Improve the ability to quickly cancel or clear runs stuck in a queued or waiting-for-runner state after an incident.
- Continue the scaling and resiliency work already in flight for this part of actions, including changes completing and rolling out around the time of the incident.
August 27: Upstream degradation breaks a share of Kimi K3 requests (2 hours 8 minutes)
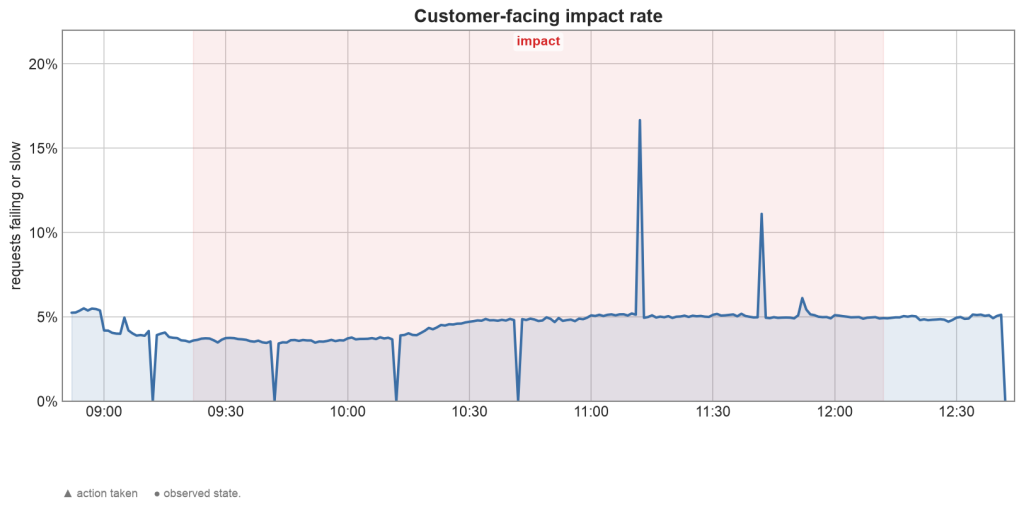
Only customers configured to use the Kimi K3 model were impacted; those on other models, or who switched to one, were not. Kimi K3 is served by an upstream model provider, and that provider had a serving degradation that made a large share of Kimi K3 requests fail with errors. Because the fault was upstream, requests using other models — including the Auto setting, which routed to a different model — were unaffected. A steady share of Kimi K3 requests kept failing until the provider's mitigation took hold; at peak, more than half were failing.
Response
- The upstream provider for Kimi K3 degraded, raising failure rates for Copilot requests routed to that model.
- Monitoring flagged the elevated errors within a few minutes and investigation began.
- An incident was declared, failures were traced to the provider degradation affecting Kimi K3, and a public status update pointing to the provider was posted.
- Requests on other models or the Auto setting kept working, so retrying or switching models would have succeeded.
- A ticket was opened with the provider and recovery was monitored as success rates climbed back toward normal on the dashboards.
- The incident stayed open until the provider confirmed Kimi K3 was fully restored, then was resolved.
Follow-up work
- Work with the upstream provider to improve the reliability of the Kimi K3 model and reduce the errors seen during this incident.
- Investigate backup serving capacity for Kimi K3 so a single provider degradation has a fallback.
Follow our status page for real-time updates on status changes and post-incident recaps. To learn more about what we're working on, check out the engineering section on the GitHub Blog.


