
Why sync performance needs its own test rig
Rewriting the Dropbox sync engine was a large distributed systems effort. Durability testing got heavy coverage; performance did not. To keep the new engine from shipping with regressions, the team built Apogee, a framework that measures latency, CPU, disk I/O, memory, and network I/O while existing end-to-end integration tests run. Tests wrap a span of sync operations in a context manager, and key-value annotations on the profile data allow slicing results by activity.
def performance_test(...):
  # Internally, this uses a timer for latency calculation and DTrace for counting
  # the performance metrics such as disk i/o, network i/o, syscalls etc.
  with apogee_profile():
    do_something()
    # `annotate` allows for adding attributions to the profile report generated
    # by `apogee_profile`. For example: annotate("num_files": 10000)
    annotate("key", "value")
Every new commit triggers performance integration tests via CI; more expensive tests run on a schedule. Apogee aggregates results through a pipeline of CI, an aggregation service, and InfluxDB with Grafana for visualization.
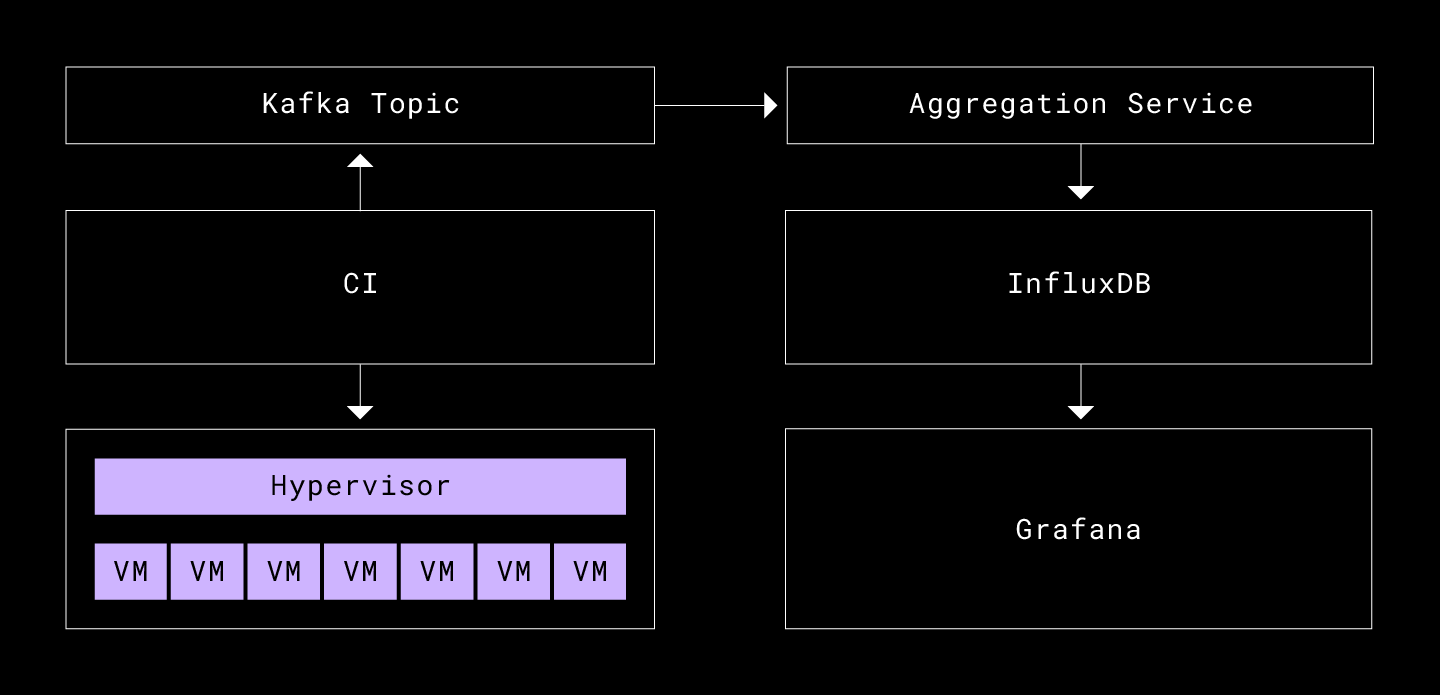
System components
CI
Custom test suites run on all new commits. Build results—including profile data and test logs—are published to a Kafka topic. The tests execute across a virtual machine pool managed by a hypervisor that schedules VMs with limited, shared resources such as memory, CPU, and network.
Aggregation service
A Kafka consumer tails the topic, pulls measurements from build artifacts, and adds fields not available at test time: build link, commit hash, author, and log links. It then writes each aggregated result to the time series database.
InfluxDB and Grafana
InfluxDB stores the time series data. Its protocol accepts alphanumeric fields such as latency, disk writes, and commit hash, keyed by tag-value pairs from the annotate() calls (for example, {"operation": "upload", "num_files": "1000, "size": "1024"}) and a build timestamp. Grafana's well-tested InfluxDB plugin handles visualization.
Driving down measurement variability
The core problem in building Apogee was noise. Repeated runs on identical code produced results too scattered to detect even large regressions. Before the framework could be trusted to compare commits, the team invested heavily in making measurements consistent.
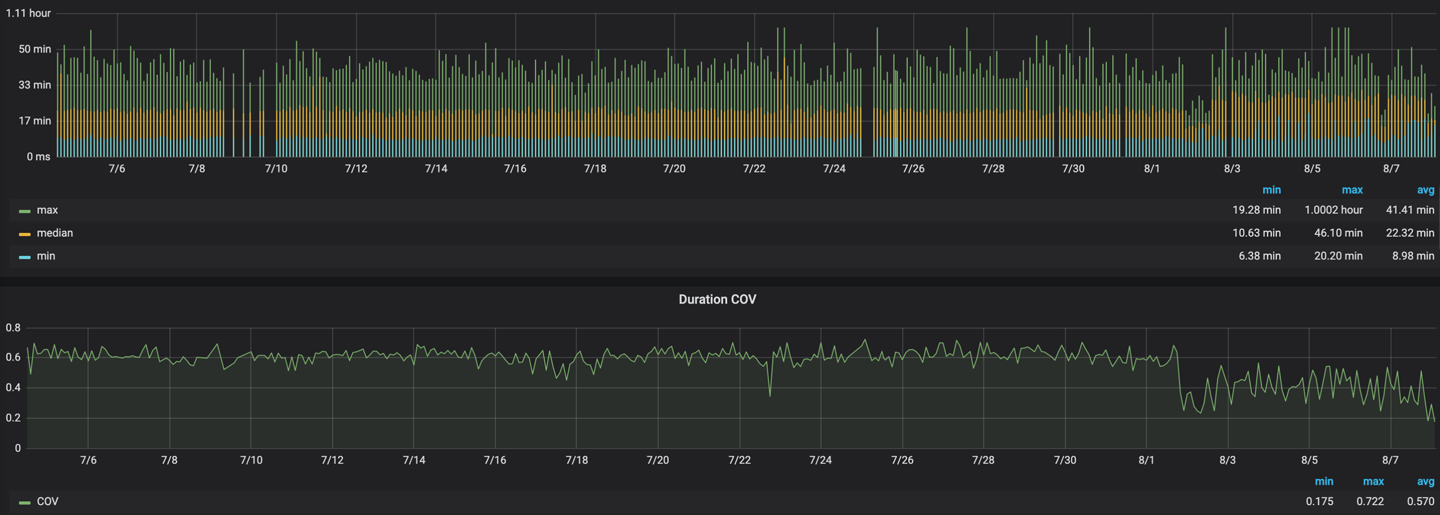
Sources of variance
Several factors made variability hard to control:
- Different tracing libraries per platform. DTrace was not available on Windows at the time (it is now).
- Mixed CI hardware: Mac VMs ran on racked MacPros, while Windows and Linux VMs ran on Dell blades.
- A fundamental tension between realistic user simulations and repeatable results.
- An explosion of variables: network versus spinning disk versus flash versus RAMDisk, network speed and noise, processor speed, cache size, interrupts, and de-scheduling.
- VMs versus bare metal. Dedicated performance labs commonly use bare metal.
- Testing against production versus development servers.
Guiding principles
- Don't be a panacea: solve the most important problem rather than every potential one.
- Repeatability wins: prefer artificial repeatability over real-world fidelity when forced to choose.
- Incremental change: hold as many variables constant as possible, and vary them only after gaining confidence.
Finding the variance
Early experiments ran the same sync tests repeatedly while profiling. Merged profiles highlighted code areas with the highest variability in wall time, network I/O, disk I/O, and memory. Duration was tackled first. Using the coefficient of variation for each metric, a t-test correlated their variability with duration. The team then addressed each highly correlated, highly variable area in descending order, forming hypotheses and testing interventions.
Application-layer fixes
Static sharding of tests. CI normally uses dynamic sharding to balance load across machines. Pinning fixed subsets of tests per run reduced cross-run variability.
Headless mode. The desktop UI—notifications, web view loads—proved surprisingly unpredictable and independent of the sync engine. Disabling it entirely was one of the biggest variability reductions.
Non-determinism. Server rate limiting, backoffs, and timeouts introduced randomness. Running against a stage server variant, which is usually under less load, reduced these effects. While a VM running all backend services was considered, it would lose network path coverage; the real server's variance was low enough.
Infrastructure fixes
Homogeneous VMs. The hypervisor originally shared resources to maximize throughput, causing unbalanced allocations and de-scheduling. Adjusting some knobs made control flow deterministic:
- Processor affinity and memory reservation: dedicated resources per VM, reducing contention and improving CPU cache performance.
- High latency sensitivity: tuned to minimize scheduling delay for low-latency needs.
- Disable clock sync: prevents VM time spent syncing clocks—and de-scheduling time—from counting toward test timing.
RAM disks. Client VMs sat on remote flash storage over the network, making disk I/O extremely variable. Bounding network resources between VMs was not enough. Swapping to RAM disks—a portion of physical memory mounted as a drive, with memory locking to prevent paging—kept all sync engine disk traffic on the VM host.
This reduced variability significantly and made sync faster, but it created a blind spot. Because f-sync was near-instantaneous, quadrupling the number of f-syncs would be invisible in the metrics, even though it would harm customers. Pathological access patterns on spinning disks or poor disk cache usage would likewise be missed. The tradeoff was accepted, helped by tracking disk I/O and sync latency separately: a disk regression would show up even if sync duration did not change.
Terminating background processes. After eliminating internal variance, the team instrumented all running processes in the VM. Dropbox scheduler preemptions and disk cache misses correlated with a small set of other processes. On MacOS, for example, Spotlight raced Dropbox to index newly added test files; out-of-phase behavior wrecked disk cache performance and raised disk I/O rates. Terminating such processes before tests brought a modest win. While this did matter for real Mac sync performance, Apogee's role is to catch regressions in Dropbox code, so environment fidelity was sacrificed for stability.
Measuring What Matters
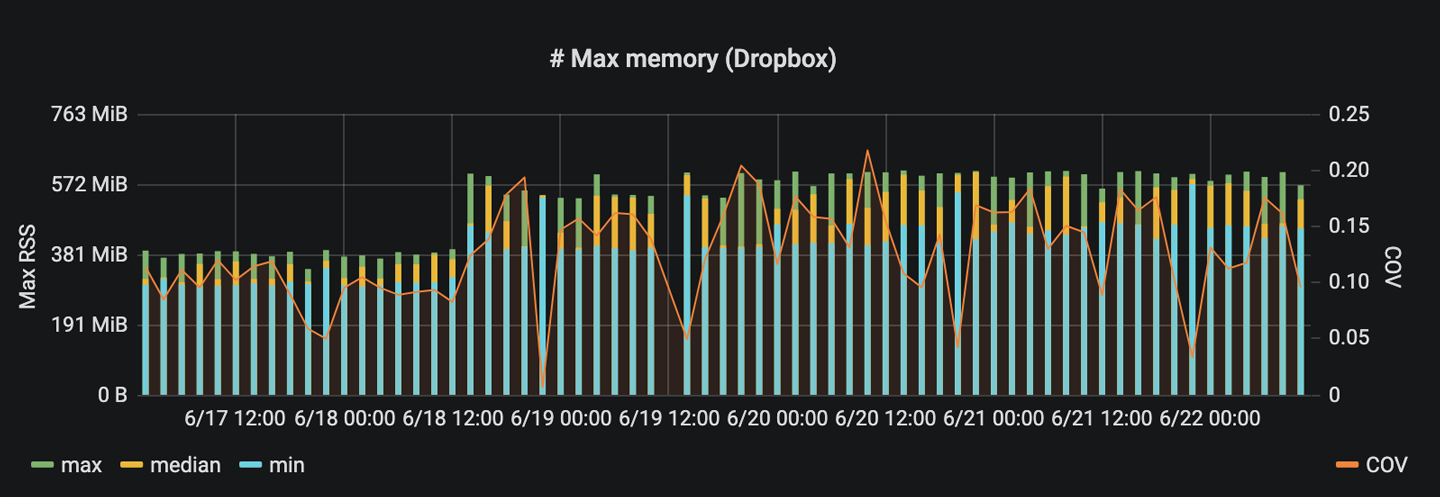
The combined changes cut worst-case test variability from 60% down to under 5% across the entire suite, which means a regression of 5% or larger can now be flagged with confidence. To sharpen alerting further, the team also rejects a single outlier from every five runs of a test before computing regression thresholds. Outliers still appear on the dashboards, however, because they often expose systemic problems or infrastructure faults that a clean average would hide.
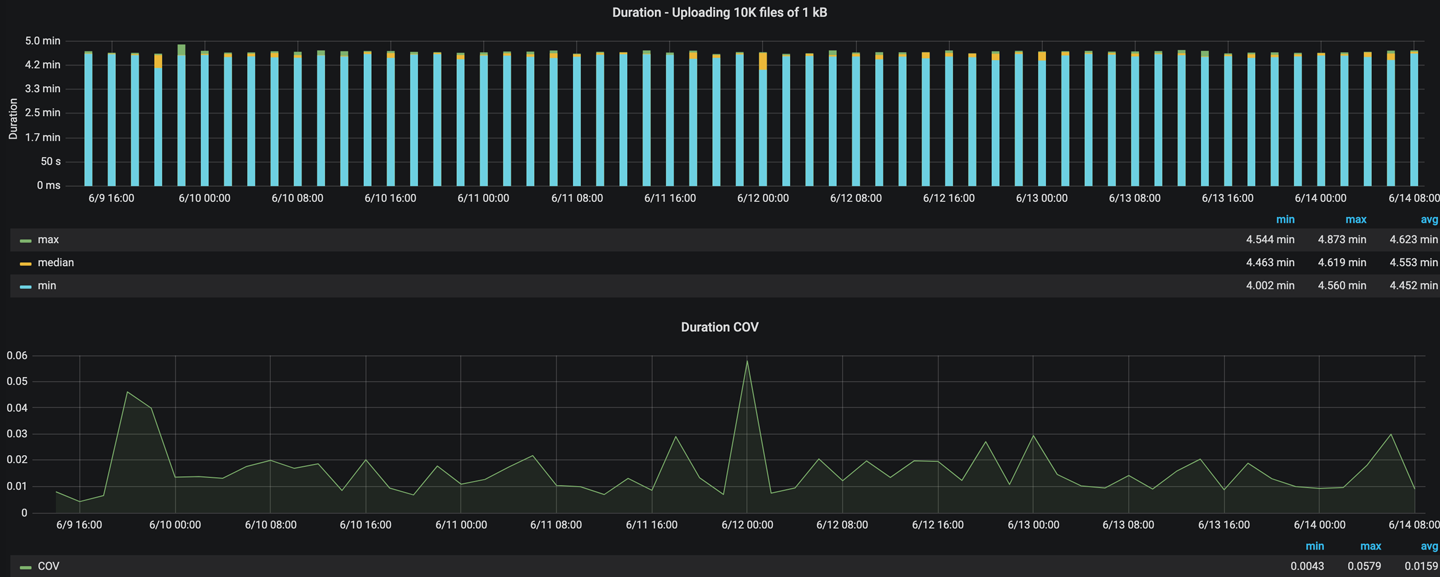
Regressions the System Caught
Automated detection earned its keep with several real-world failures that would otherwise have shipped to users:
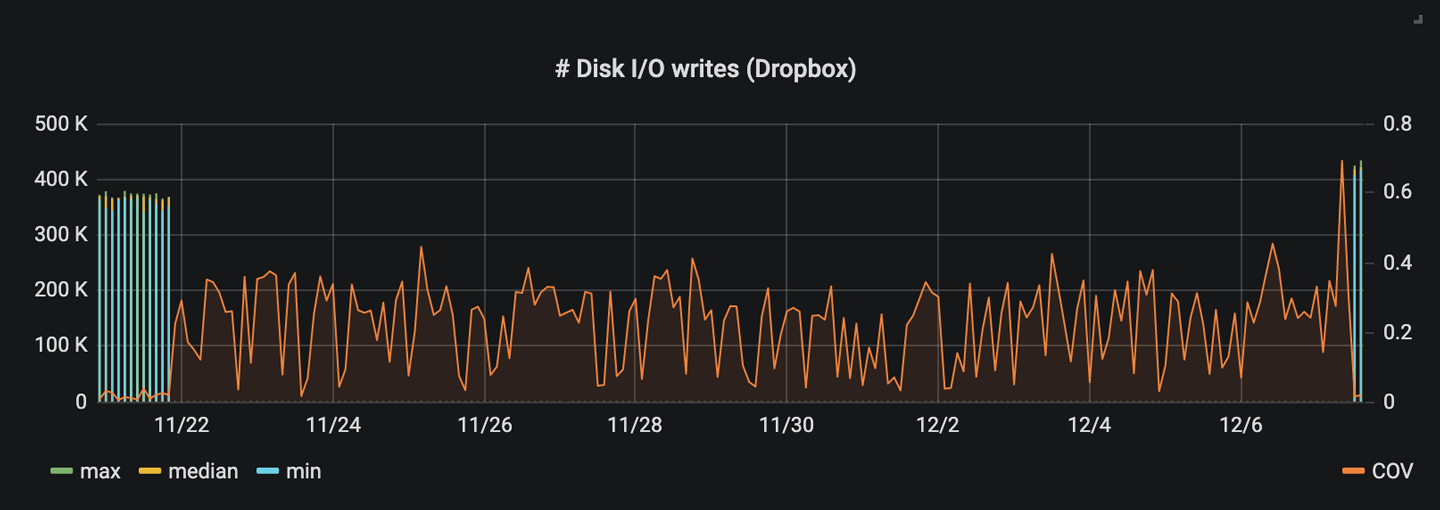
- Hash collisions from a weak hash scheme. A third-party hash map implementation internally used weak hashing, which caused correlated entries to land in the same buckets. Insertion and lookup cost degraded from constant time to linear time as a result.
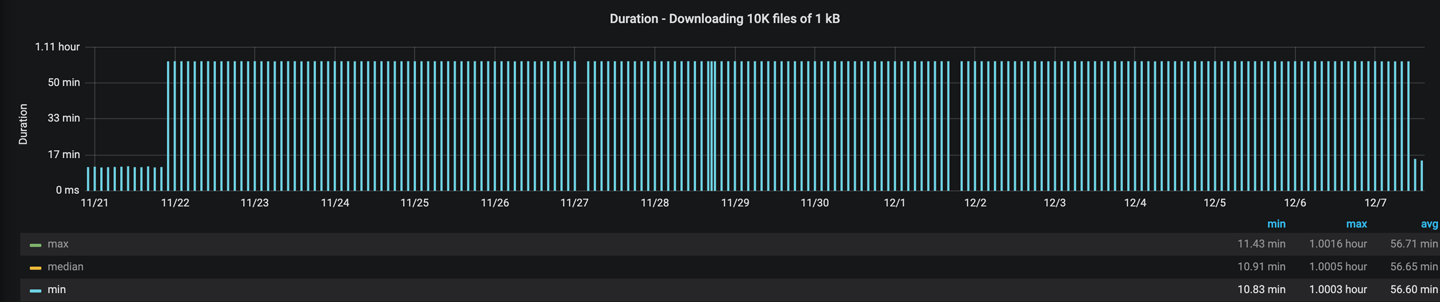
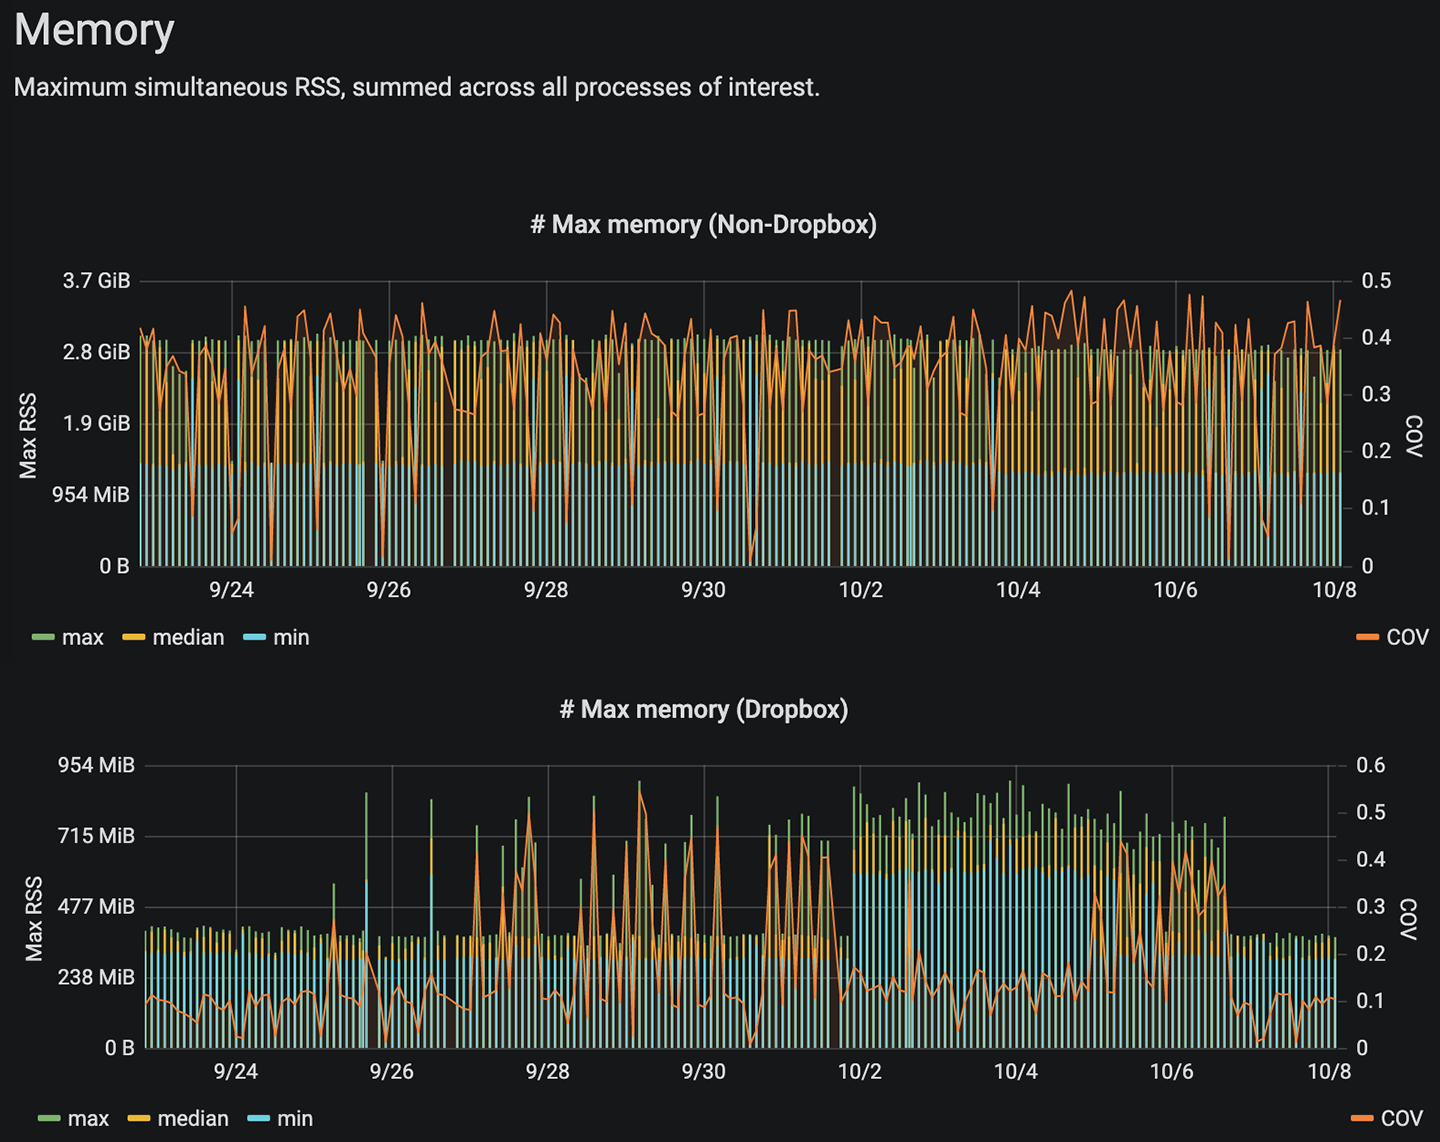
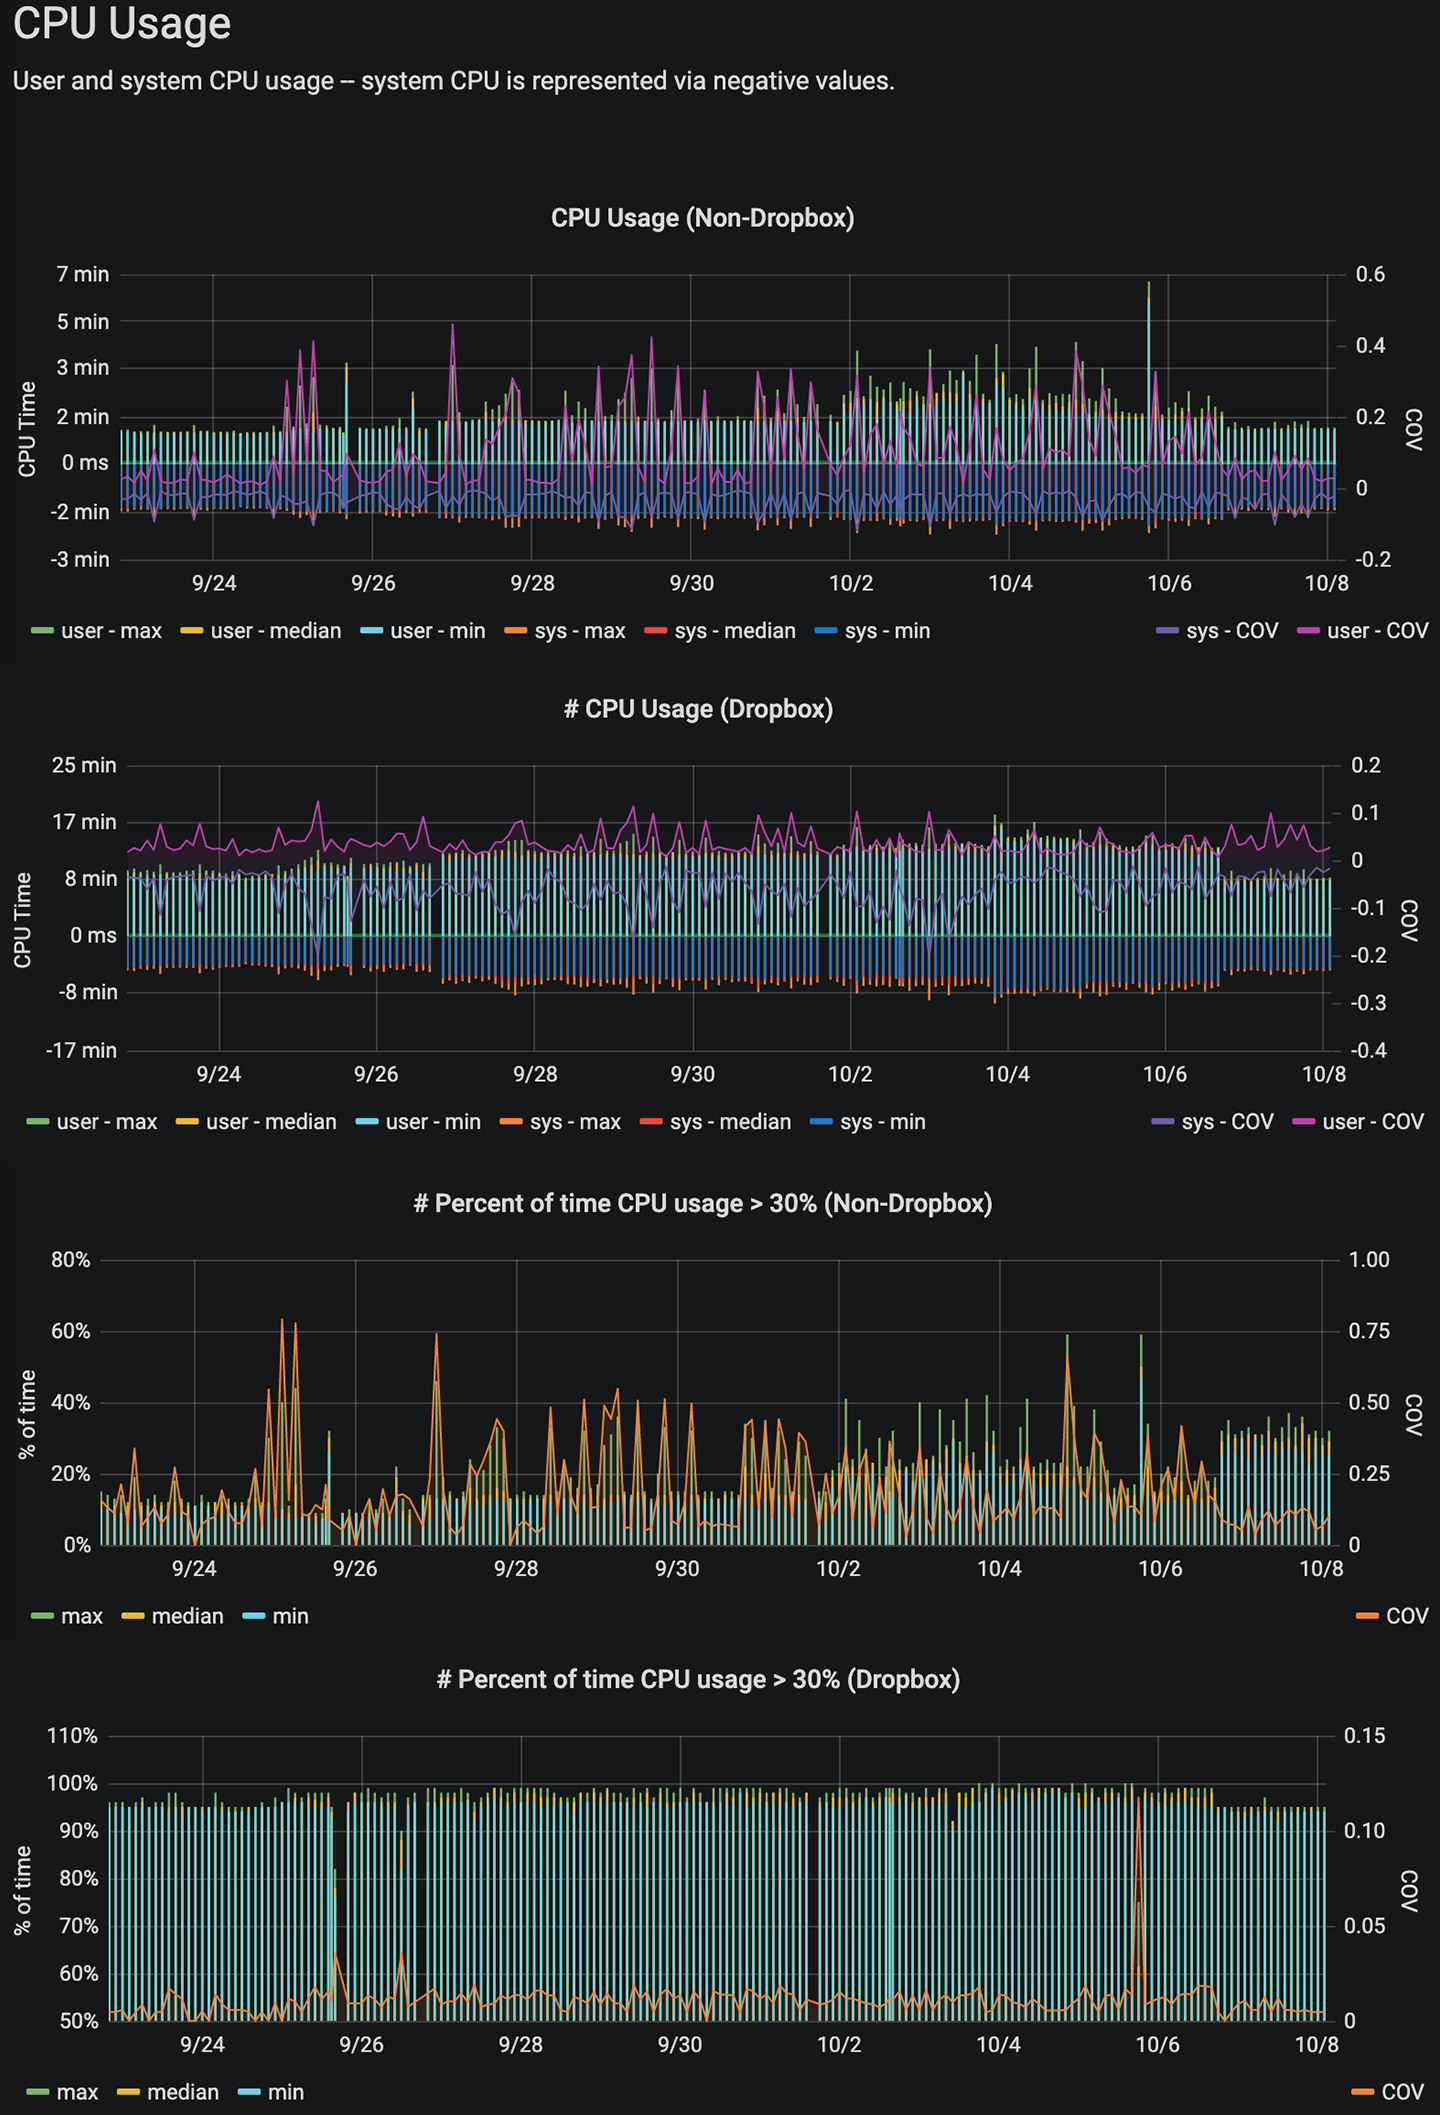
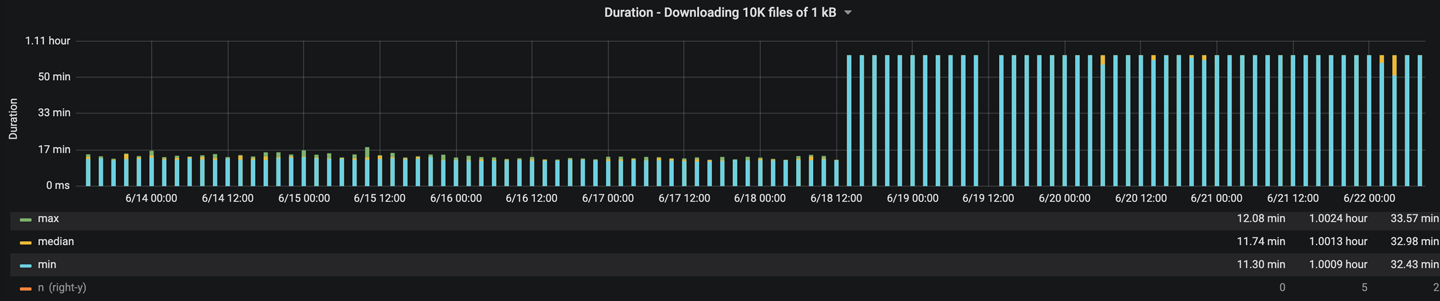
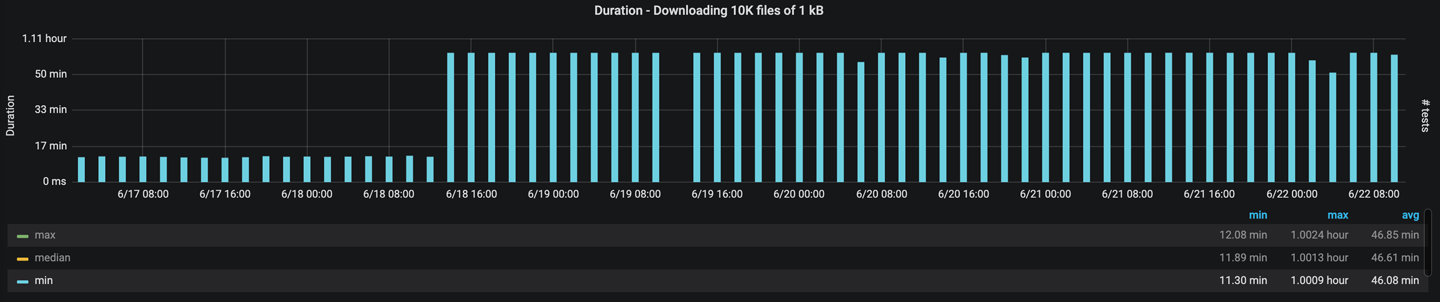
- Unbounded concurrency. One change introduced runaway parallelism that produced a roughly 50% regression in sync duration while also driving excessive memory and CPU consumption.

- Seeded iteration colliding with map resizing. A sequence of code iterated over a set seeded with an RNG and removed matching entries from a map seeded the same way. The pattern made removal inefficient and triggered collisions when the map resized, which led to high-latency lookups. The team evaluated resizing more efficiently or swapping in a better map type such as BTreeMap, and adopted the latter.
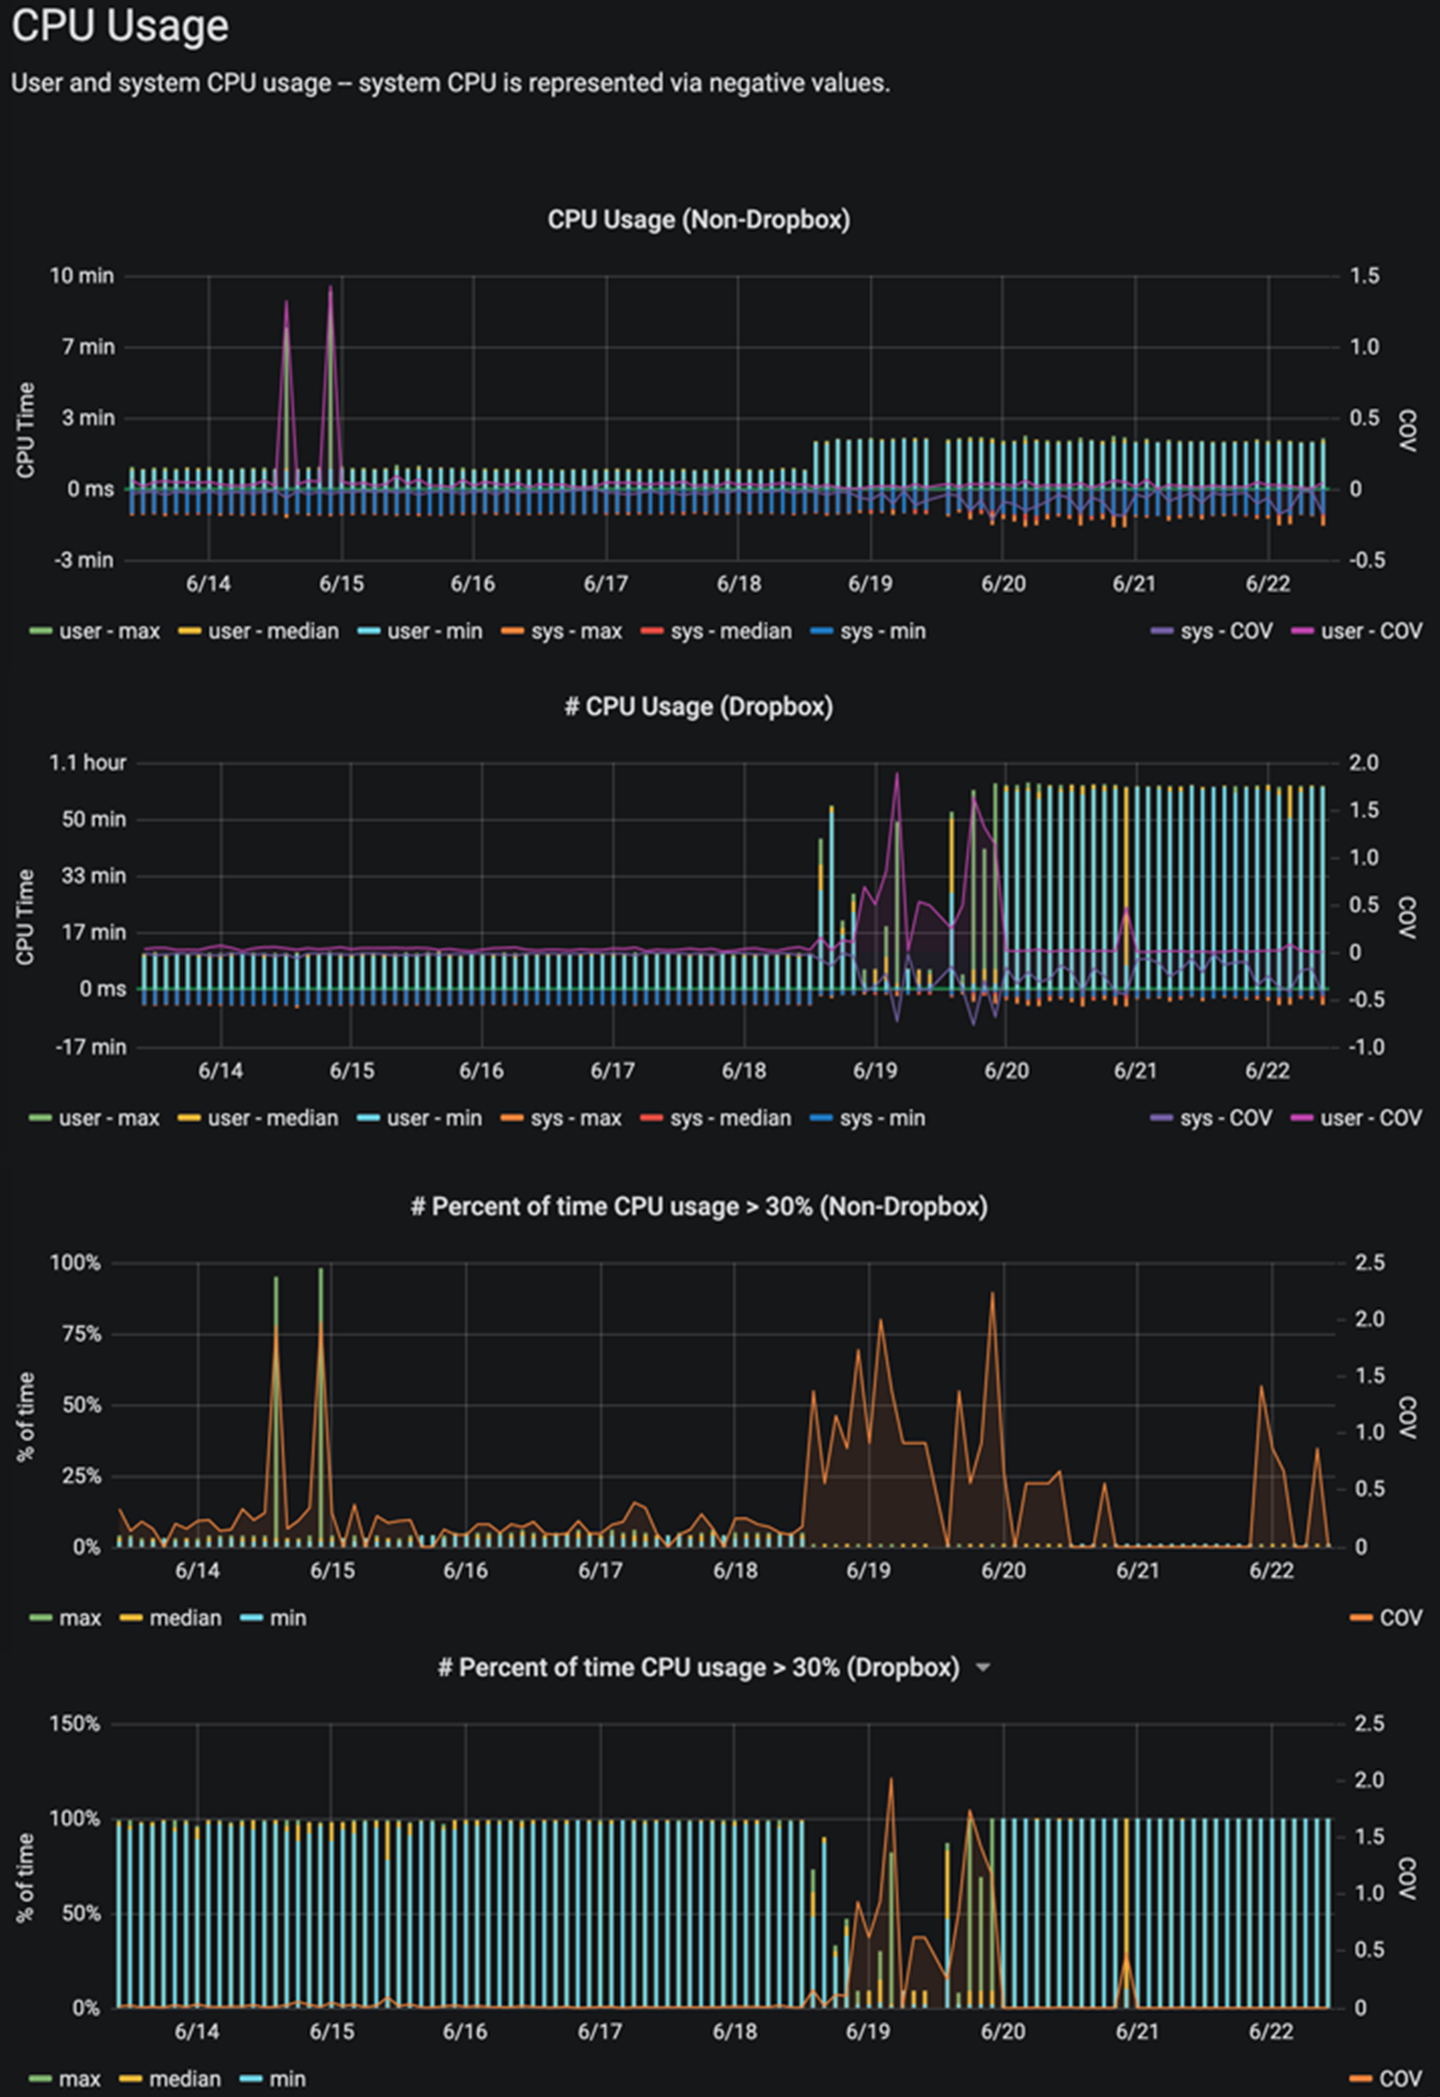
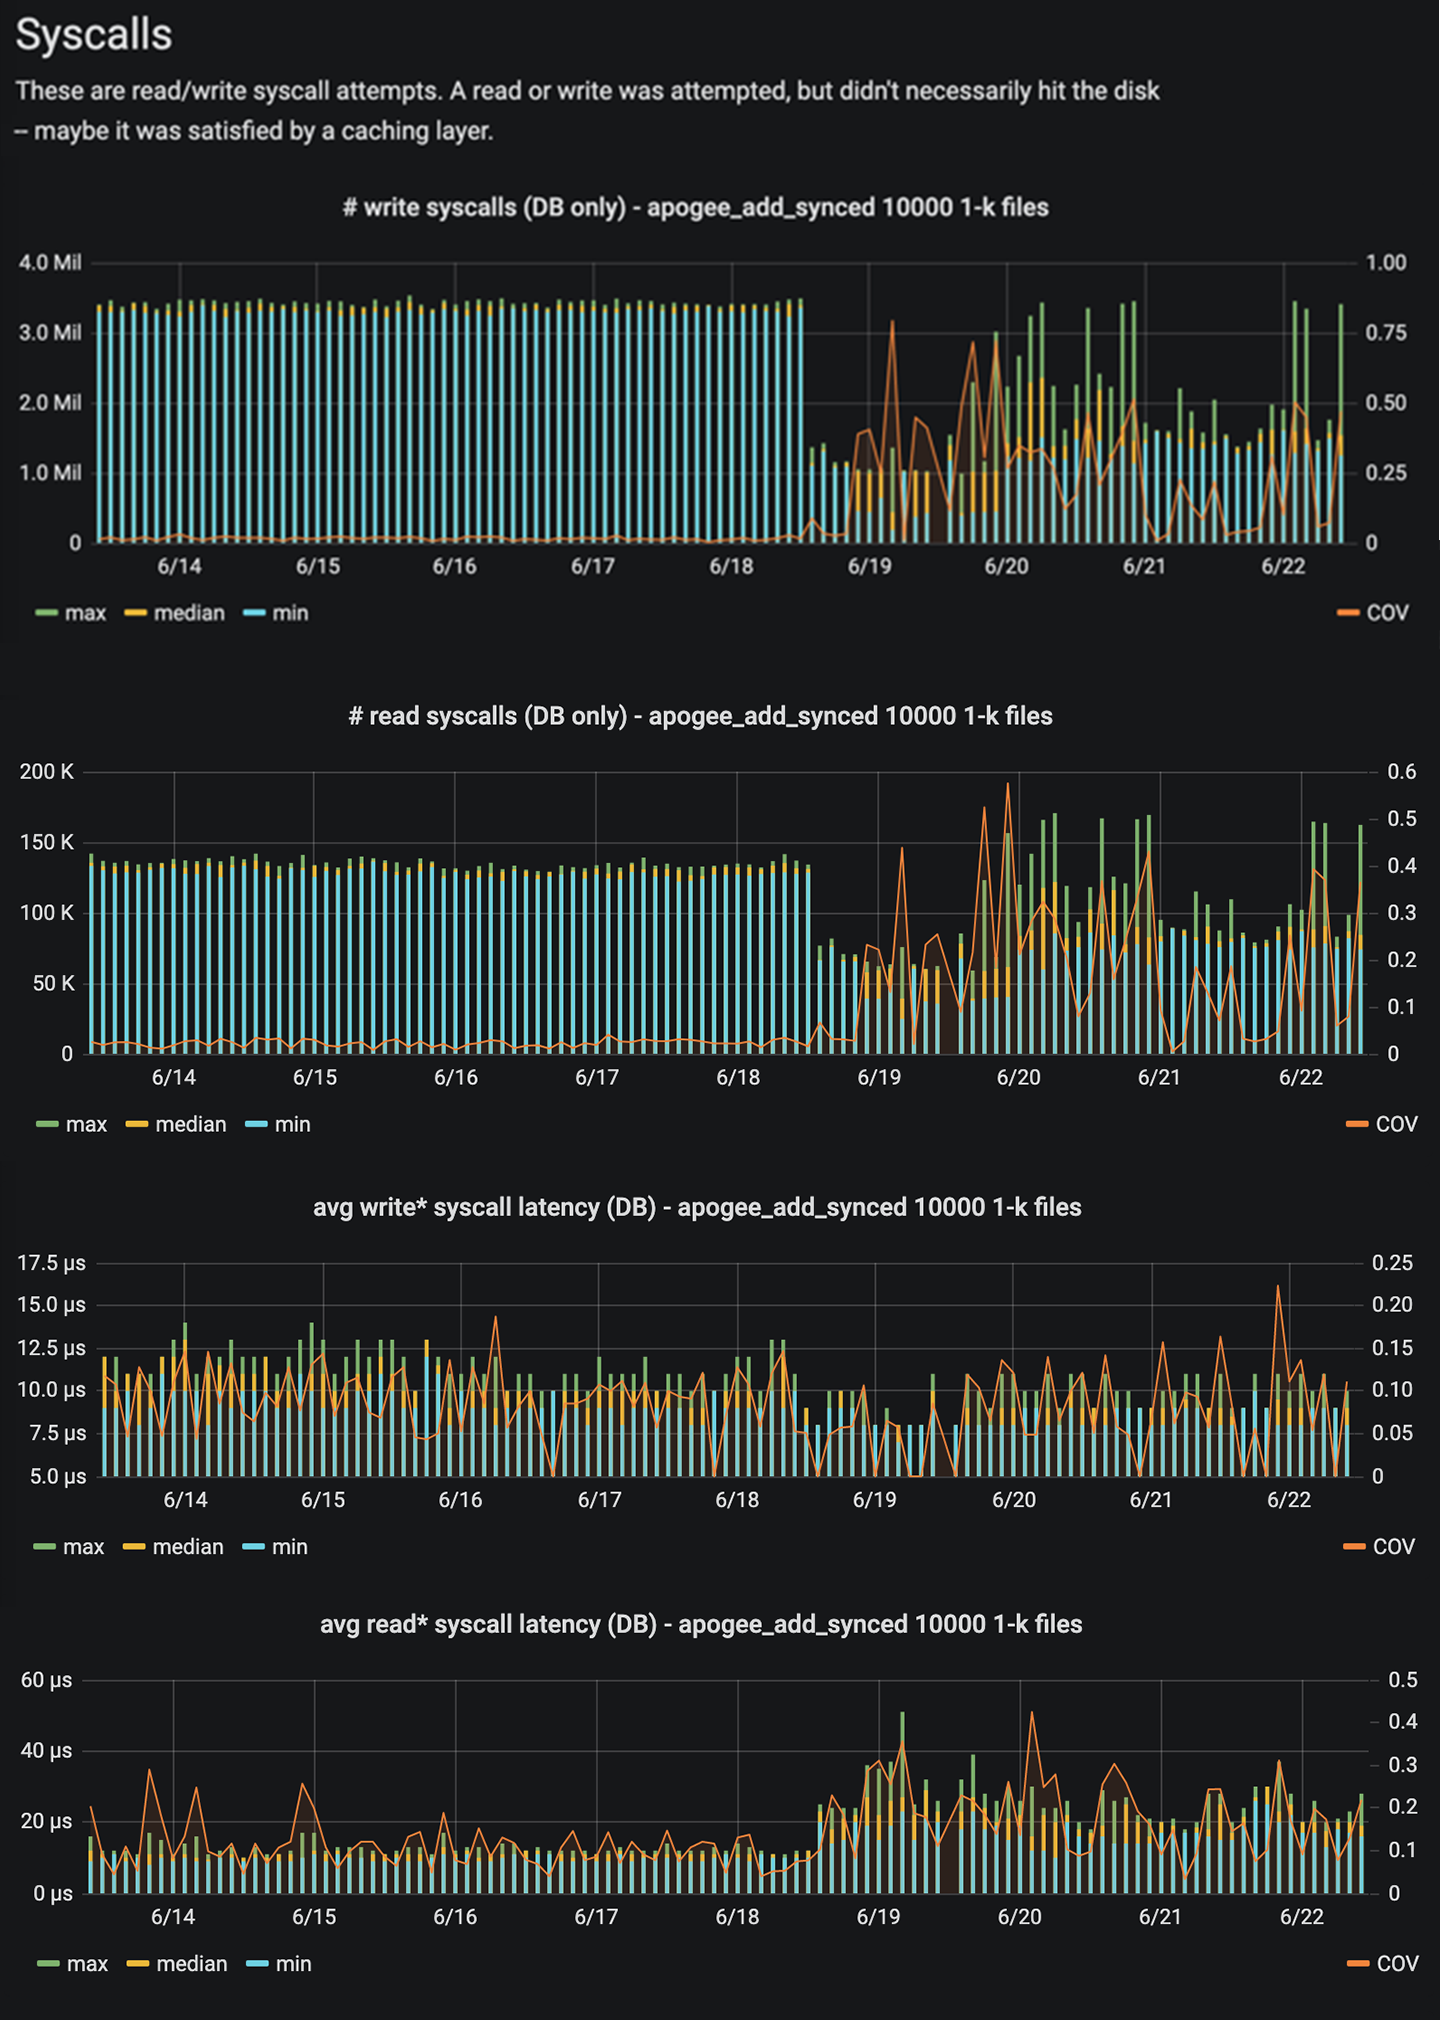
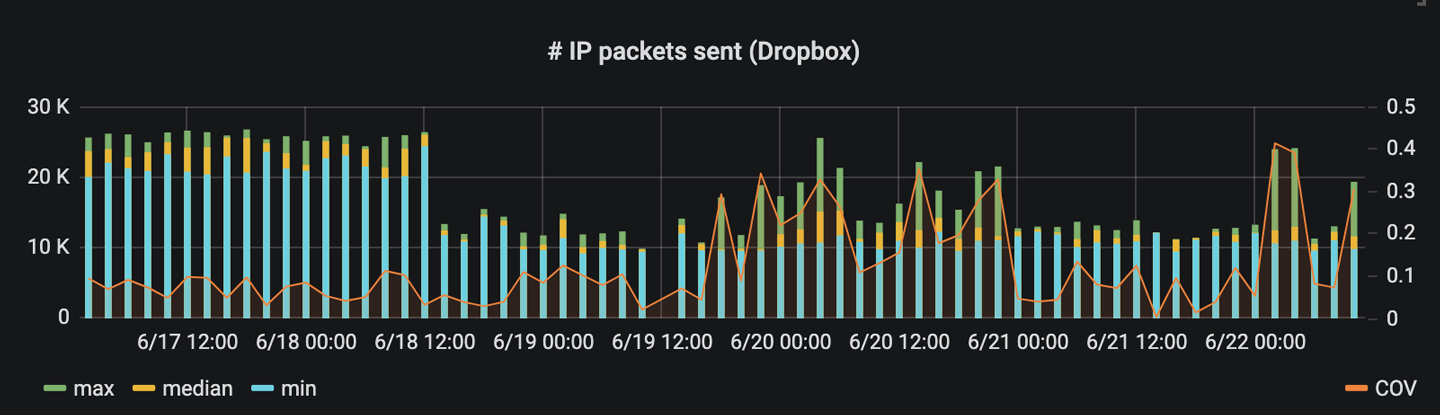
- Mismatched window and frame sizes on the new network stack. After moving to a GRPC-based transport, incompatible buffering settings for high-bandwidth, high-latency links caused request cancellations under load.
Why Early Detection Matters
Before the system existed, the sync team usually learned about performance problems only after customers hit pathological cases and complained. Reproducing those issues after the fact is hard, particularly without the exact evidence to trigger the same conditions a user faced. And even with a root cause in hand, fixing a regression weeks or months after the offending commit landed means rebuilding context that has long since faded. Later commits stacked on top of the original change often make a simple revert impossible; if the problem lives in the data model or persistence layer, the fix may even require an expensive migration.
The automated system sidesteps that entire workflow by surfacing a regression before it touches a single customer. Supporting logs and supplementary metrics give engineers enough evidence to reproduce the failure on a local machine, inspect live sync engine state during the run, and follow up with targeted benchmarks to isolate the source.
The system has also proven useful for finding long-standing bugs that only appear at scale, well beyond what manual testing covers. It has flagged inefficient data storage patterns, exposed limits in asynchronous and concurrent code, caught bugs inside third-party libraries, and validated the rollout of the new network stack. Beyond catching problems, the same infrastructure confirms that performance improvements hold, and keeps future changes accountable to the bar those improvements set.
Next Steps
The sync engine rewrite produced a stable set of testing frameworks along the way. Apogee exercises sync at a very high level, so the next push is to bring performance testing down to the lower-level test layers. Those tests are cheaper to write, run, and maintain, and they provide much deeper visibility into the sync engine's internal behavior, which will enable more sophisticated analysis.



