
When a Single Laptop Wasn’t Enough
For years, Figma’s entire performance testing operation ran on one MacBook. The machine looped through a couple of test scenarios and reported timings to a shared dashboard. It worked in 2018, when the codebase was smaller and the team was concentrated in one place. But five years later, that setup stopped being viable.
The hardware itself gave out first. In early 2020, the team went remote, but the MacBook stayed plugged in at the San Francisco office. By October, it overheated. Attempts to migrate the tests to another laptop failed because they wouldn’t run smoothly. That crash was the catalyst for a full overhaul of the performance testing framework.
Granularity at Scale
The original testing approach relied on a few large design files to represent the product. As Figma grew to include plugins, community features, FigJam, and Dev Mode, those files could no longer cover the expanding feature surface. The engineering organization had grown to more than 400 people shipping changes daily, and no single person—or laptop—could track the performance impact of every commit.
The solution was to shift to granular performance tests: dedicated tests for each feature that check detail at scale. In one of the newer scenarios, the system simulates rapid panning around a file with 100 multiplayer editors moving layers and typing text simultaneously. Running this level of test for every proposed code change in the monorepo became a core requirement, allowing the team to catch regressions early in the development cycle rather than reacting to user-reported slowdowns after release.
A System Built for Parallelism
The team outlined three key requirements for the new framework. First, it had to handle tests for every pull request. Second, it needed to run fast—any performance guardrail check had to complete in under 10 minutes to keep pace with the engineering workflow. Third, it had to provide a way to discuss and compare results.
Meeting the speed target meant embracing parallel runs. Figma already used parallelization on cloud-hosted CI runners for other testing, so the concept was familiar. Running performance tests on real hardware for each pull request, however, would require around 100 identical runners at peak load. That scale is a significant operational challenge, particularly because performance testing needs consistent, dedicated hardware to produce trustworthy measurements.
Hardware, Metrics, and Remote Collaboration
Operating testing hardware is inherently difficult. Distributed teams compound that challenge. The team needed a system that could run dozens of stress scenarios simultaneously on real hardware, revealing subtle performance changes that only manifest under specific conditions.
Beyond raw timing numbers, the framework needed to collect CPU profiles. The ability to capture and share links to profile data enables engineers to dig into the cause of a regression and compare performance across runs. That capability turns performance testing from an automated red flag into a diagnostic tool that supports decision-making.
Figma’s performance environment is unusually complex. The product is built on web technology but behaves more like a game engine, with massive client data sets, dozens of concurrent screens, and constant rendering. That means the testing framework had to handle workloads that resemble gaming applications more than typical web apps, adding another layer of nuance to the design.
Designing the testing strategy
After scoping the work, the core team kept the group lean to move fast. The initial six-month plan targeted high-impact wins first while also laying groundwork for sustainable long-term performance. The challenge was scale: building a device farm of identical laptops running tests on every commit sounded promising but quickly revealed hidden costs. Maintaining such a farm—nurturing hardware with proper cooling, network, and updates, then replacing degrading machines—requires significant engineering resources, and even virtualized alternatives demand endless effort just to tame variance.
Counting CPU instructions is a common deterministic approach for tracking traditional algorithms, but it doesn't map cleanly to Figma's workload. The editor is a graphics-heavy application splitting work between CPU and GPU, with data movement between CPU, GPU, and main memory (often called I/O) potentially becoming the bottleneck. Additionally, the application is a mix of WASM/WebGL and HTML/JS/CSS running across browsers with their own interpreters and just-in-time optimizers. Figma's editor isn't always CPU-constrained—sometimes it's GPU, and rarely I/O.
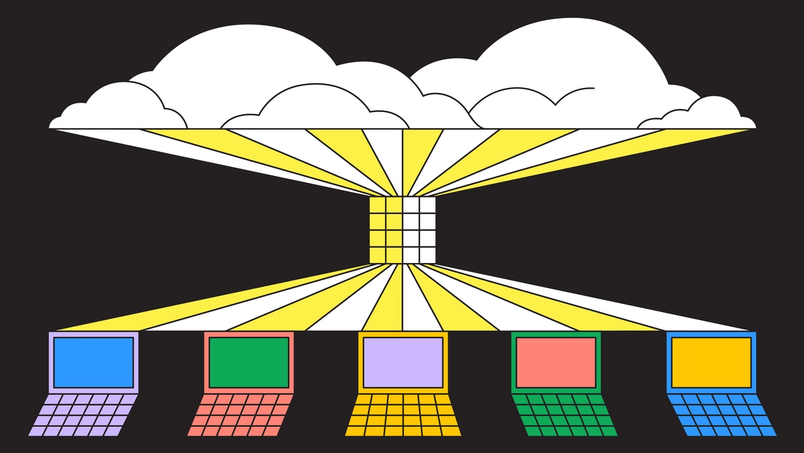
After evaluating the options, we shipped two complementary systems sharing the same CI infrastructure. Engineers across product teams run the same performance test scenarios on both. A cloud-based system handles mass testing for most situations, while a hardware system targets cases requiring more precision.
The cloud-based system
This system runs in GPU-enabled virtual machines, executing a headless Chromium process on every code change in every pull request. VMs introduce noise from virtualized hardware, loud neighbors on shared hosts, and measurement inconsistency—all problematic for accurately timing complex applications. To compensate, we set a 20% pass margin to catch the most egregious regressions (like a rendering algorithm accidentally becoming O(n²)) while skipping minor noise. Running in VMs enables many parallel tests, hitting our 10-minute feedback cycle.
We chose end-to-end in-browser testing with a real GPU over compiling the C++ editor into a separate test binary. This captures complex issues involving WebGL rendering, CSS-facing browser layout algorithms, and even accidental React hook misuses. Testing with production backend services remains future work requiring substantially more engineering investment.
The hardware system
The second system runs on a small array of test laptops—older machines and devices without latest hardware (older MacBooks, outdated Windows laptops, Chromebooks). Developers can schedule custom runs of any test scenario through the same CI scheduling system. Slower but more precise, it supports on-demand runs for cases needing consistent user-like hardware: bisecting subtle regressions that reached staging or production, comparing day-over-day changes on realistic devices, and experimenting on optimizations for performance-critical hot paths like canvas rendering.
Both systems share supporting features: test scenarios that stress local edits or simulate multiplayer change streams, detailed HTML reports with recorded metrics for internal sharing, and CPU profiles for deeper bottleneck analysis. This pairing of virtual and real hardware lets us guardrail most regressions while giving engineers tools to collaborate on hot areas or suspect code remotely.
Two performance case studies
The system went live in October 2022 after six months of design and development. From there, we focused on collaborating with specific performance-focused projects.
Improving rendering performance
Andrew Chan, Software Engineer, Figma

Figma renders most content via WebGL—lower-level control over rendering quality and performance at the cost of complexity. We developed stress tests for complex scenes like thousands of layers edited by 50 multiplayer users, then dove into CPU and GPU profiles. Some techniques worked well on certain hardware configurations but added too much overhead on others. Given the wide variety of CPUs, GPUs, drivers, operating systems, and browser behaviors, validating each optimization idea on real hardware was key to prioritizing time-consuming engineering work. Benchmarking low-fidelity prototypes revealed that many initially promising ideas were less impactful—or even harmful—on older computers.
This led us to time-slicing of rendering, which showed the most promise. Figma's multiplayer technology means the rendering engine must respond quickly to remote and local edits alike. The new algorithm prioritizes local edits and operations over rendering changes from other users, similar to how modern computers allocate computing time among applications. Latest machines saw almost no impact, but slower devices experienced improved perceived frame rate.
Throughout development, we benchmarked the optimized code path against both baseline and the original prototype, maintaining desired FPS increases and custom metrics introduced for the project. With the team split between New York and San Francisco, convenient remote access to test machines, regular benchmark tracking, and experimental data were crucial.
Speeding up FigJam
Sean Marney, Software Engineer, Figma

FigJam's usage patterns differ significantly from Figma. Users quickly add and recluster numerous sticky notes, compared with iterating on designs within a few frames. The optimizations built for Figma weren't perfectly suited for FigJam, so we needed a one-size-fits-all approach: an optimization for a solo designer creating a complex mockup shouldn't come at the expense of hundreds of people in a quick whiteboard session.
Early FigJam iteration was reactive, fixing issues from customer reports or production metrics. The new testing framework changed this: tests cover most essential user flows and find issues before production—often before code merging. Despite initial friction with new, flaky tests, they proved invaluable for catching regressions from innocent-seeming code. A prime example: the developer updating the sticky page curl animation's CSS didn't know that background-filter: blur(0) can fix Safari rendering bugs but also subtly affect layer compositing speed. Thanks to automated tests running regularly on codebase HEAD, we spotted the significant spike in frame lengths for core user behaviors and identified the exact code change—while it was still in staging.
Issues sometimes make it further before detection, as when a temporarily disabled test means no automated alert. The remote hardware lab helps here too: running tests on older commits with git bisect narrows down the offending change. At one point, an optimization written by an engineer with certain initials... performed well at the 50th percentile of frame rate but had issues at the 90th percentile only on specific machines. Default systems didn't catch it, but manually running a few tests about 10 times exposed the flaw.
Why performance is a moving target
Performance engineering rarely plays out the way you expect. The code that looks like an obvious bottleneck often isn't one, while a seemingly innocuous feature can hide a serious performance cost. That unpredictability is exactly why building solid testing and benchmarking frameworks matters so much—and why Figma's engineering culture had to evolve around them.
Today, the team has grown well past the point where any single engineer can hold the full nuance of every product and feature in their head, and the company doesn't expect them to. But the work on one team still ripples into another team's code. With that kind of interdependence, fixing performance problems ad hoc isn't sustainable. The real shift is toward systematically addressing these concerns, because that's what keeps development velocity from stalling as the product grows.
Progress since the early days on a single MacBook has been substantial. The focus has moved beyond making individual fixes to empowering domain experts to lead performance-improving initiatives. Alongside that, the team has put checks in place to make sure those gains don't quietly regress. Remote, on-demand test runs make it possible to validate changes without waiting for a shared machine or a release cycle.
Detailed reporting and a carefully chosen set of metrics now give engineers a common language for discussing performance-sensitive code, even when they're working across teams and time zones. The result is a foundation that can be extended rather than rebuilt—each new improvement stacks on the last one instead of starting over.



