
Reading Liquid Render Performance in Theme Inspector
Server-side rendering is the first thing a customer waits on, so it’s one of the most important timings to optimize in a Shopify theme. Shopify’s Theme Inspector extension for Chrome turns the server-side execution of Liquid into a flame graph, giving you a way to see where render time actually goes and to catch patterns that are expensive before they degrade the storefront experience. The same markup can be produced very different ways in Liquid; the flame graph shows which path was cheap and which one was not.
What the Flame Graph Shows
After installing the Shopify Theme Inspector extension and loading a store page, the tool produces a flame graph that represents the code path and the execution time for each piece of that path.

A straightforward template looping over a 10-item paginated collection renders in about 13 ms. The visible bars correspond to the pagination loop—in this case, rendering ten product titles. A section of time that appears to be missing from the graph is the server-side work of collecting all product information that belongs to the items in the paginate collection; it happens outside of Liquid.

Three Patterns That Cost Render Time
Certain Liquid patterns look reasonable in code but show clear problems in a flame graph. Comparing them to the clean baseline makes the cost visible.
Heavy Loops
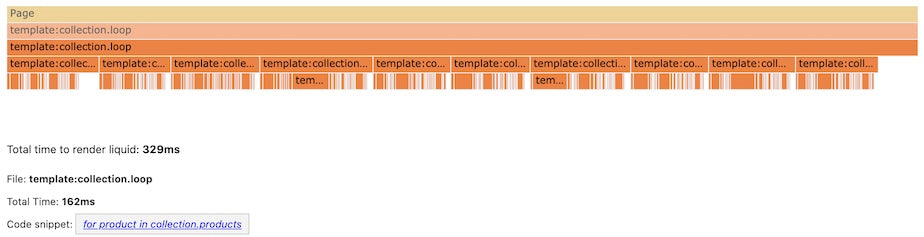
Adding accesses to product attributes while iterating over a collection is a small-looking change with a large cost. The same 10-item loop that previously rendered in 13 ms now takes 162 ms—roughly 16 ms per item instead of under 1 ms—while producing the exact same markup. Scaling that to a 50-item page means about 800 ms of render time.
What to do instead:
- Watch the total rendering time per loop iteration, not just the individual 1 ms bars.
- Remove attribute accesses that aren’t used in the rendered output.
- Reduce the number of products on a paginated page, potentially loading the next page via AJAX.
- Simplify what each product tile actually renders.
Nested Loops
Nested loops are easy to miss in source code because they are often spread across different files or snippets. In the flame graph, they appear as a deeper stack. A typical two-level loop—iterating over a product’s options and then its variations—renders in 55 ms for a single product.
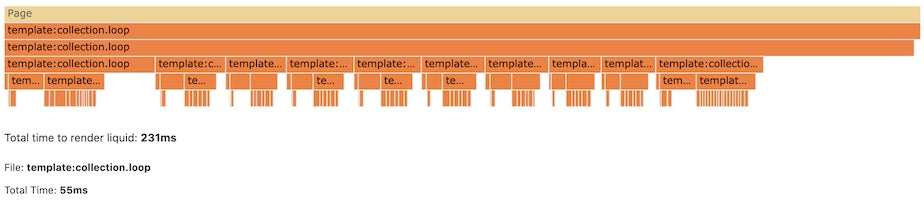
Notice that the two inner for loops appear as separate stacks side by side. That’s acceptable for one or two loops, but the per-iteration cost varies with how many inner iterations execute. Pushing the same pattern to three nested levels jumps the render time to 72 ms for one product.
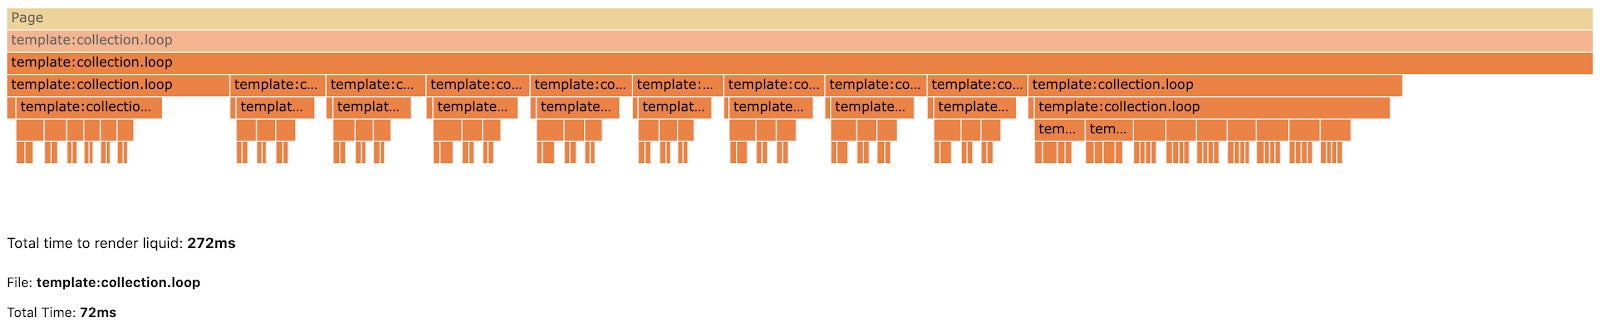
A small bit of additional logic inside these loops can quickly blow past any server render budget.
- Look for a sawtooth shape in the graph; it indicates a nested loop worth investigating.
- Walk each layer of the graph and ask whether all those loops are genuinely required.
Multiple Global Liquid Objects in a Loop
Introducing a global object like cart items into the same loop pattern produces a flame graph shaped like a comb or sawtooth. The cost scales with the number of items in the cart. Rendering the same template with one cart item takes 45 ms; with ten items, it takes 124 ms.
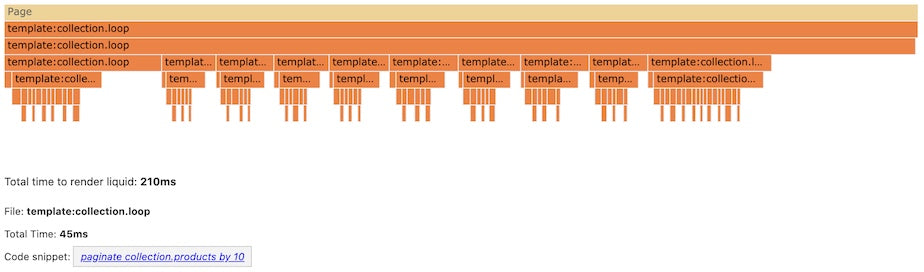
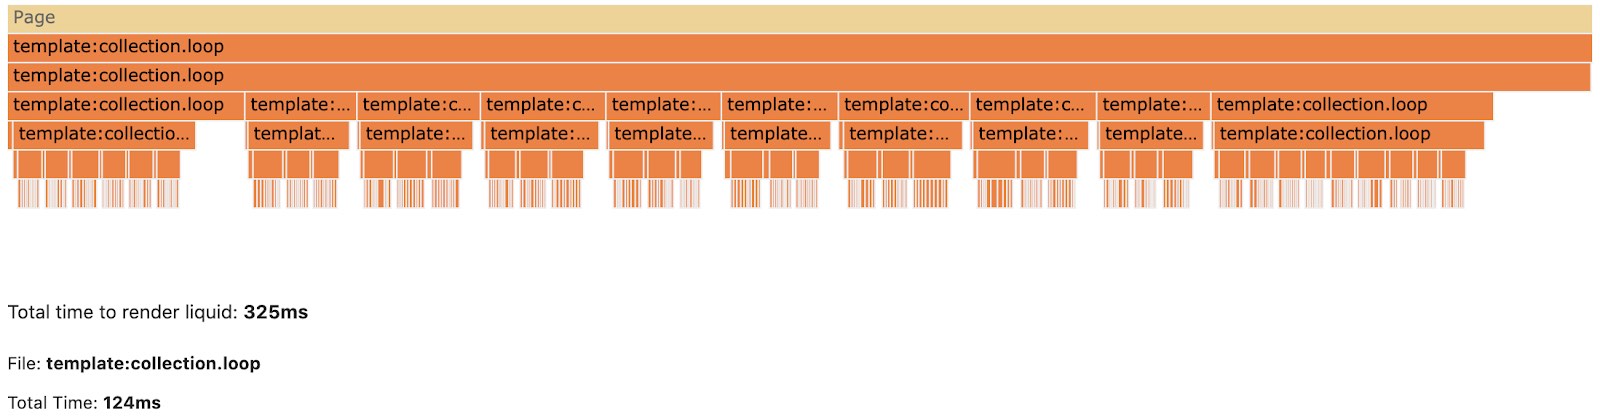
- A hair-comb or sawtooth shape is a sign that a global object is being read repeatedly in a nested structure.
- Generate flame graphs with one item and then with many items in the cart, and compare them.
- Avoid mixing global Liquid scopes in one loop; if cart data is needed, consider fetching cart contents with AJAX instead.
Budgeting Render Time for Your Page
Shopify’s guidance is to keep total page rendering at 200 ms and under 500 ms at most. That number follows from a time budget built around Google’s Web Vitals, where a good Largest Contentful Paint (LCP) score is under 2.5 seconds. LCP depends on several earlier steps, each with its own cost:
- Network overhead from the server to the browser, which varies based on the customer’s connection (for example, 3G vs. Wi-Fi).
- Time from a blank page (TTFB) to first content (FCP), which is the browser parsing and displaying HTML.
- Time from FCP to LCP, which covers loading remaining resources like images, CSS, fonts, and scripts.
If the server render takes 500 ms, that accounts for one component in the pipeline from request to LCP. Optimizing the critical rendering path at the theme level can shave time off the TTFB-to-FCP window.
|
Server → Browser |
300 ms for network overhead |
|
Browser → FCP |
200 ms for browser to do its work |
|
FCP → LCP |
1.5 sec for above the fold image and assets to download |
Note that not all of the 500 ms belongs to the theme’s product content. Portions of that budget are reserved for Shopify’s infrastructure and for the theme’s global parts—the header and footer, for one—so the actual time available to template logic is less than the full allowance.
|
Total |
500 ms |
|
Shopify (content for header) |
50 ms |
|
Header (with menu) |
100 ms |
|
Footer |
25 ms |
|
Cart |
25 ms |
|
Page Content |
300 ms |
Aiming for 200 ms as a target gives you a buffer before problems become user-visible, and it makes gradual performance drift easier to notice while there is still room to act on it. Theme-level issues with the inspector can be reported through the Shopify theme-inspector GitHub issue tracker.



