

Why Issues still felt slow, and the metric we used to prove it
For developers working through a backlog, the cost of navigating GitHub Issues isn’t just measured in milliseconds—it’s measured in broken focus. Opening an issue, jumping to a linked thread, and returning to the list each triggered redundant data fetches even when the user had effectively seen that data moments before. The objective for our performance team was to redesign data flow and navigation behavior so that loading an issue feels instant by default, not merely "fast enough."
To align on what "fast" means, we adopted HPC (Highest Priority Content), an internal metric closely aligned with the Web Vitals LCP. HPC measures when the primary content on a page—typically the issue title or body—is first rendered. We bucket navigations into three operational thresholds:
- Instant: HPC < 200 ms
- Fast: HPC < 1000 ms
- Slow: HPC >= 1000 ms
This shift also changed our measurement philosophy. Historically, we focused on minimizing the p90 and p99 tail of HPC. But optimizing worst-case outliers doesn't guarantee the median experience feels responsive. For this workstream, we focused on distribution quality: how many navigations fall into the instant and fast buckets across the entire user population.
The baseline: hard navigations dominated traffic
Before implementing changes, we mapped how users actually reach issues#show. We identified three primary navigation types:
- Hard navigation: full browser load, paying the complete cost of network, server rendering, asset loading, JavaScript boot, and React hydration.
- Turbo navigation: a Rails Turbo transition that updates page regions without a full reload, but still depends heavily on server-rendered responses.
- Soft navigation (React): a client-side transition within the running React runtime, which can avoid full bootstrap costs.
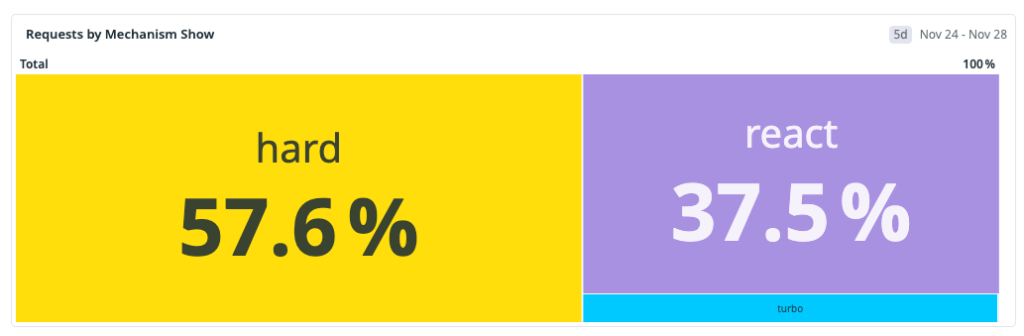
The distribution was clear: the dominant path was also the slowest. A strategy that only optimized React soft navigations couldn't move overall perceived performance enough. Part of the issue stems from GitHub's ongoing migration from Rails-rendered pages to a React frontend. Many user journeys cross that boundary—navigating from a Rails page into Issues—which forces a full hard navigation and cold boot.
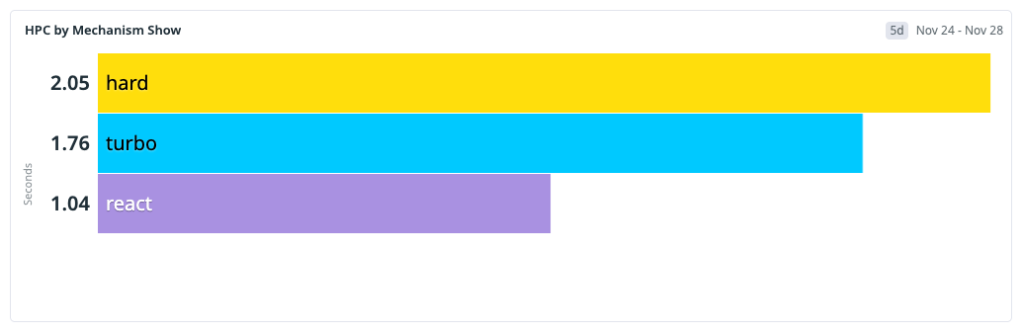
We expected that hard-navigation share to diminish over time as more surfaces become React-native. But we couldn't wait for the platform migration to solve the problem. We started by optimizing React soft navigations first, where we had immediate architectural leverage, then built toward a local-first application model with stale-while-revalidate: render immediately from locally available data, then revalidate against the server asynchronously.
Step 1: Persistent caching with IndexedDB
React soft navigations were the highest-leverage target: the runtime is alive, so the dominant cost is data fetch latency, not application boot. Our pre-workstream analysis revealed a strong repeated-access pattern—users reopen the same issues frequently during triage. We estimated a potential cache-hit ratio of roughly 30% for issues#show, which became our viability threshold.
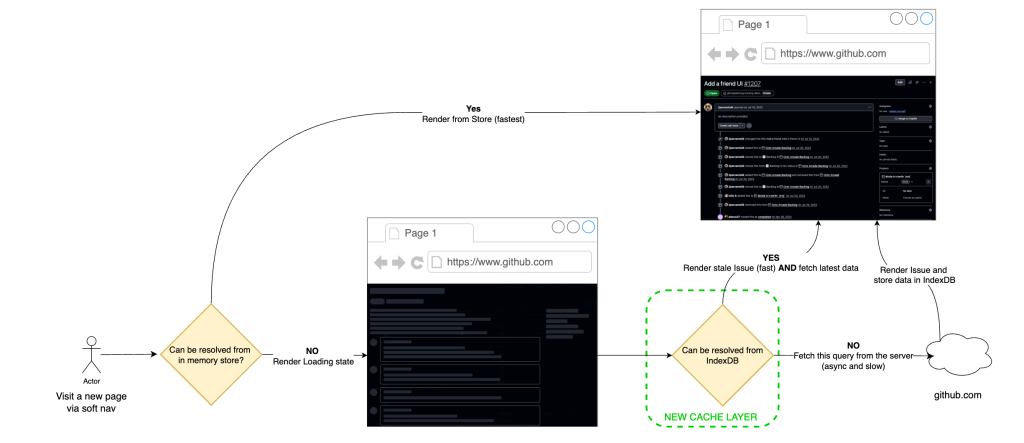
The implementation extended our existing in-memory store with a persistent client cache baked into IndexedDB. The choice came down to three technical properties:
- Durable storage that survives tab closes and browser restarts, unlike memory-only stores.
- An indexed object-store model that supports efficient key-based lookups for issue query payloads.
- A larger practical quota than
localStorage, making it viable for real working sets.
On top of this storage, we built stale-while-revalidate semantics. The read path hydrates from local cache first and renders immediately. The revalidation path issues a background network request for freshness and reconciles the in-memory store if data changed. The failure behavior ensures that degraded networks still produce a usable page from cache, with freshness reconciled upon connectivity recovery. This isn't "cache or correctness"—it's latency-first rendering with asynchronous consistency checks on the same navigation.
Initial production results validated the model. After broad rollout, approximately 22% of React navigations became instant—up from 4% pre-launch—representing about 15% of total request volume. The observed cache-hit ratio landed around one-third (~33%), consistent with our revisit analysis.
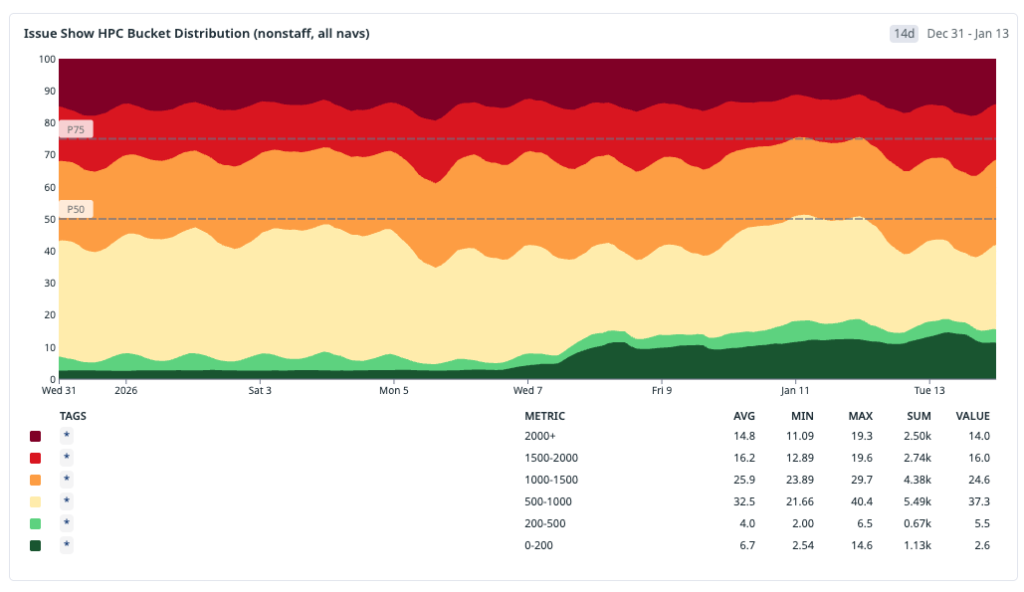
The primary tradeoff is controlled staleness. We measured server/cache divergence at approximately 4.7%, which we treated as an acceptable operating envelope given the perceived speed gains, with safeguards in place to limit user-visible inconsistency.
Step 2: Preheating to improve cache-hit ratios
Caching is only as valuable as its hit rate. The IndexedDB-backed SWR layer was a solid first step, but a one-third hit rate revealed the next bottleneck: most navigations arrived before the data did. The naive fix—prefetching every likely next issue—collapsed under capacity constraints. High-fanout surfaces like issue lists, dashboards, and projects would amplify request volume and push unnecessary compute onto the system for pages users may never open.
So we reversed the objective. Rather than ensuring prefetched data is always fresh, we optimized for a cheaper condition: ensuring some usable data is already local by the time the user clicks.
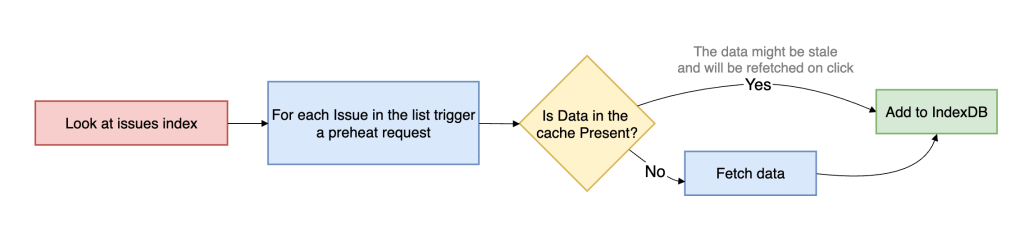
That's preheating. Preheating proactively walks high-intent issue references and prepares cache entries ahead of navigation, but only hits the network when the issue isn't already in the client cache. If usable data exists, preheating stops. This fundamentally distinguishes it from traditional preloading: it's cache-population logic, not freshness-enforcement logic. The tradeoff is deliberate. We accept data that may be slightly stale because once the user opens an issue, background revalidation converges to the latest server state.
To support this efficiently, we added an in-memory cache version in front of IndexedDB. IndexedDB provides persistence but remains asynchronous and therefore costly on the critical path. The in-memory layer serves hot issue payloads synchronously, removing another async boundary from soft navigation and materially increasing the odds of rendering directly from memory.
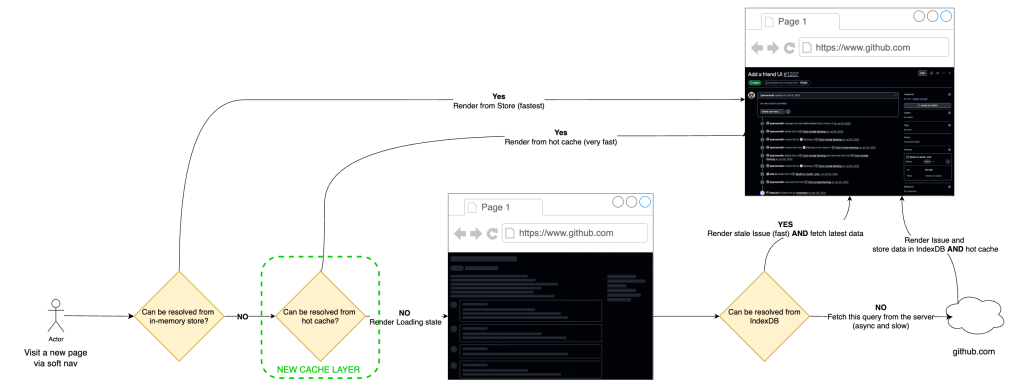
Operationally, preheating is triggered from high-intent surfaces: issue lists, dashboards, projects, and dependency views. Requests run on low-priority workers, are strictly rate-limited, and are guarded by circuit breakers that back off under pressure. User-initiated work always takes precedence over speculative fetches, avoiding the noisy-neighbor problem while still improving cache-hit ratios for real user navigations.
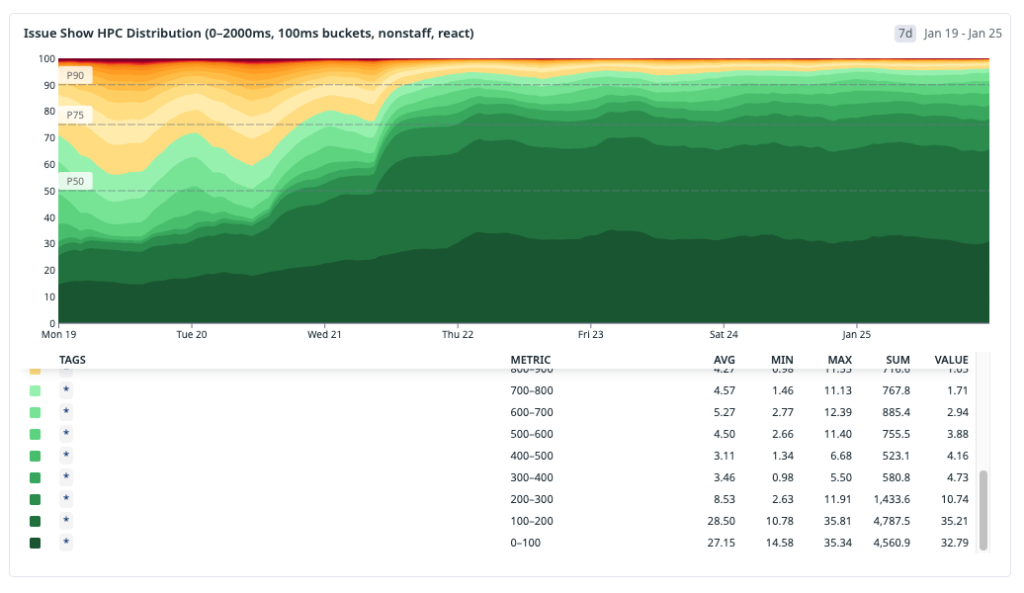
The distributional shift was substantial. After broad preheating rollout, instant navigations for issues#show increased to roughly 30% overall. For React navigations specifically, up to ~70% became instant, and the cache-hit ratio climbed to roughly 96%.
The tradeoff was worth it: a small amount of controlled background capacity moved a large percentage of real user navigations out of the network-bound path entirely.
Bringing cached data to cold starts
Soft navigations were only part of the problem. Refreshes, new tabs, direct URLs, and inbound links all trigger hard navigations that bypass the React router entirely. Even with more of GitHub moving from Rails to React, those cold starts remain a regular part of the experience—and they deserved the same local-first treatment.
Our solution was a service worker. As a browser-managed script that runs outside the page, a service worker intercepts network requests before they reach the server. Conceptually, it acts as a programmable middleman between the browser and the origin—one of the few web platform primitives that can influence hard navigations without requiring the page's JavaScript runtime to already be active.
For issues#show, the service worker extends the local-first model we built for React navigations. When the browser starts a navigation request for an issue page, the worker intercepts it and checks whether the issue data is already in local cache. On a hit, it annotates the outgoing request with a header that tells the server it can skip a substantial portion of its work.

The navigation then splits into two paths:
- Cache hit: the server returns a thin HTML shell (layout, minimal markup, JS), and React renders from the locally cached issue payload.
- Cache miss: the server loads data and server-side renders the page as usual.
This is strictly an optimization. If the cache is cold, stale, or the service worker isn't available, behavior falls back to the standard server-rendered path.
The effect was particularly strong for Turbo navigations, which remain heavily constrained by server response time. When the service worker signals that issue data is already present, the server spends far less time computing the application fragment, and Turbo benefits almost immediately from that reduction in backend work.
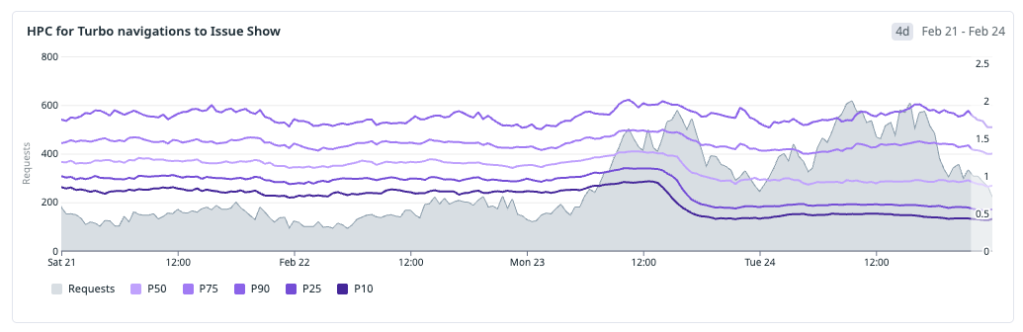
Hard-navigation gains are real but less immediately visible than Turbo gains. On cache-hit hard navigations, we trade SSR time for client-side rendering, which moves JavaScript download and execution onto the critical path.
To keep that cost down, we split code by route using React.lazy and dynamic route preloading, so only the code needed for the current route is fetched up front. The same principle applies at the component level: we load only what's necessary for the initial view and defer non-critical modules. The issue editor bundle, for example, is fetched only when a user enters edit mode; hover-based intent prefetching hides that latency without bloating the initial bundle.
Measuring the cumulative impact
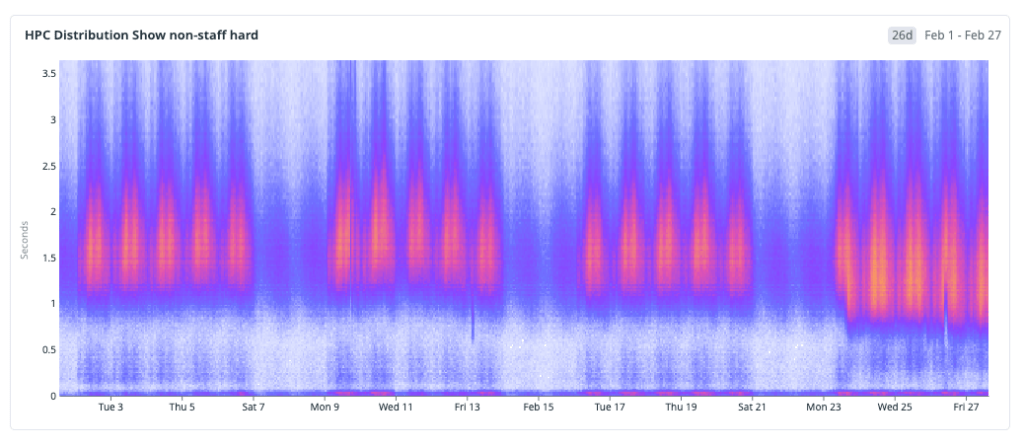
After deploying these changes, we stepped back to assess the whole rollout—from the initial IndexedDB cache through preheating, in-memory layering, and the service worker. The trend across the entire window is clear and sustained: the HPC distribution is shifting toward fast.
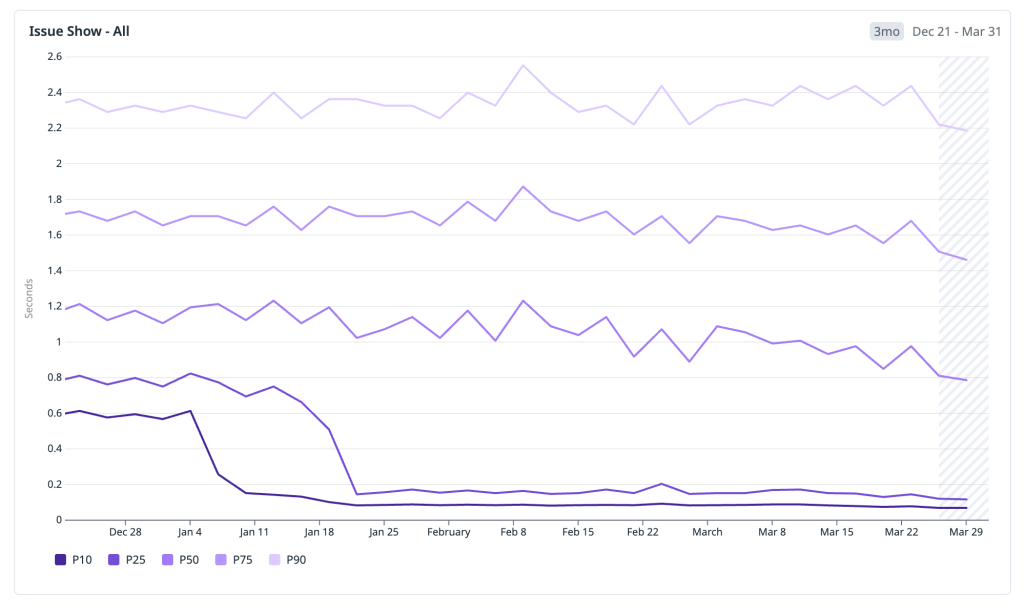
Rather than cherry-picking a single good week, we looked at the full period. The HPC percentiles across all issues#show traffic:
- P10: ~600 ms → 70 ms — the fastest navigations moved firmly into the instant bucket, well below 200 ms.
- P25: ~800 ms → 120 ms — a quarter of all navigations now complete in under 120 ms, down from nearly a full second.
- P50: ~1,200 ms → 700 ms — the median crossed below the one-second threshold, moving from the slow bucket into fast.
- P75: 1,800 ms → 1,400 ms — the upper quartile dropped by over 400 ms, shrinking the long tail of perceptible latency.
- P90: 2,400 ms → 2,100 ms — even the slowest navigations improved, though this tail remains the clearest signal of where further work is needed.
The standout pattern is the outsized improvement in the lower percentiles. P10 and P25 compressed dramatically because cached and preheated navigations now dominate that part of the distribution. The median improved meaningfully but is still shaped by cold-start traffic. The upper tail, while better, reflects hard-navigation paths where JavaScript boot and client rendering are now the bottleneck—exactly the area we're targeting next.
What's left to solve
GitHub Issues is faster today than it has ever been. Across soft navigations, preheated paths, and service-worker-accelerated flows, we've materially changed the distribution of user-perceived latency and moved a much larger share of traffic into the instant bucket.
At the same time, we're not done. Cold starts that rely on SSR remain a real hurdle, especially when client boot and JavaScript execution become the dominant cost once server work is reduced.
The next phase is about moving bigger rocks. We're planning targeted rewrites of backend components optimized explicitly for low-latency delivery and investing in a modern UI delivery layer closer to the edge to reduce round trips and improve response time further.
Performance remains a continuous systems investment, not a one-time project. The architecture is improving, the bottlenecks are changing, and we will keep iterating until fast is the default experience across all navigation paths.



