

When a Node.js App Starts Eating Itself
Several months after migrating kentcdodds.com from Postgres to distributed SQLite with LiteFS, the site began showing inexplicable memory and CPU spikes. The initial suspicion fell on LiteFS itself, but scaling down to a single region and temporarily removing LiteFS entirely didn't stop the problem. The root cause had to be somewhere else in the changes that came with the migration.
The symptoms followed a consistent pattern: memory would creep upward after each deploy until it hit a critical threshold, at which point CPU usage would spike alongside memory, and the app would strain to keep up with requests. The site was not your typical blog—it pulls roughly a quarter-million views a month and serves about 200 Markdown-based posts compiled at runtime with mdx-bundler and MDX. That last detail matters: posts are compiled per request, not at build time, which exposes the app to problems that build-time compilation avoids.
Hunting Through Logs
The first diagnostic step was capturing logs to a local file for post-hoc review:
fly logs -a kcd > ~/Desktop/locker/logs/kcd.$(date +"%Y%m%d%H%M").logSpikes were unpredictable, so the approach was to leave logging running and check it after the fact. Extensive logging and server-timing headers were added to nearly every request, but neither revealed anything abnormal during the spikes. The logs were clean, which meant the problem was deeper.
Heap Snapshots: Useful But Painful
Heap snapshots, which describe everything residing in memory, are a standard tool for diagnosing browser memory issues via Chrome DevTools, and the same approach works with Node.js. A Remix resource route was built to generate and serve a snapshot on demand:
import path from 'path'
import os from 'os'
import fs from 'fs'
import v8 from 'v8'
import { Response } from '@remix-run/node'
import { PassThrough } from 'stream'
import type { LoaderFunctionArgs } from '@remix-run/node'
import { requireAdminUser } from '#app/utils/session.server'
import { formatDate } from '#app/utils/misc'

export async function loader({ request }: LoaderFunctionArgs) {
	await requireAdminUser(request)
	const host =
		request.headers.get('X-Forwarded-Host') ?? request.headers.get('host')

	const tempDir = os.tmpdir()
	const filepath = path.join(
		tempDir,
		`${host}-${formatDate(new Date(), 'yyyy-MM-dd HH_mm_ss_SSS')}.heapsnapshot`,
	)

	const snapshotPath = v8.writeHeapSnapshot(filepath)
	if (!snapshotPath) {
		throw new Response('No snapshot saved', { status: 500 })
	}

	const body = new PassThrough()
	const stream = fs.createReadStream(snapshotPath)
	stream.on('open', () => stream.pipe(body))
	stream.on('error', (err) => body.end(err))
	stream.on('end', () => body.end())

	return new Response(body, {
		status: 200,
		headers: {
			'Content-Type': 'application/octet-stream',
			'Content-Disposition': `attachment; filename="${path.basename(
				snapshotPath,
			)}"`,
			'Content-Length': (await fs.promises.stat(snapshotPath)).size.toString(),
		},
	})
}
Generating a snapshot is synchronous, slow, and requires double the memory the process is currently using—V8 needs a copy to write to disk. Worse, V8 doesn't release that extra memory after the snapshot is saved. Taking a snapshot from a phone, meant to trigger a restart via out-of-memory, was actually causing those massive spikes visible in the metrics. The route is protected by await requireAdminUser(request), so only the site owner can trigger it.
Inspecting the heap pointed to a clear culprit: a module called vscode-oniguruma with a 125MB ArrayBuffer allocation.
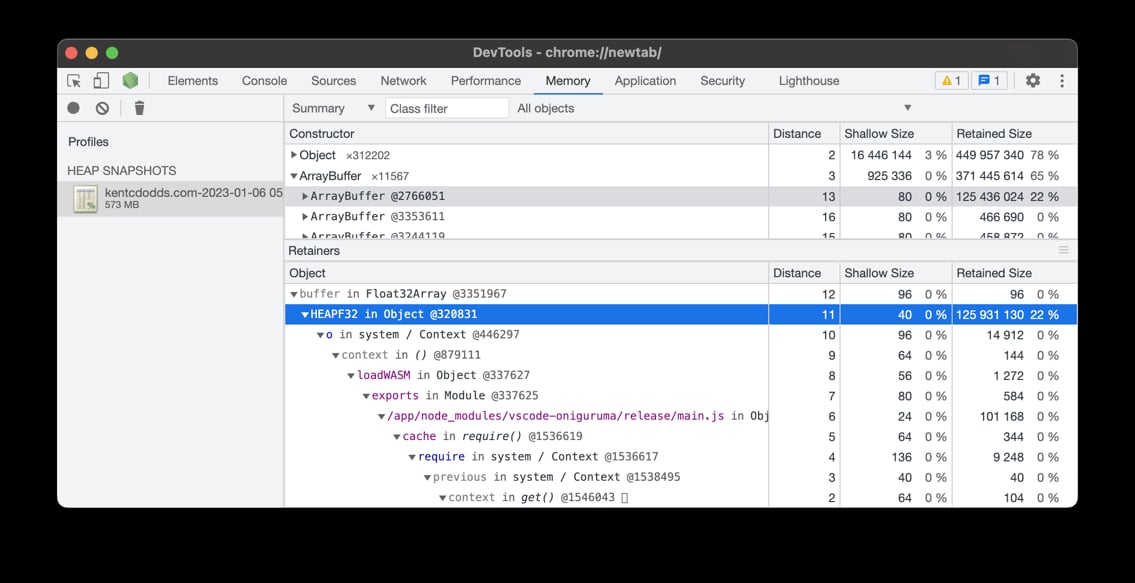
The module is a dependency of shiki, which provides syntax highlighting for blog post code blocks. A colleague confirmed shiki had a known bad memory leak in earlier versions and noted it was better but still present after upgrades. Upgrading helped marginally, but the problem remained.
A Second Pair of Eyes
A live debugging session with Matteo Collina provided more insight. He immediately noticed an absurd TypedArray allocation:
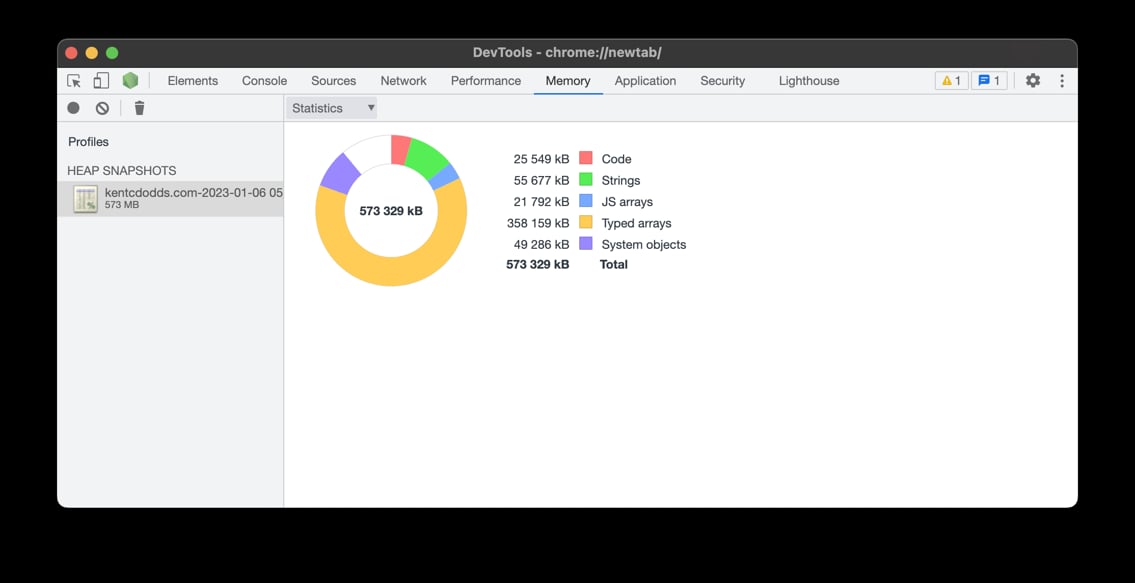
The trace led back to a HEAPF32 object inside the minified build of vscode-oniguruma—a WebAssembly construct. The library had an API to clean up after itself, but shiki wasn't calling it properly. Rather than patch that, the pragmatic fix was isolating shiki into a worker thread using tinypool:
const path = require('path')
const { getHighlighter, loadTheme } = require('shiki')

const themeName = 'base16'
let theme, highlighter

module.exports = async function highlight({ code, language }) {
	theme = theme || (await loadTheme(path.resolve(__dirname, 'base16.json')))
	highlighter = highlighter || (await getHighlighter({ themes: [theme] }))
	const fgColor = convertFakeHexToCustomProp(
		highlighter.getForegroundColor(themeName) || '',
	)
	const bgColor = convertFakeHexToCustomProp(
		highlighter.getBackgroundColor(themeName) || '',
	)

	const tokens = highlighter.codeToThemedTokens(code, language, themeName)
	return {
		fgColor,
		bgColor,
		tokens: tokens.map((lineTokens) =>
			lineTokens.map((t) => ({ content: t.content, color: t.color })),
		),
	}
}

// The theme actually stores #FFFF${base-16-color-id} because vscode-textmate
// requires colors to be valid hex codes, if they aren't, it changes them to a
// default, so this is a mega hack to trick it.
function convertFakeHexToCustomProp(color) {
	return color.replace(/^#FFFF(.+)/, 'var(--base$1)')
}
const tinypool = new Tinypool({
	filename: require.resolve('./worker.js'),
	minThreads: 0,
	idleTimeout: 60,
})

// ...

const { tokens, fgColor, bgColor } = (await tinypool.run({
	code: codeString,
	language,
})) as {
	tokens: Array<Array<{ content: string; color: string }>>
	fgColor: string
	bgColor: string
}
Setting minThreads and idleTimeout meant the worker would spin down when idle, returning memory to the system. This doesn't eliminate the leak, just contains it, but for a personal site that balance is acceptable.
Another issue surfaced during the same session: mdx-bundler compiles MDX into React code, and the helper that turns that code into a component uses new Function—effectively eval. With runtime compilation, every request to a blog post runs this code, forcing V8 to compile and potentially retain those strings. The solution was a straightforward cache.
Before:
function useMdxComponent(code: string) {
	return React.useMemo(() => getMdxComponent(code), [code])
}
After:
// This exists so we don't have to call new Function for the given code
// for every request for a given blog post/mdx file.
const mdxComponentCache = new LRU<string, ReturnType<typeof getMdxComponent>>({
	max: 1000,
})

function useMdxComponent(code: string) {
	return React.useMemo(() => {
		if (mdxComponentCache.has(code)) {
			return mdxComponentCache.get(code)!
		}
		const component = getMdxComponent(code)
		mdxComponentCache.set(code, component)
		return component
	}, [code])
}
The cache uses lru-cache to bound its size, though a few hundred entries is the realistic maximum.
Still Leaking
Despite the worker-isolation and caching fixes, production metrics didn't improve. A load test with autocannon during the debugging session failed to reproduce the problem locally, so the hunt continued. Fresh heap snapshots confirmed shiki was no longer the issue, but revealed two disturbing patterns: a large number of strings tied to Express requests and Cloudinary, and a huge number of TLSSocket connections to Cloudinary as well.
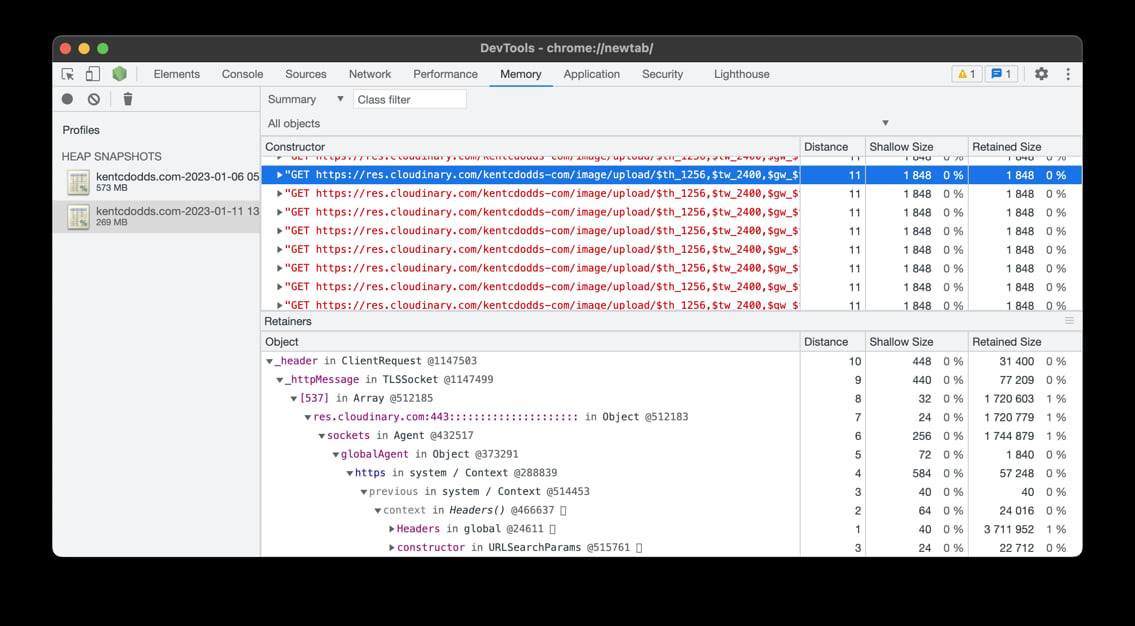
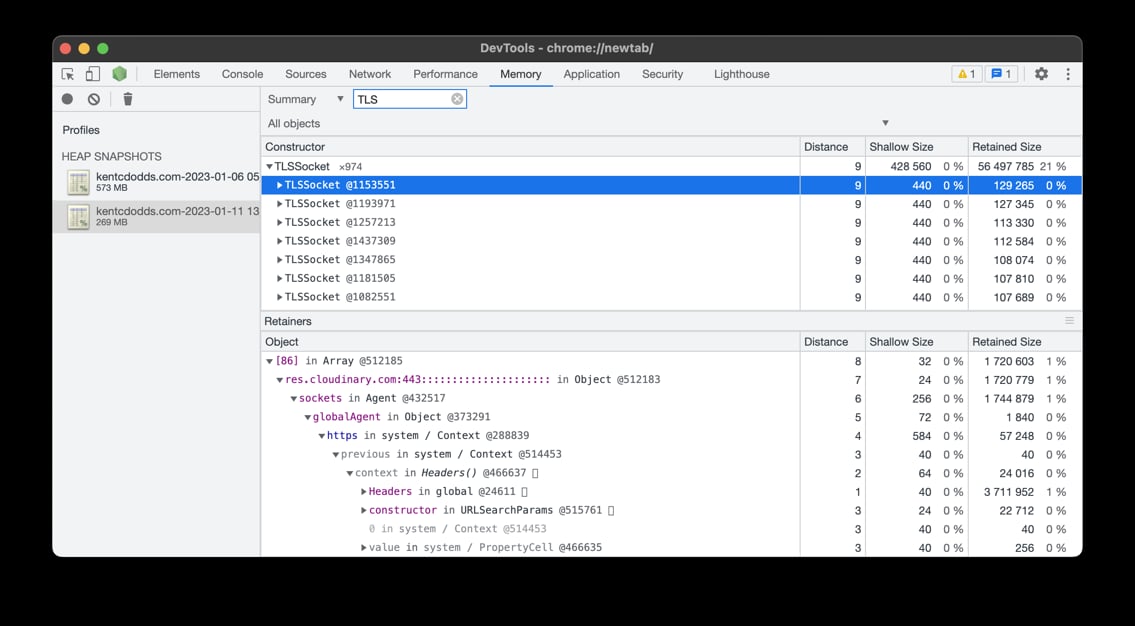
The connection was made: an express-http-proxy was proxying og:image URLs from the site's own domain to longer Cloudinary URLs. That module was leaking request objects at an alarming rate. The traffic came mostly from Twitter, Discord, and similar crawlers with their own caching, so volume was limited—but each retained object was sizable.
The fix was simple: remove the proxy entirely and serve the long Cloudinary URLs directly. That stopped the leak immediately.
Verifying the Fix
After a day of the site holding steady at roughly 500MB of memory usage, the leak appears to be resolved. Following Matteo's advice, I scaled the deployment from 2GB down to 512MB. V8 tends to consume all available memory regardless of actual need, so a smaller allocation shouldn't introduce new pressure.
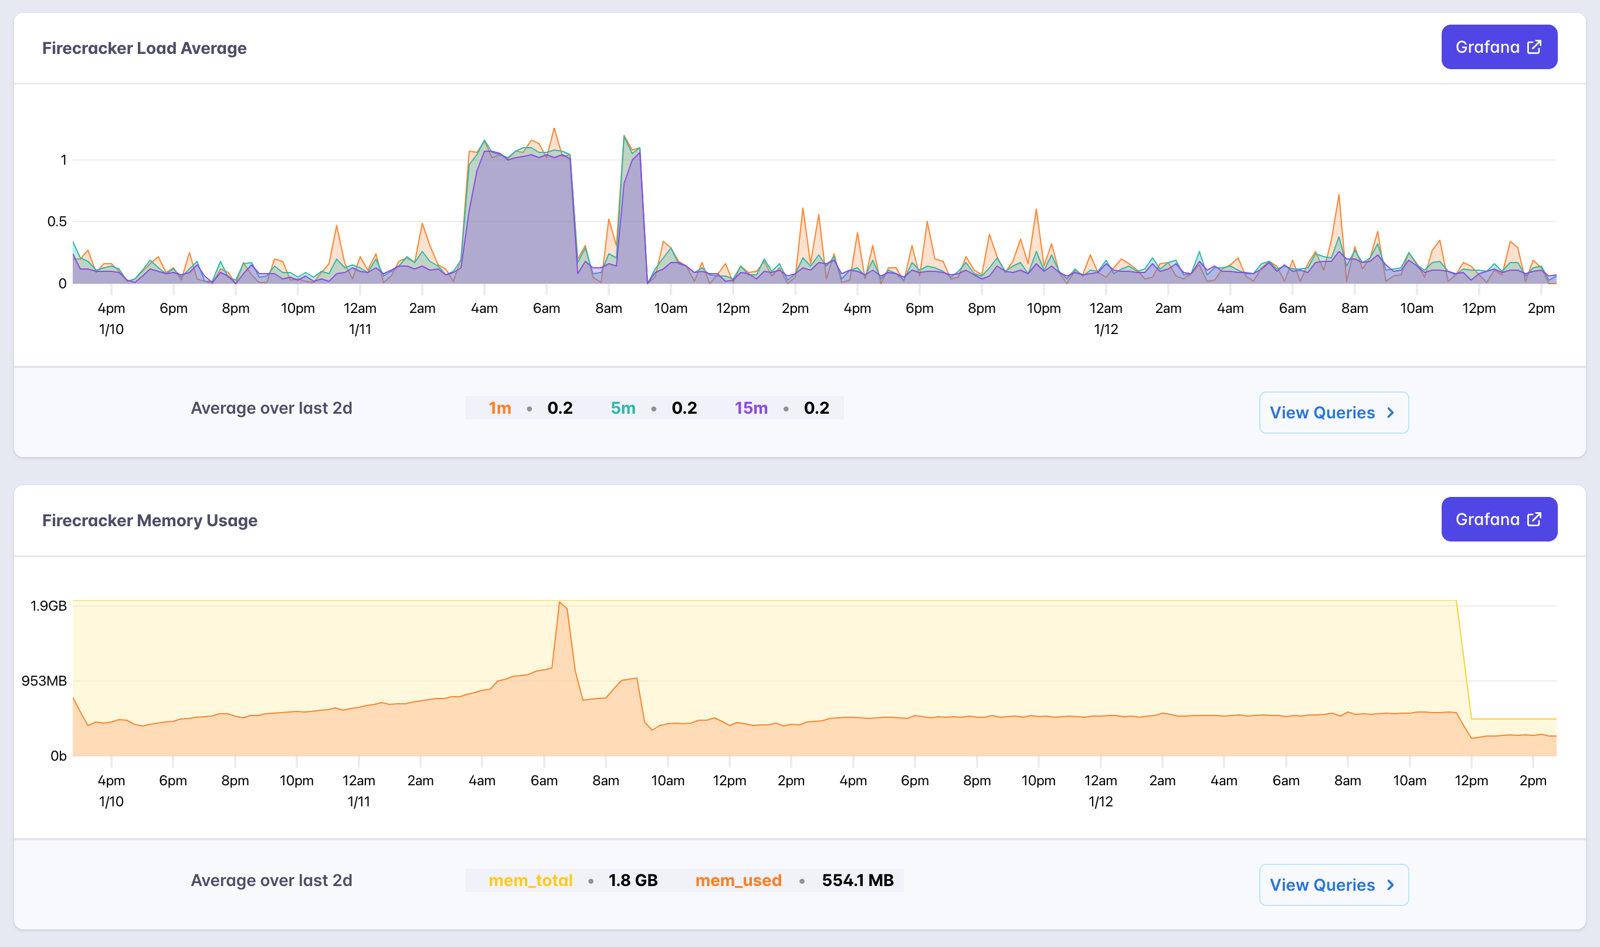
The chart shows a sharp memory drop where I applied the new limit, with the app settling comfortably around 250MB. That two-day view now tracks a clean profile, with the earlier CPU and memory spikes gone from the picture.
Lessons Learned
It's satisfying to close this one out, especially since the culprits weren't in code I had written. The next step is testing multi-region deployment to improve performance for visitors worldwide. Hopefully, this walkthrough helps others tackle similar production issues with confidence.



