What the 2026 World Cup Did to Meta's Infrastructure
The quadrennial tournament functions as the largest planned stress test the company runs, and the 2026 edition set records across messaging, video, recommendations and networking at once. The headline figures:
- WhatsApp: over 30 million messages per second during the July 19 final (Argentina vs. Spain) — 1.23x the New Year's Eve 2026 peak and an all-time record. The prior record had already fallen 12 days earlier, when the Argentina–Egypt Round of 16 match hit 29 million messages per second.
- Messenger, Threads and Instagram Direct: 49 million messages per minute at peak.
- Instagram: recommendation system traffic up to 80% higher week-over-week. Final-squad players added +213.6 million activated followers (a 6.6% increase), taking their combined followings from 3.26 billion to 3.47 billion.
- Live video: watch time +90% on Instagram and +242% on Facebook against the July baseline.
- Threads: 1.5 billion impressions on tournament-tagged posts, roughly 15 million people reached daily, peaking at 25 million on July 6.
- Facebook: 80 million posts mentioning the World Cup.
Peaks Landed in the Breaks
Graphing game events against global egress traffic exposed the pattern that drove every capacity decision: sharing surged during stoppages — hydration breaks, halftime, extra time, the final whistle, the awards ceremony — rather than during play. The end-of-regulation whistle produced the tournament's single largest peak.
During the final, traffic climbed +46% in roughly four minutes at the end of regular time, and +57% in about fifteen minutes at the final whistle.
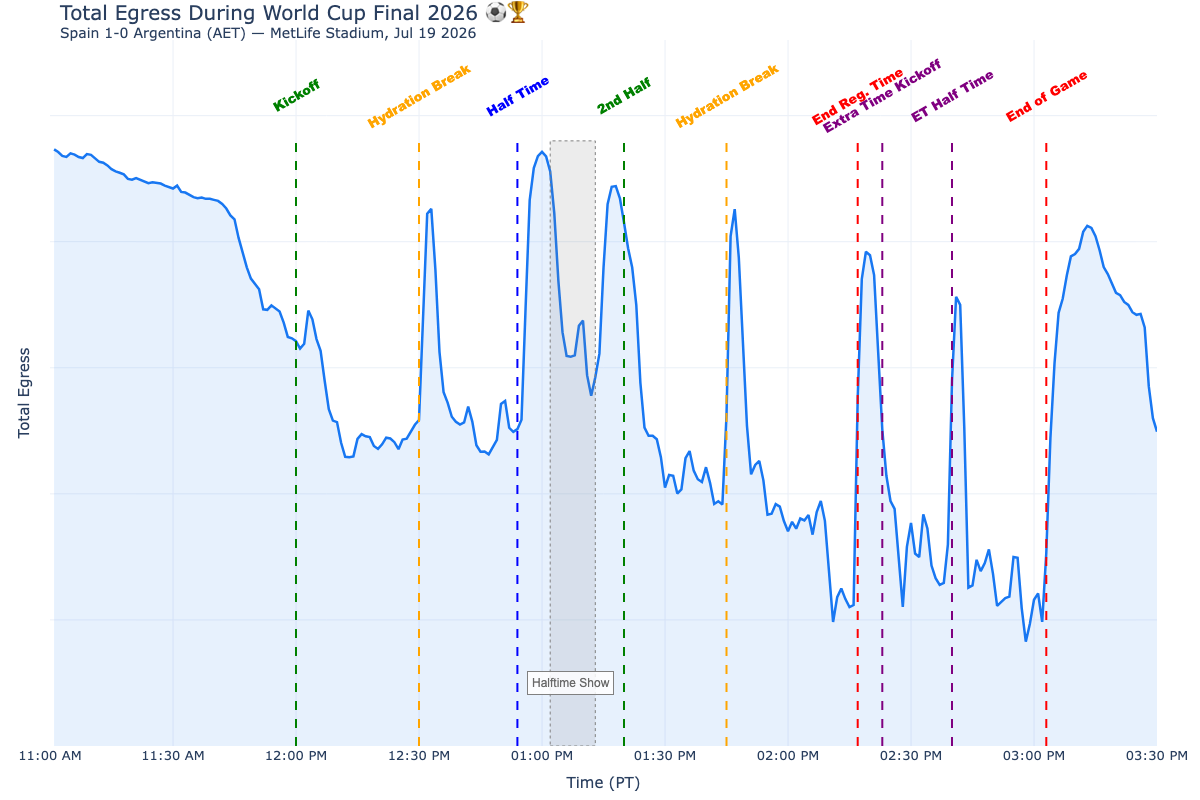
The gameplay did not move the charts; the conversation after it did.
Absorbing the Spikes Without Manual Intervention
A layered stack handled the load. Taiji balanced load across datacenters, Katran and Proxygen covered L4/L7 traffic distribution, the global load balancing system routed users to the best-positioned edge, and AutoScaling provisioned capacity on demand.
Capacity work also happened outside the datacenter. Months before kickoff, edge teams analyzed network capacity and coordinated with ISP partners so upgrades landed where they would most improve quality of experience. That targeted pre-build remains in place as permanent capacity.
Instagram: 39 Days of Spikes
For Instagram the tournament meant 39 consecutive days of traffic surges as billions of fans checked scores, posted Stories and flooded Feed during breaks. Machine learning inference, Feed serving, Stories, Explore and data infrastructure all had to absorb it without degrading the experience. Halftime Feed traffic during the final rose 76% above the previous day in the minute the match ended, and held about 21% above for the next two hours.
Four measures, deployed incrementally as the bracket narrowed, carried the load:
- Capacity buffers. Products entered the tournament with sufficient capacity, leaving real buffers to allocate. Significant additional capacity was pre-provisioned across all serving tiers so spikes never waited on autoscaling — the single most effective lever of the tournament.
- Country-level graceful degradation. For high-risk matches, non-critical background load was shed in the top-traffic nations (Brazil, Argentina, India, Indonesia, Spain) to protect core functionality.
- Cascade prevention. Serving-layer spikes were blocked from propagating into downstream data systems.
- Early warning signals. Alerts fired before capacity thresholds were approached, not after.
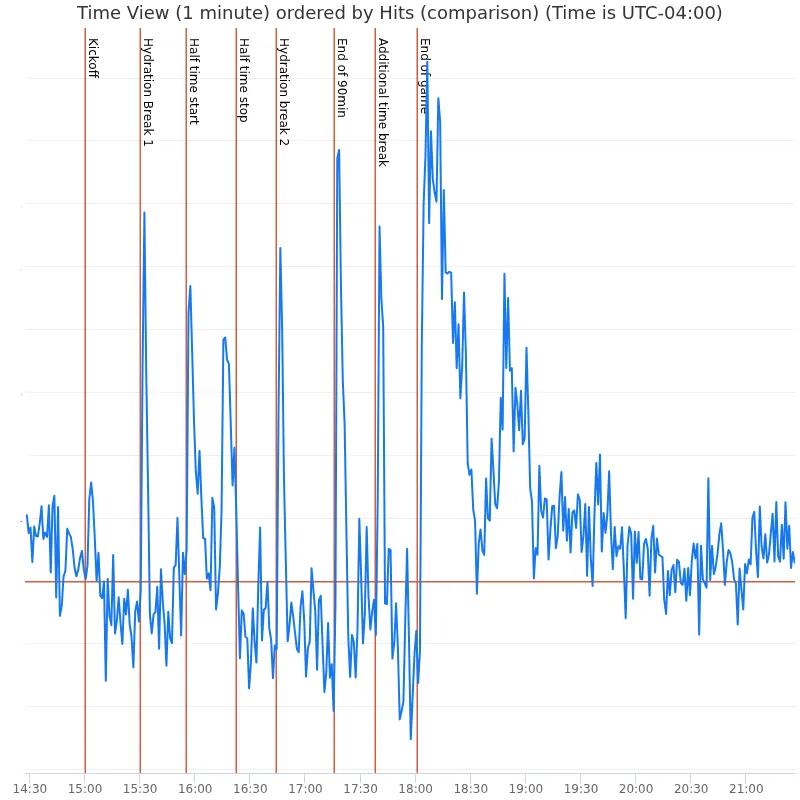
Together with the phased deployment timeline and degradation activation criteria, this is now a reusable runbook for events such as the 2028 Olympics.
WhatsApp: 8.4 Billion Messages in Five Minutes, and Two Playbook Moves Skipped
Goals and the final whistle drove WhatsApp spikes lasting four to five minutes each. In its highest-traffic five-minute window, WhatsApp delivered nearly 8.4 billion messages without interruption. More than 100 internal services had been load-tested and resized ahead of the tournament, then retested, revalidated and resized as the bracket narrowed.
Two standard practices were deliberately dropped.
No load shifting between regions. The usual approach spreads demand across regions so quieter parts of the world absorb the spike — workable when peaks land hours apart, as on a global New Year's Eve. Here every region peaked in the same instant, leaving no idle capacity to borrow. Regional demand was forecast on its own terms rather than derived from a global multiplier.
No freeze. Major events normally bring a pause on continuous deployment and on riskier operations such as disaster recovery exercises. On the strength of years of reliability work, the freeze was skipped entirely. Teams shipped on their normal cadence throughout the event window, including during the peak moment itself.
Preparedness as Standing Capacity
Connecting people in these moments is the product of infrastructure and product teams working as one across 48 teams and 104 matches. Capacity planning, load testing, traffic management and rapid incident response are sustained year-round so that the collective moment — an entire continent reacting to a last-minute goal in the same second — arrives on systems that were already waiting for it.