
A new path to observability
GitHub’s observability tooling has long relied on a familiar trio: statsd for metrics, syslog for plain-text logs, and OpenTracing for request traces. Those components do their jobs, but each new system still ends up solving the same telemetry problems from scratch. The cracks show in the details: multiple parts of GitHub’s infrastructure speak different statsd dialects, forcing special-case code in various places. Even the vocabulary differs between components, so a simple investigation can turn into a slog when you’re trying to follow a single GitHub.com request across metrics, traces, logs, and exceptions.
The fix GitHub is betting on is OpenTelemetry. It offers a single, vendor-neutral format for all telemetry signals via OTLP, and it makes those signals much easier to correlate. The SDKs also cut down on busywork: because they’re extensible, engineers won’t need to re-instrument applications if GitHub switches telemetry backends, and one client SDK per language makes it straightforward to spread best practices across codebases.
Why tracing comes first
Right now GitHub is concentrating its OpenTelemetry efforts on the tracing signal. The reasoning is that in a distributed-systems world, tracing is the clearest entry point to observability—and once traces are in place, related signals can follow naturally. Backends can derive many metrics automatically, trace events can be turned into detailed logs, and exceptions can be routed to tracking systems without extra manual instrumentation.
GitHub is building opinionated internal helper libraries around OpenTelemetry so engineers don’t have to reinvent tracing for each new service. A small example: those helpers automatically suppress trace emission during tests, keeping test suites fast and clean:
# in an initializer, or config/application.rb
OpenTelemetry::SDK.configure do |c|
  if Rails.env.test?
    c.add_span_processor(
      # In production, you almost certainly want BatchSpanProcessor!
      OpenTelemetry::SDK::Trace::Export::SimpleSpanProcessornew(
        OpenTelemetry::SDK::Trace::Export::NoopSpanExporter.new
      )
    )
  end
end
The OpenTelemetry ecosystem already includes auto-instrumentation for many common libraries, like the Ruby Postgres adapter. GitHub believes that careful use of auto-instrumentation can give developers a solid foundation they can customize. In a Rails app with previously no tracing at all, this short setup was enough to get useful insights:
# in an initializer, or config/application.rb
OpenTelemetry::SDK.configure do |c|
  c.use 'OpenTelemetry::Instrumentation::Rails'
  c.use 'OpenTelemetry::Instrumentation::PG', enable_sql_obfuscation: true
  c.use 'OpenTelemetry::Instrumentation::ActiveJob'
  # This application makes a variety of outbound HTTP calls, with a variety of underlying
  # HTTP client libraries - you may not need this many!
  c.use 'OpenTelemetry::Instrumentation::Faraday'
  c.use 'OpenTelemetry::Instrumentation::Net::HTTP'
  c.use 'OpenTelemetry::Instrumentation::RestClient'
end
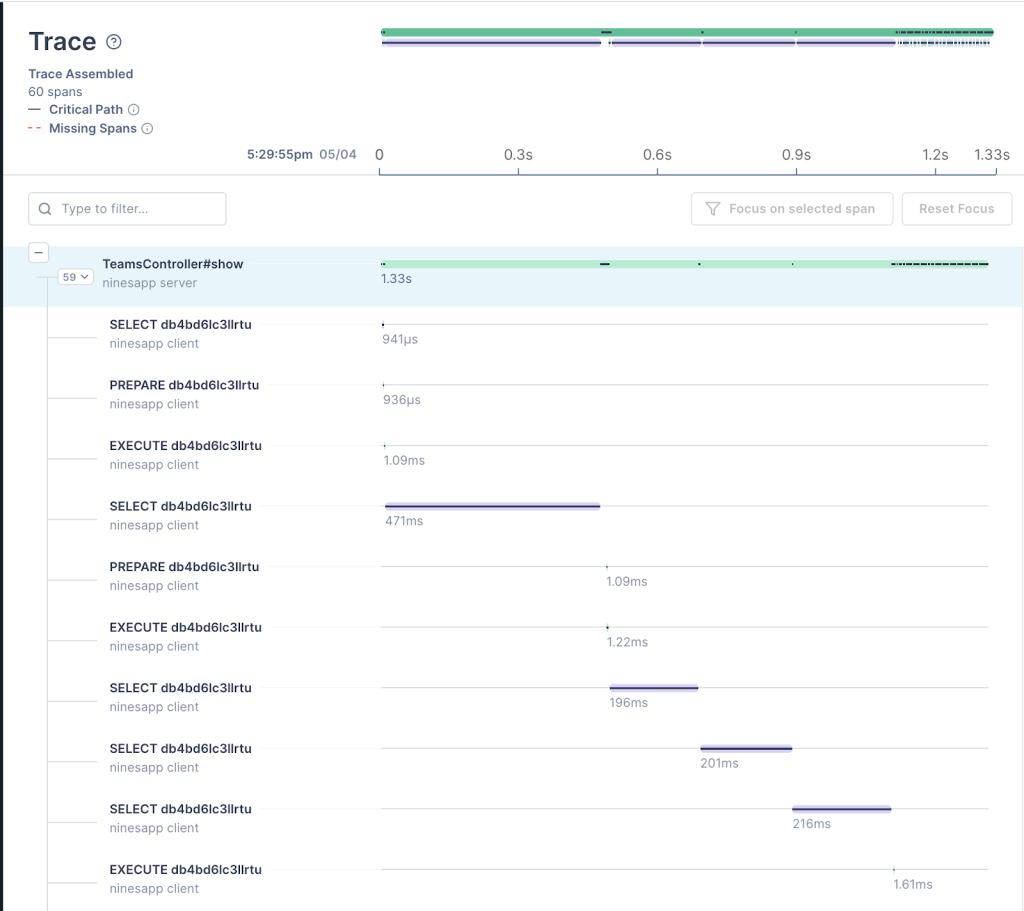
That snippet is the standard OpenTelemetry SDK configuration—each c.use line loads and initializes one set of auto-instrumentation. From there, a poorly performing page becomes immediately diagnosable. This trace below, produced purely by auto-instrumentation, shows a full picture of the database operations:
Correlating signals, and what comes next
GitHub is also working to automatically correlate its existing signals, using tracing as the root. For example, adding trace identifiers to log lines automatically connects request traces with logs. Longer-term plans include auto-generating useful dashboards, alerts, and tools for teams from those correlated signals. Once the tracing work is solid, GitHub will shift its attention to logging and metrics for cases where traces aren’t enough. The company is also contributing its work back to the OpenTelemetry project.
OpenTelemetry is a CNCF project with an intentionally wide scope, and GitHub sees it as a potential industry-wide change in how we observe and understand systems. If you’re interested in that direction, the OpenTelemetry community is open to contributors, and GitHub itself is hiring for its internal developer experience work.


