What a Website Actually Costs
It is easy to think of the web as something ephemeral: a request goes out, a page comes back, and no physical process seems to have occurred. That impression is reinforced by industry terminology like “cloud” and “serverless.” But every request a browser makes travels through a tangible chain of hardware — switches, routers, modems, cables — all of which were manufactured and all of which consume electricity.
That hardware footprint extends to the estimated 20 billion connected devices worldwide. Every page view therefore carries a real, measurable carbon cost. The Website Carbon Calculator estimates the average page produces 1.76 grams of CO2 per view. For a site with thousands of weekly visitors, those grams become kilograms quickly.
Speed Is an Environmental Metric
The connection between performance and emissions is straightforward: a page that requires more server work, more client rendering, and more data transfer consumes more electricity. That electricity, whether generated from fossil fuels or renewables, releases carbon. Slow pages and high-emission pages are not separate problems — they are symptoms of the same underlying causes.
Data supports this relationship. A study of home pages from the 500 most popular websites, measured against Google’s PageSpeed Insights and the Website Carbon Calculator on 14 July 2021, found a clear correlation. Pages with a perfect PageSpeed score of 100 averaged about 1 gram of carbon per view. Pages scoring zero projected to almost 6 grams. The variation between individual sites was high, but the trend was consistent: faster pages emit less.
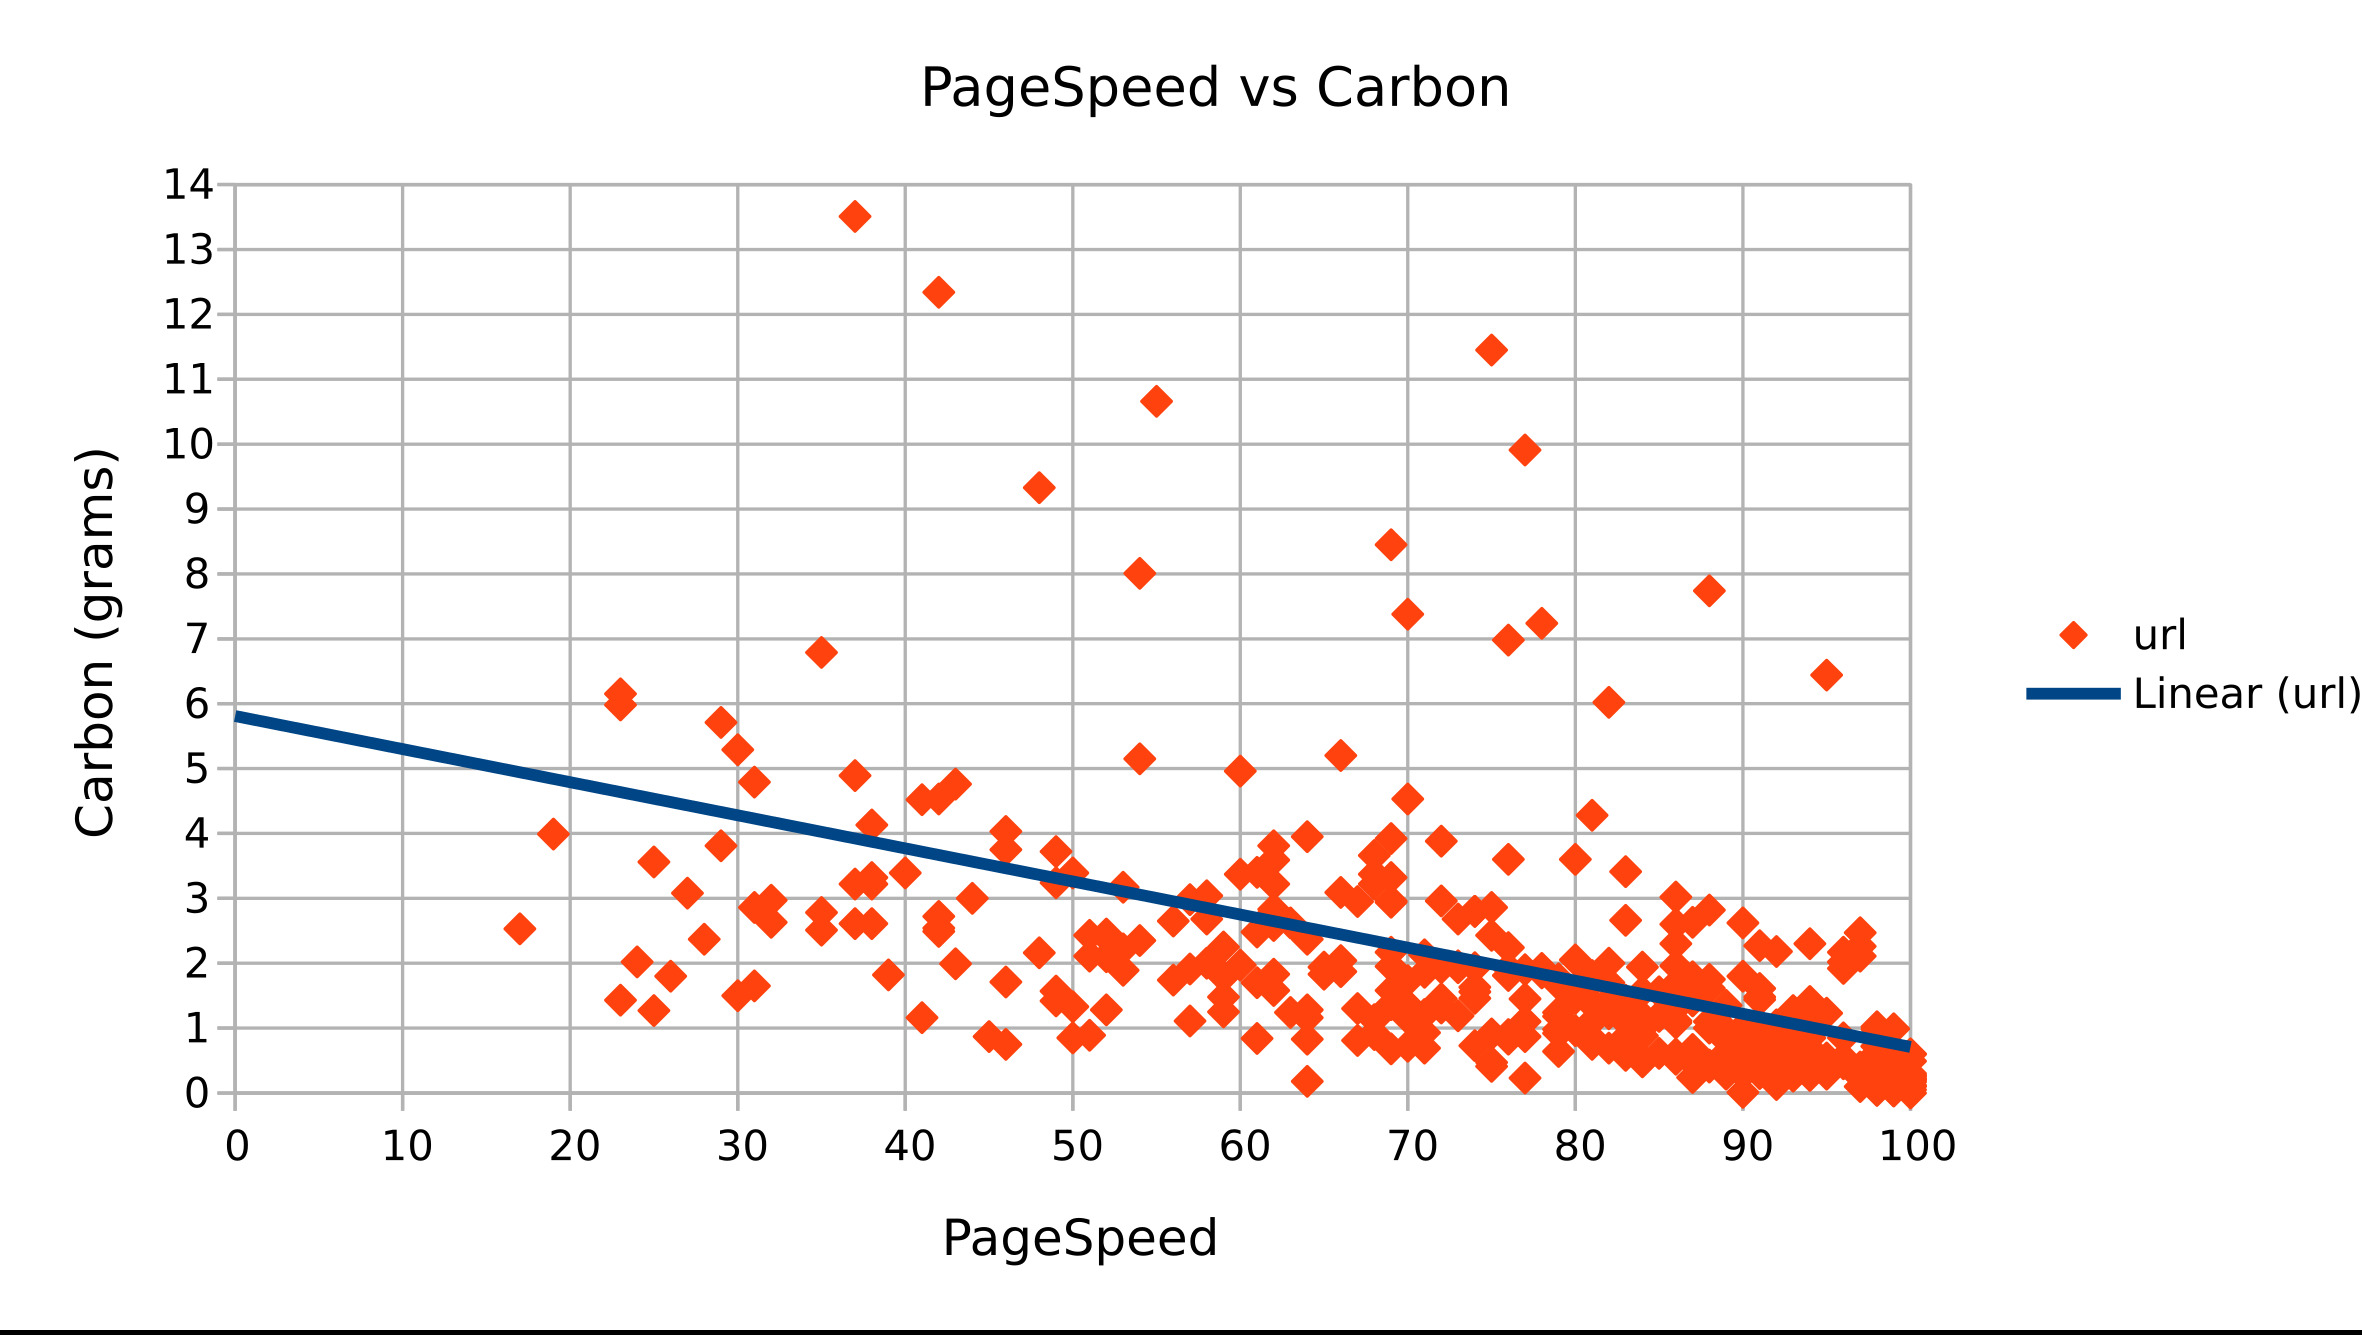
That correlation is useful because it gives developers a concrete lever. Not everything affecting a page's emissions is within a developer's control — the user's device and the network path are outside it — but page performance is not.
Rendering Cost Is the Hidden Tax
Image optimization is often discussed in terms of file size, but decoding and rendering are equally important — especially on mobile hardware. A redesign of a personal blog illustrated the difference. The old design used a full-height header photograph with srcset to serve appropriately sized images. On mobile, largest contentful paint (LCP) was almost 3 seconds. Shrinking the header image to a page-title background cut LCP to about 1.5 seconds. Desktop users saw no difference — both versions were well under a second — but the carbon impact changed dramatically: from 0.31 grams per view down to 0.05 grams.


Image format also affects decode time. Next-generation formats like AVIF promise much smaller file sizes than JPG at equivalent quality, often at the cost of significantly longer encoding times — bunny.net has observed WebP outperforming AVIF by as much as 100 times in encoding speed. For high-traffic sites, the transfer savings may justify that encoding cost. For smaller sites, the server electricity consumed during encoding could offset the per-view gains. Format choice needs testing, not dogma. The same logic applies to JavaScript: a small file that executes slowly can be more expensive than a larger one that runs quickly.
Round-Trips and Third-Party Assets
Where assets live matters more than most performance budgets acknowledge. Serving frameworks from a central CDN has long been the conventional recommendation, but real-world testing — including work by Harry Roberts — has shown self-hosting is generally faster. A gaming website offered a practical confirmation. It was loading a large CSS framework and third-party assets through a CDN. Moving everything to self-hosting and removing unused framework components produced no visual changes, but the Lighthouse score climbed from 72 to 98 and carbon emissions fell from 0.26 grams per view to 0.15.
The causes are not mysterious. Each third-party request adds a DNS lookup, a connection, and a round-trip. Those network hops cost time and electricity. Self-hosting removes the extra negotiation and lets the browser fetch everything from the same origin it already trusts.
Content Should Earn Its Transfer
The most effective emissions reduction is not sending data at all. Stock photos of smiling people in suits are a common offender. Eye-tracking studies show that users ignore images that are not relevant to the content. When an image is ignored, it is not decoration — it is dead weight that slows loading, consumes electricity, and contributes to emissions with no user benefit.
That principle extends beyond images to every element that is not core content. Styled pages remain necessary — plain text harms readability for many users, including those with dyslexia — but every component on a page should justify its existence. If something does not meaningfully contribute to the user experience, removing it is both a design improvement and an environmental one.
Accessibility Costs Less Than You Think
There’s a persistent myth that accessibility means piling on aria attributes and JavaScript. In practice, the most accessible pages are often the lightest ones — because what you *remove* matters more than what you add.
MDN’s HTML: A Good Basis for Accessibility demonstrates this by recreating a button with a div and custom JavaScript. The fake button weighs about 1,403 bytes uncompressed. A real button with less JavaScript and no styling? 746 bytes. The div version is also semantically meaningless, making it harder for screen readers and bots to interpret. These are minimal examples, but they scale: easier parsing for browsers means easier parsing for developers too.
Refactoring For Semantics And Size
The author recently refactored a production site’s HTML, stripping redundant title attributes and replacing divs with semantic elements. A page that previously weighed 34,168 bytes dropped to 32,805 bytes after restructuring:
<div class="container">
    <section>
        <div class="row">

            <div class="col-md-3">
                <aside>
                    <!-- Sidebar content here -->
                </aside>
            </div>

            <div class="col-md-9">
                <!-- Main content here -->
                <h4>Content piece heading</h4>
                <p>
                    Some items;<br>
                    Item 1 <br>
                    Item 2 <br>
                    Item 3 <br>
                <br>
                </p>
                <!-- More main content here -->
            </div>

        </div>
    </section>
</div>
<div class="container">
<div class="row">
<main class="col-md-9 col-md-push-3">
<!-- Main content here -->
<h3>Content piece heading</h3>
<p>Some items;</p>
<ul>
<li>Item 1</li>
<li>Item 2</li>
<li>Item 3</li>
</ul>
<!-- More main content here -->
</main>
<aside class="col-md-3 col-md-pull-9">
<!-- Sidebar content here -->
</aside>
</div>
</div>The work is ongoing, but the markup already scores better in WebAIM, Lighthouse, and manual testing. Averaging five Chrome profiles, HTML parse time fell by about 2 milliseconds. No single change is perceptible, but every byte has a cost — to users and to the environment. Accessibility work often doubles as performance work.
The Heavy Cost Of Video
Video is the elephant in the room when it comes to emissions. For context, Project Gutenberg’s HTML edition of The Complete Works of William Shakespeare is roughly 7.4 MB uncompressed. Per Android Authority, a 360p YouTube video consumes about 5–7.5 MB per minute, and 1080p runs 50–68 MB per minute. So the entire Shakespeare canon costs less bandwidth than seven seconds of HD video. Encoding and decoding video is also processor-intensive, a major factor behind estimates of Netflix emissions reaching 3.2 kg of CO₂ per hour.
Video is inherently demanding on connectivity, which excludes people with slower or metered connections. Making video accessible is possible but not simple, and many sites skip it entirely. The trouble is that video has become the *only* way to find information on countless pages. YouTube’s monthly user base exploded from 20 million in 2006 to 2 billion in 2020, yet many top platforms still don’t fully meet accessibility legislation.
Plain text, by contrast, is handled natively by a wide range of assistive technologies. It converts easily between formats and contexts. And as the Shakespeare example shows, it is extraordinarily space-efficient — carrying a far smaller carbon footprint than any other human-readable medium on the web.
Video has its place, and visual learners benefit enormously from watching processes in action. But it also excludes people and costs the environment. The practical rule: make text the default, and treat audio and video as progressive enhancements layered on top.
Small Changes, Amplified Impact
Running a page through the Website Carbon Calculator can be demoralizing — discovering that a single page emits hundreds of kilograms of CO₂ per year is a tough read. But the web’s scale amplifies positive changes just as powerfully. Improvements that are imperceptible on a single view compound rapidly on a site with thousands of weekly visitors.
The trend line isn’t uniformly bleak. A 25-year-old website like Space Jam grew 39 times in size after a redesign, but others are deliberately shrinking — designers are building for data poverty, and developers have found ways to deliver WordPress in 7 KB. Cutting emissions means making sites faster, and faster sites benefit everyone.
Further Exploration
- World Wide Waste, Gerry McGovern
- Is WebP Really Better Than JPEG?, Johannes Siipola
- Make Jamstack Slow? Challenge Accepted., Steve Keep
- Can the Internet Ever Be Green?, BBC The Climate Question
- Could Your Data Center Not Just Power Your Website, But Also Grow Your Salad?, Tom Greenwood
- Sustainable Web Manifesto


