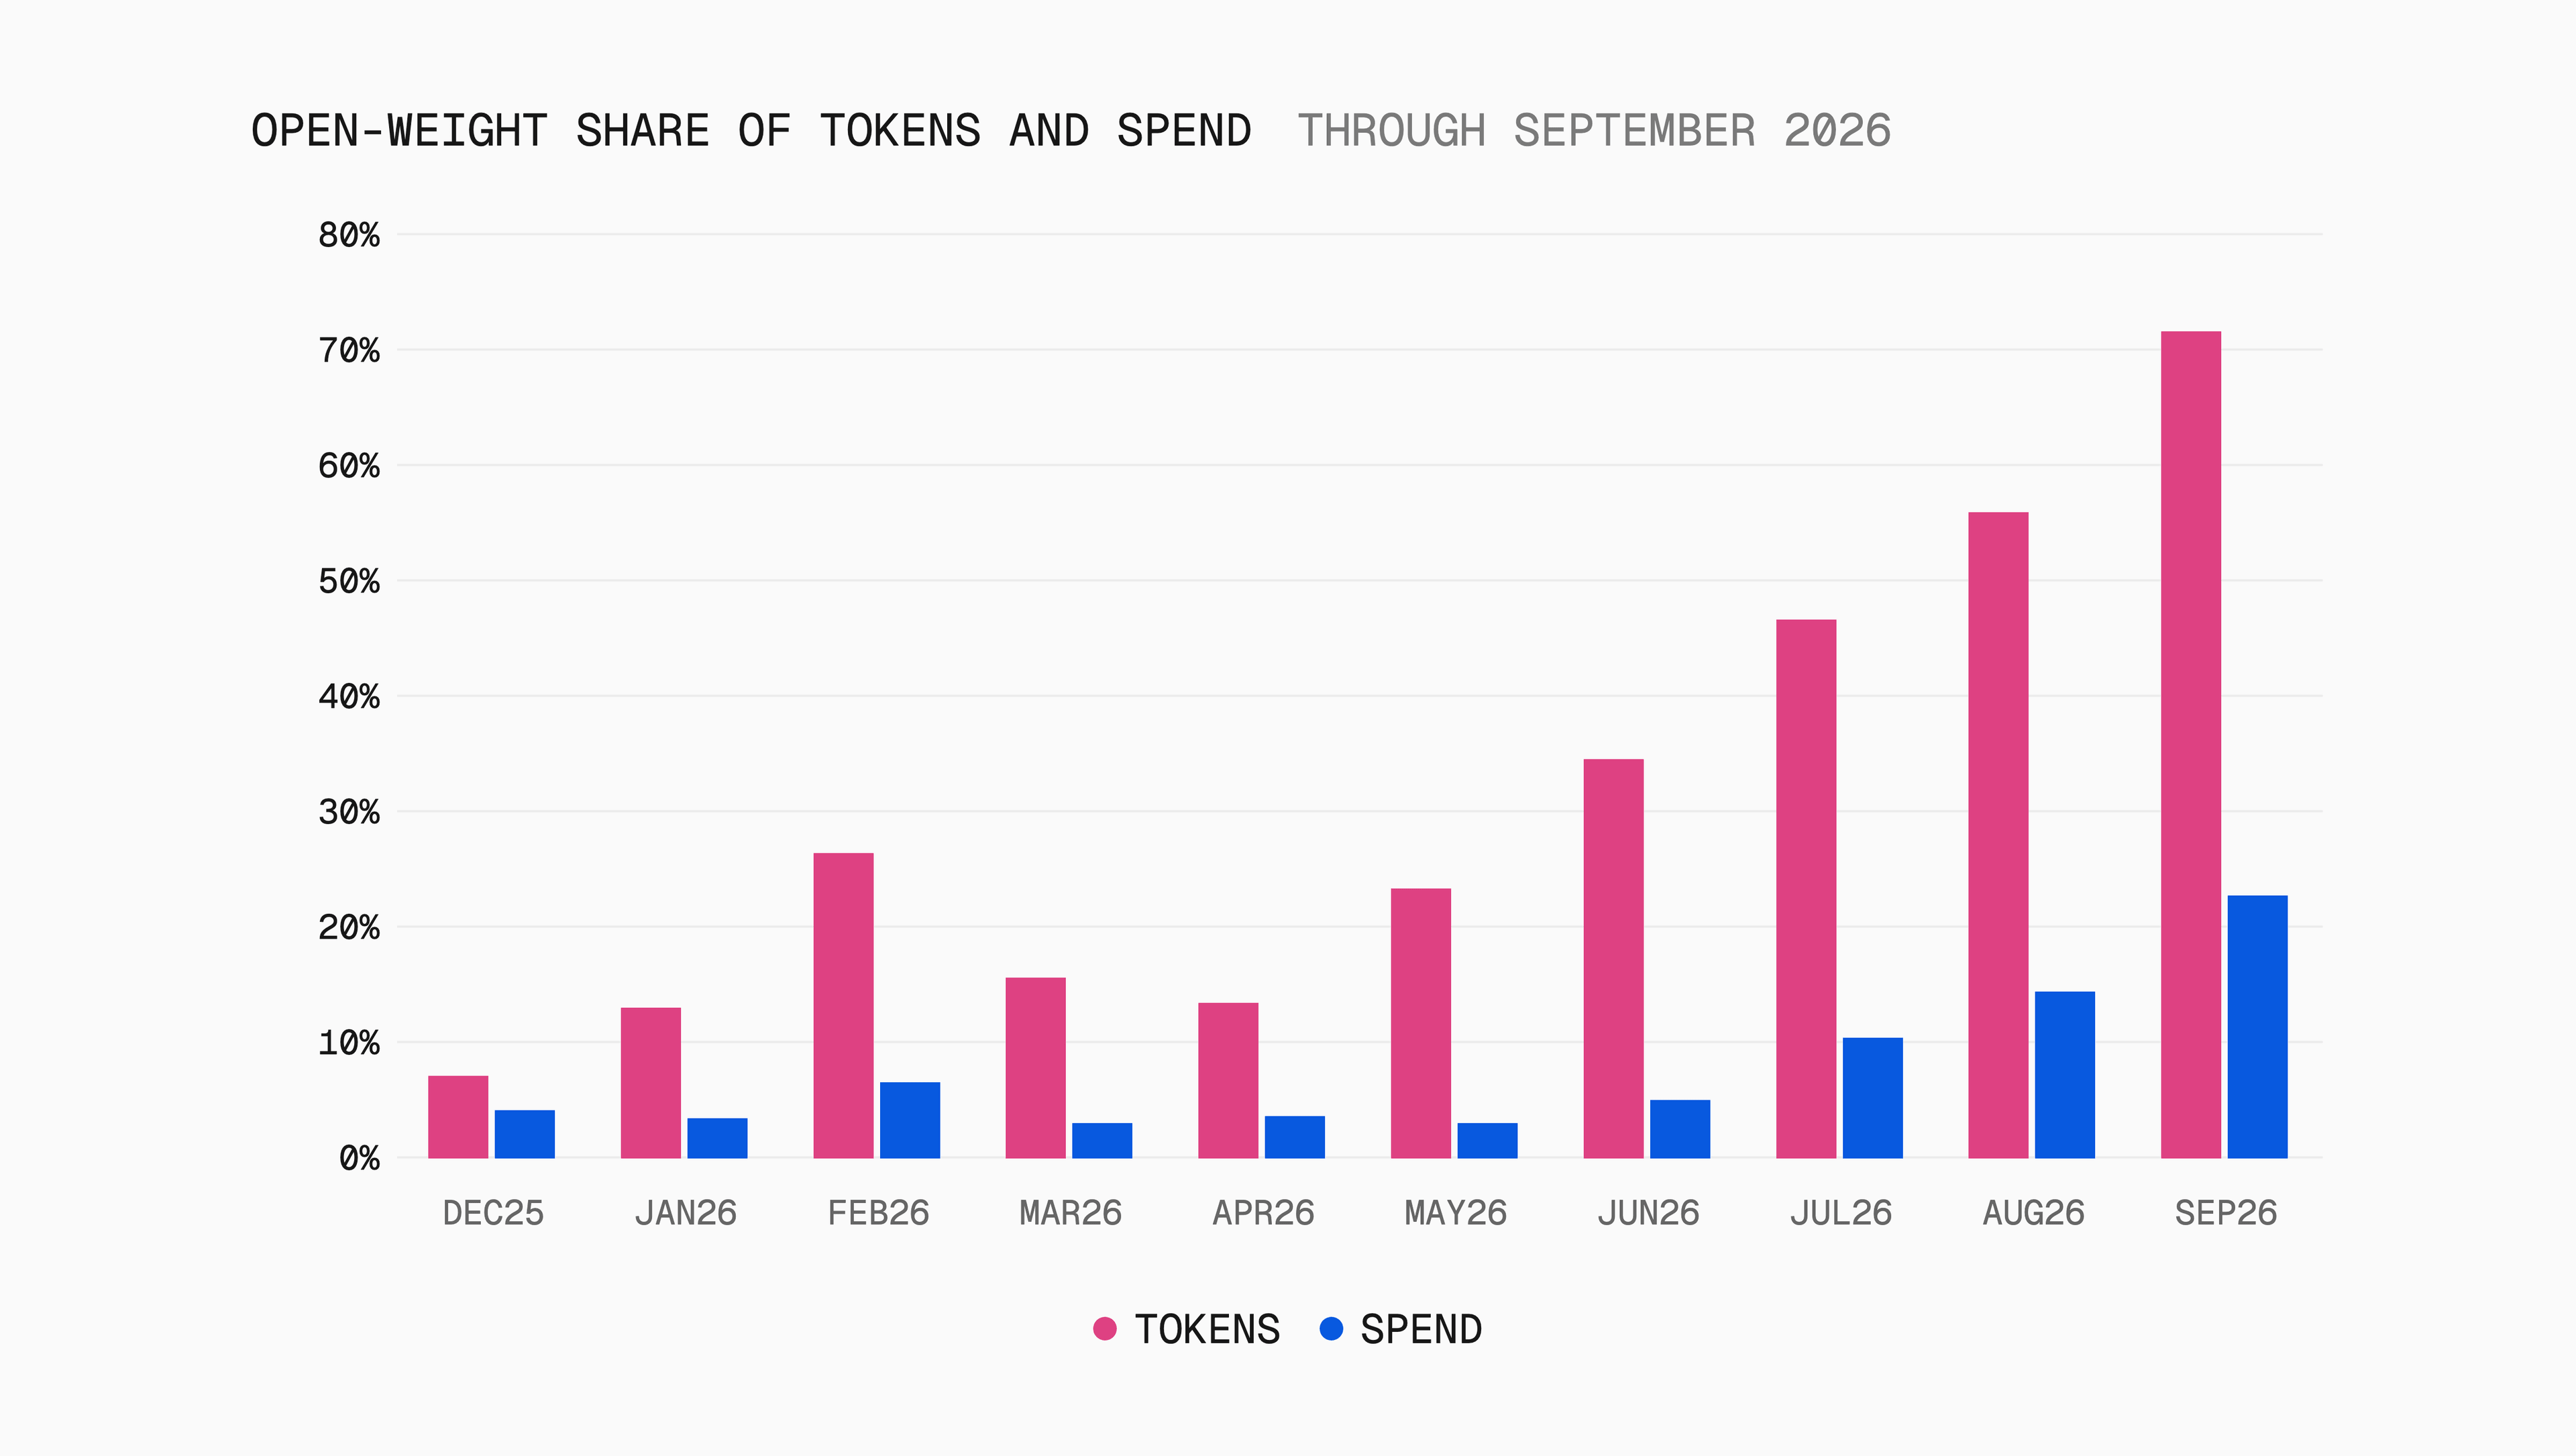
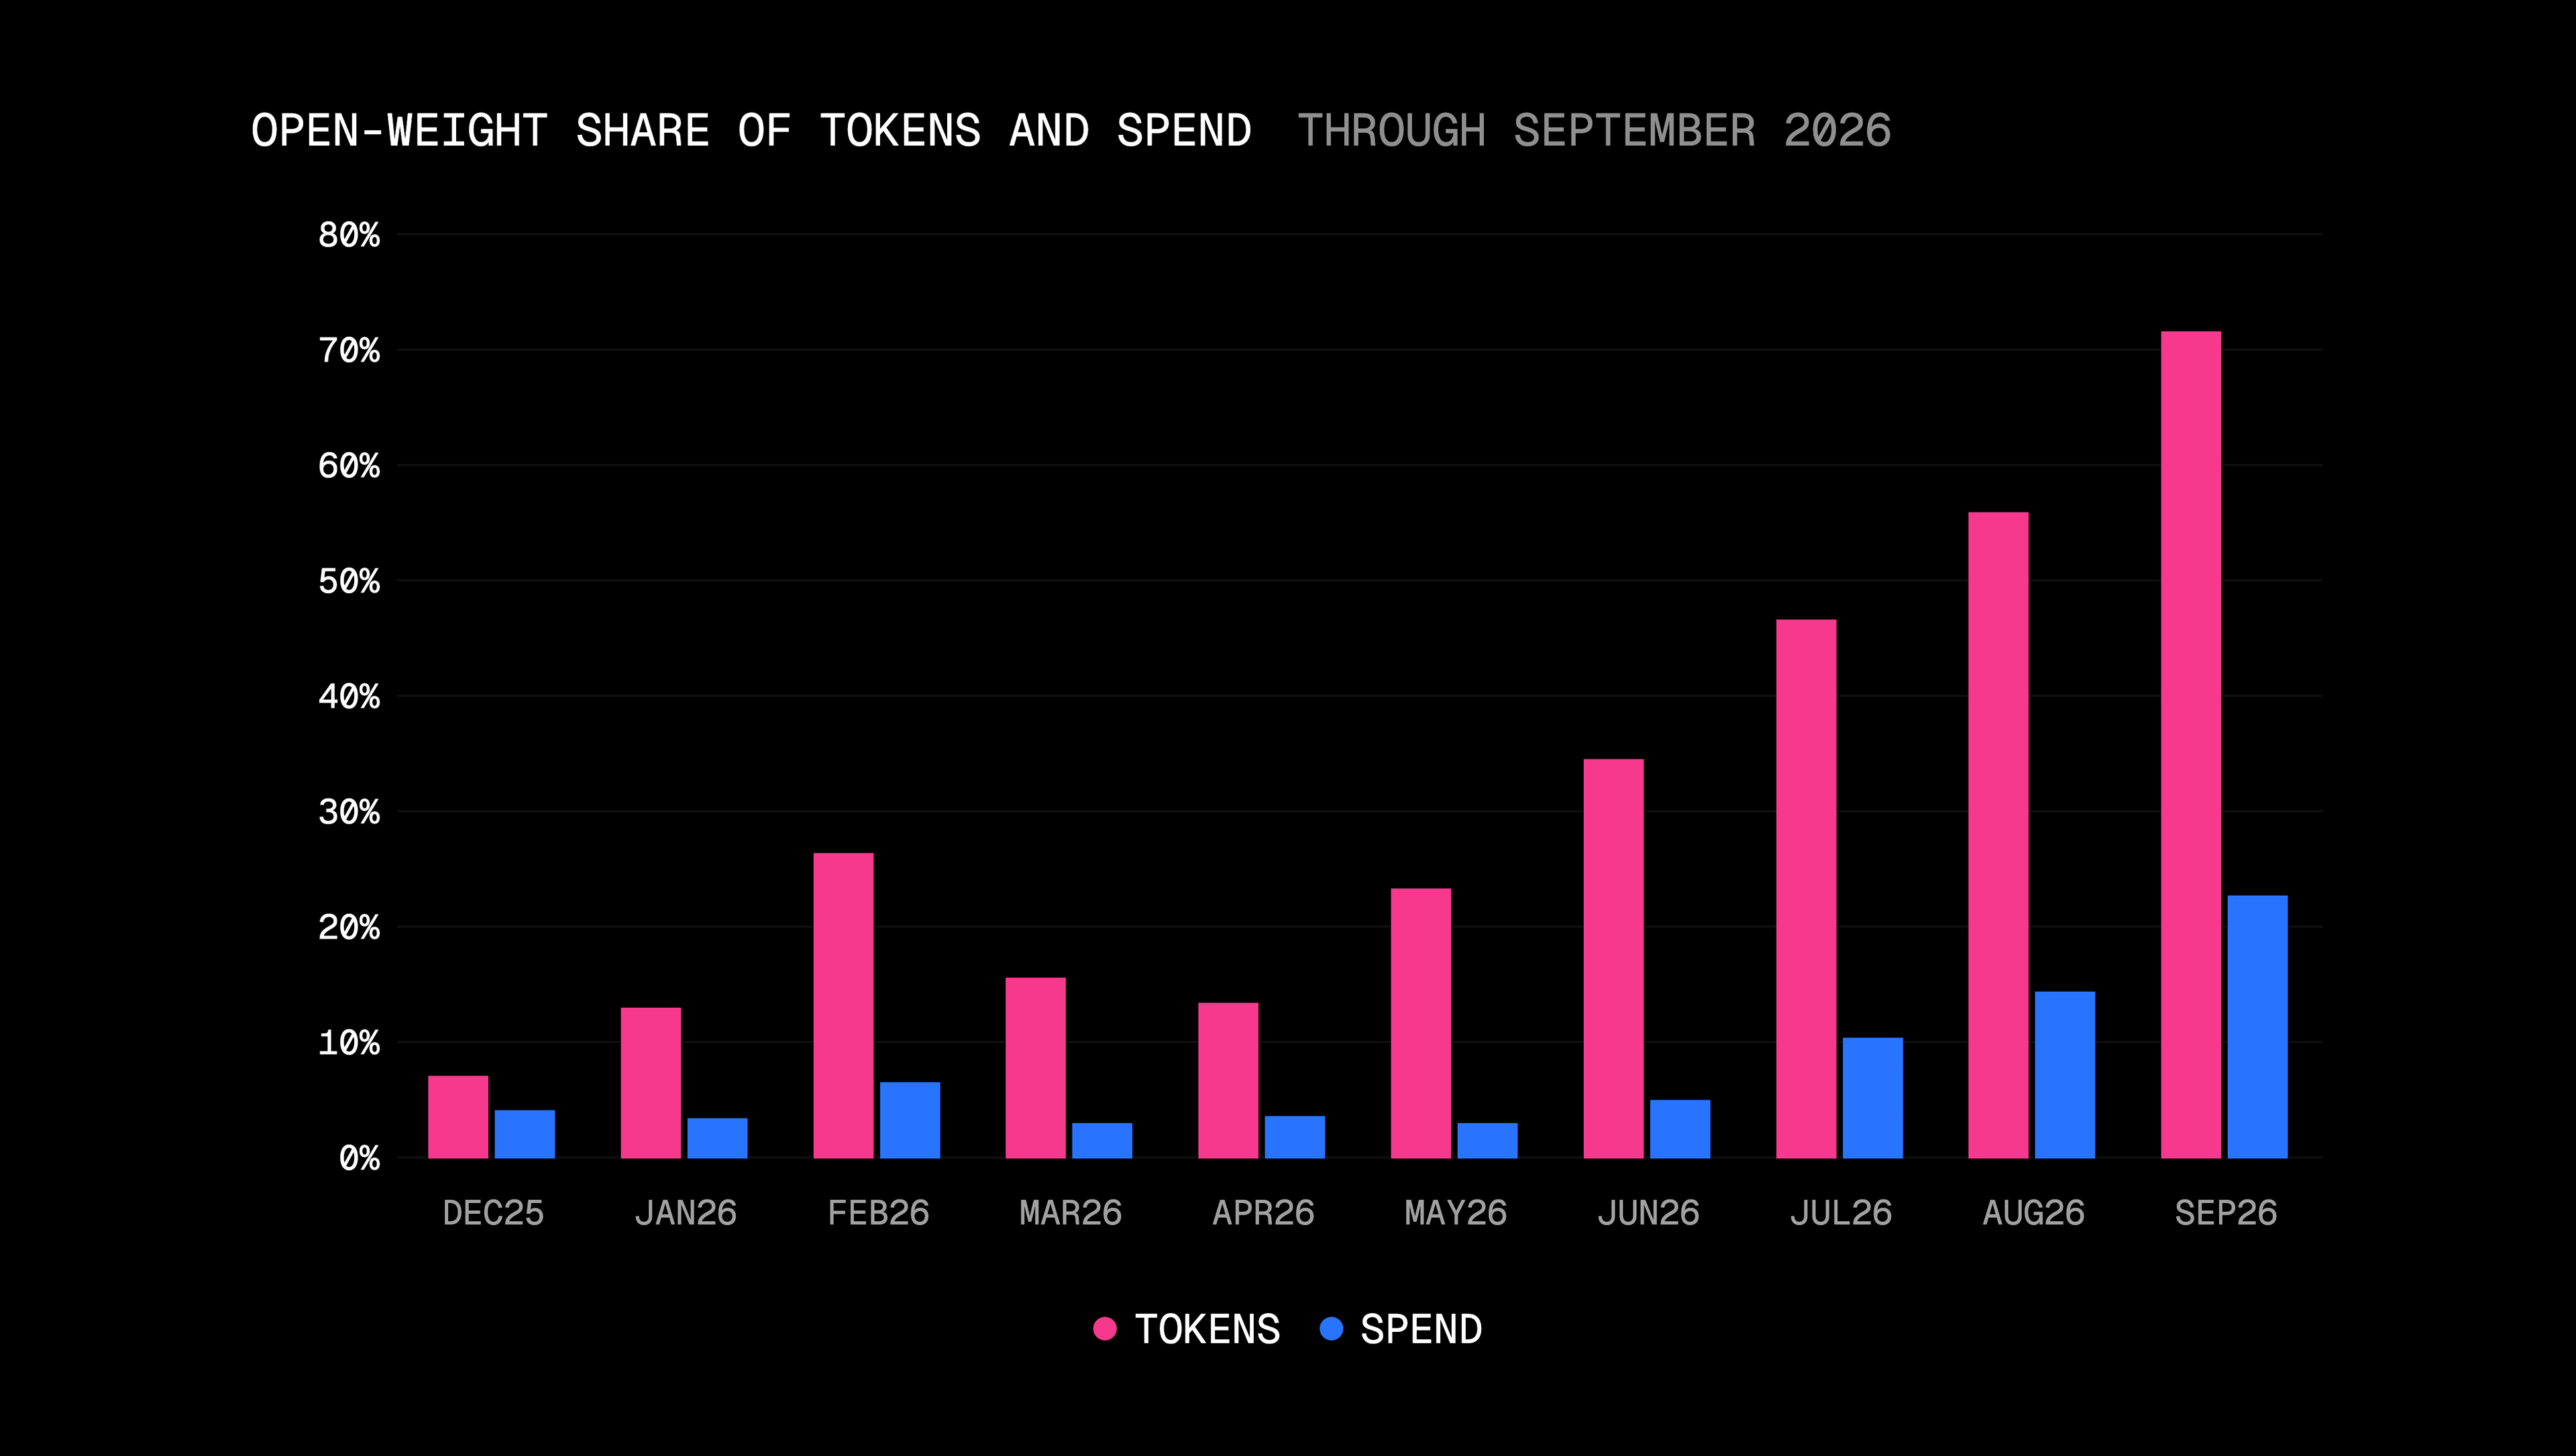
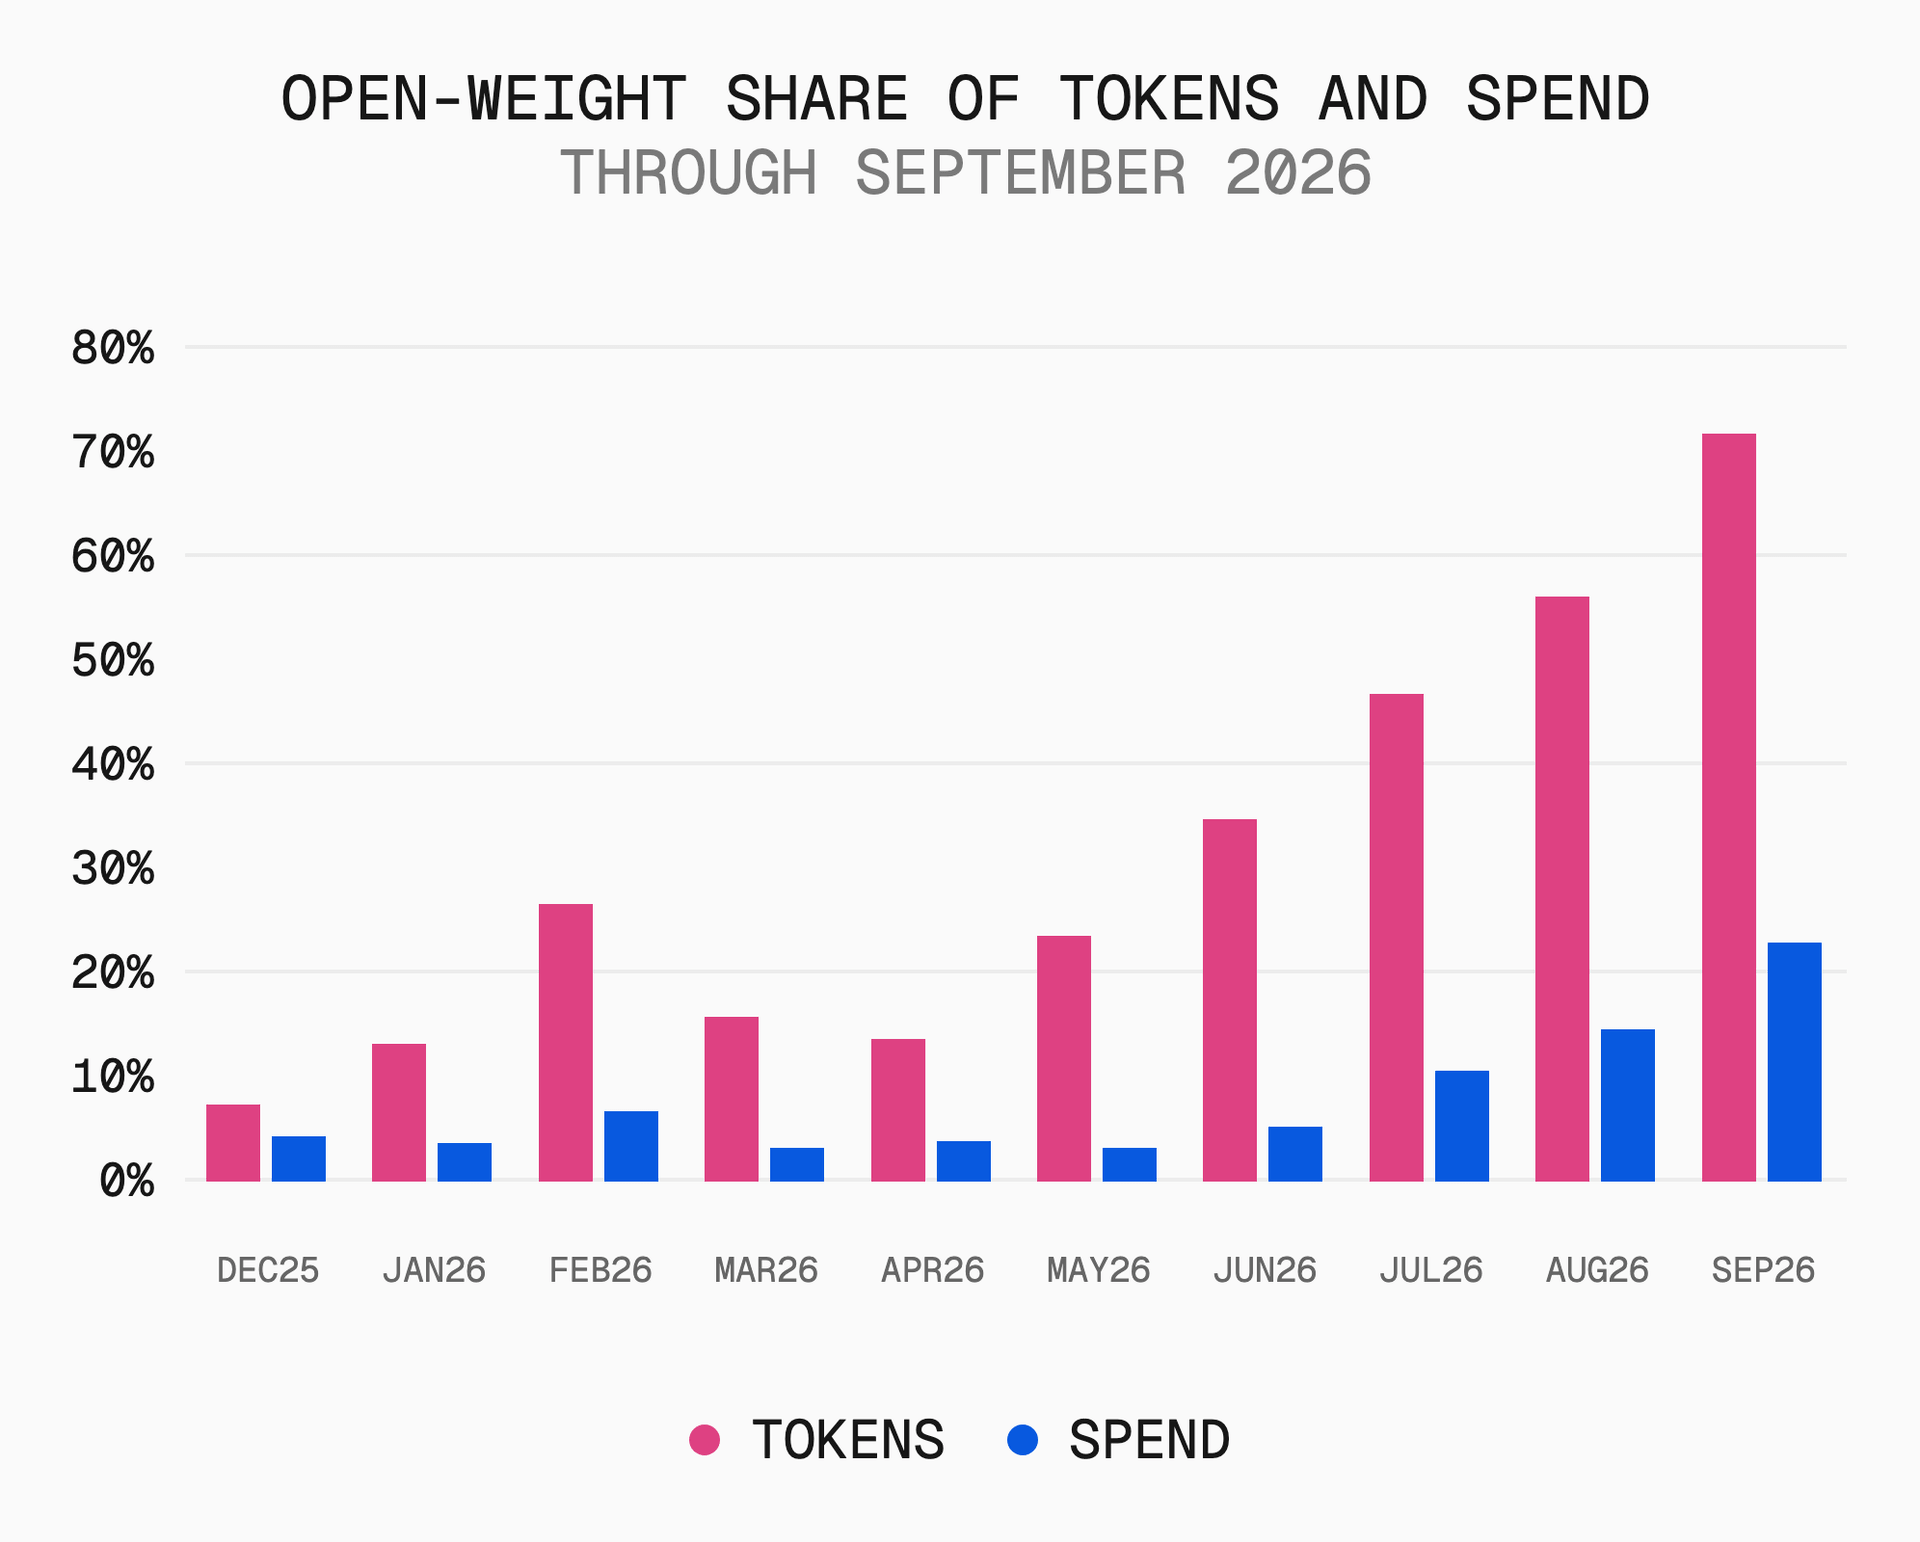
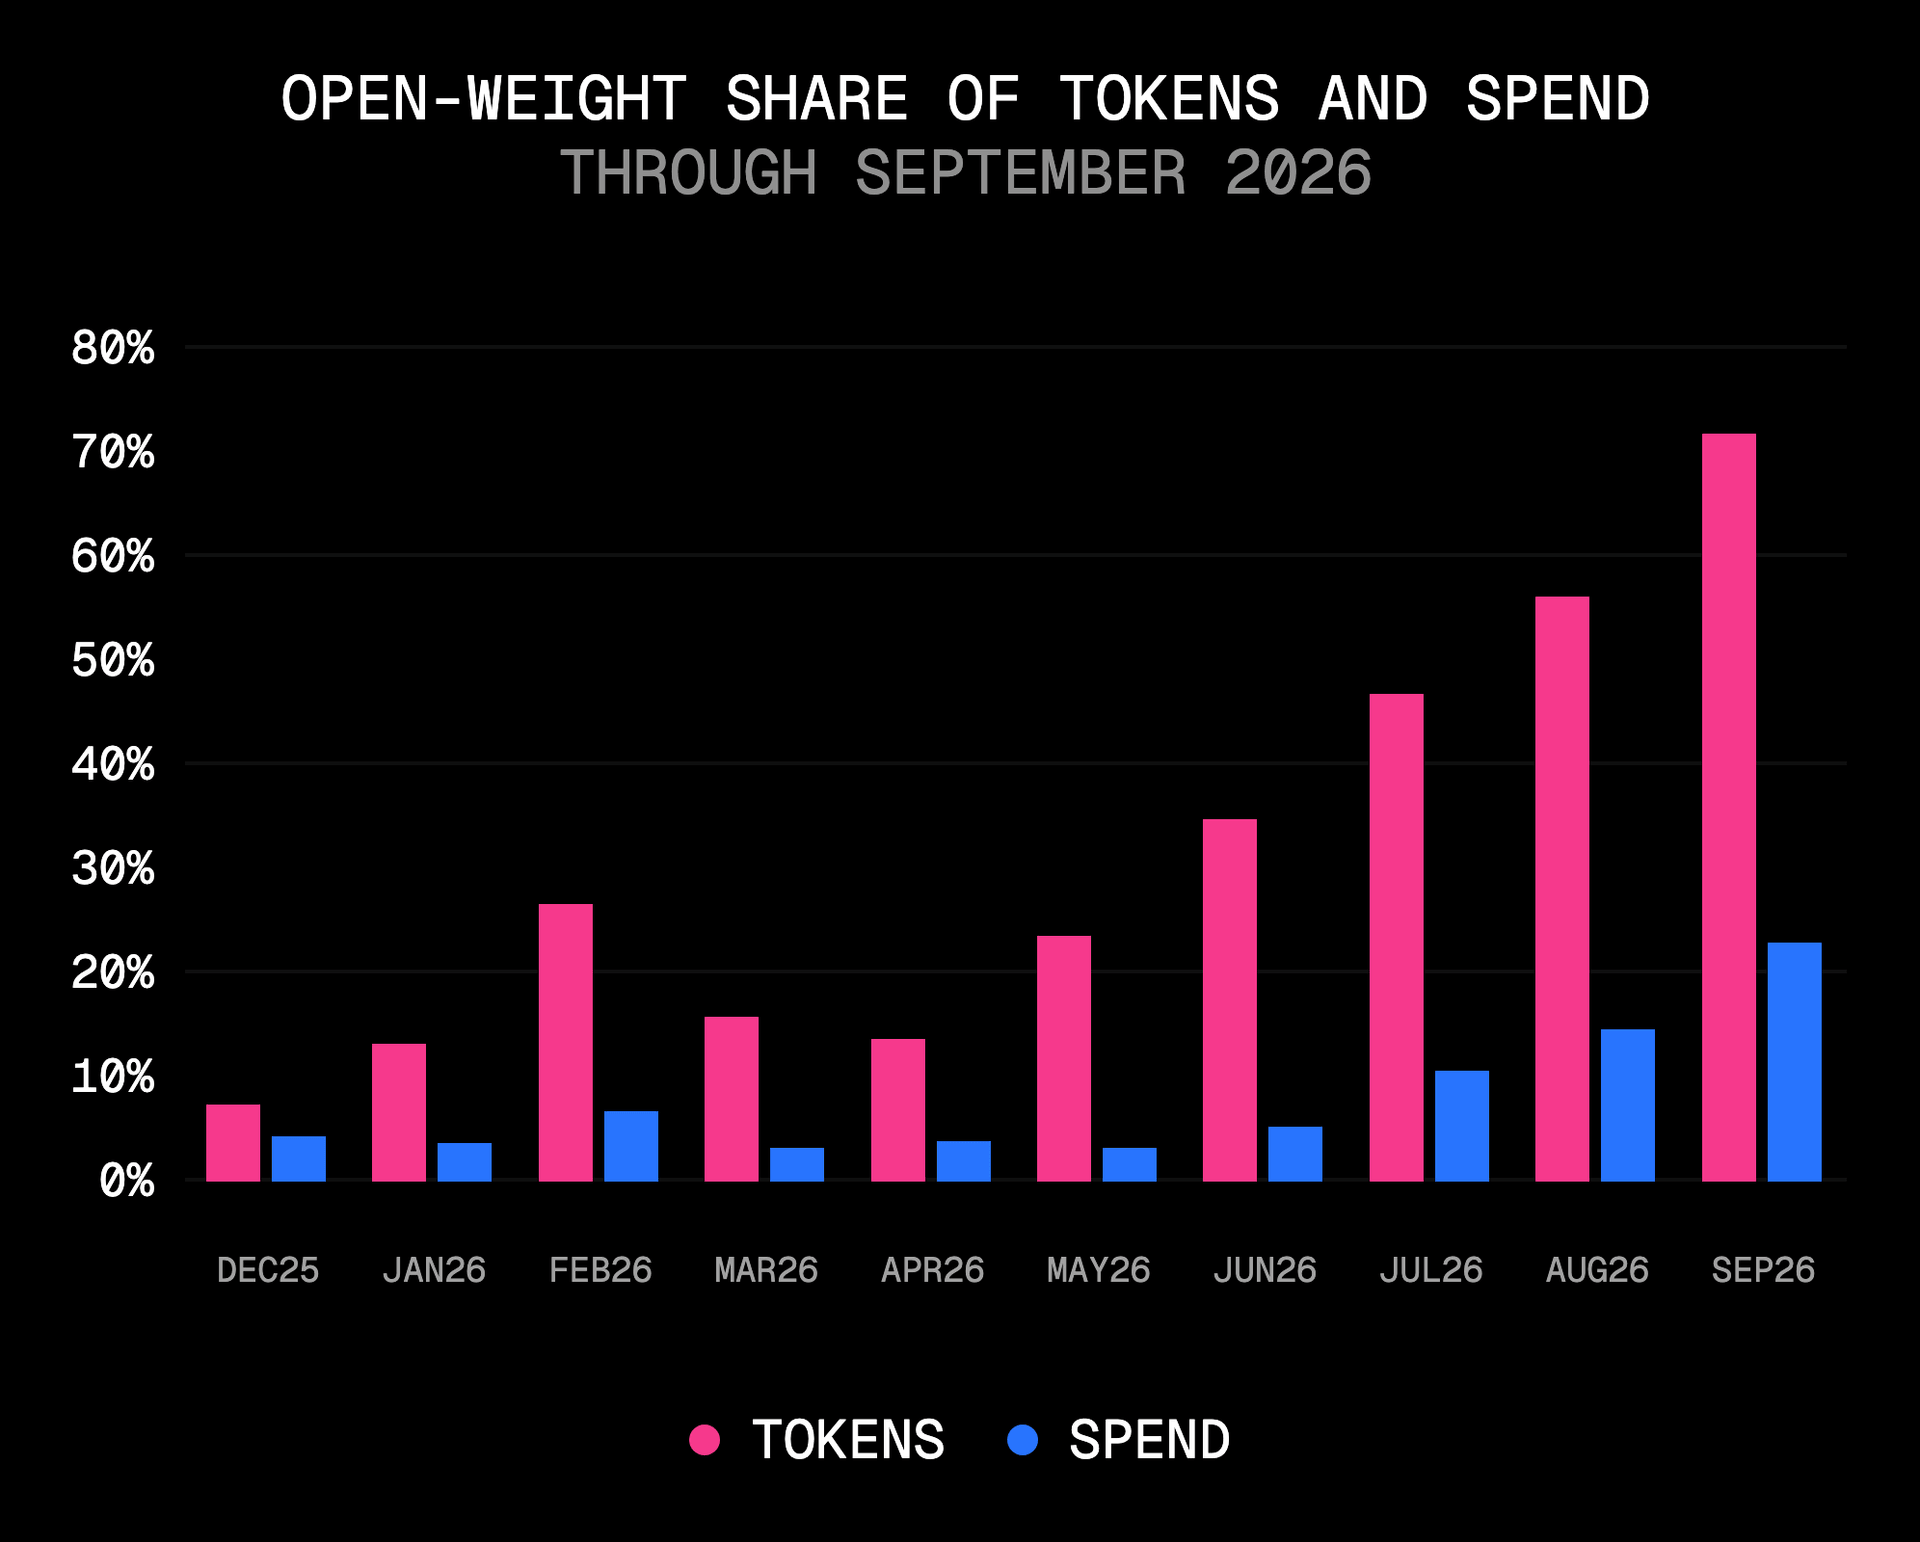
Open-weight models took 71.5% of tokens routed through Vercel AI Gateway and nearly a quarter of gateway dollars in September, according to the October 2026 edition of the AI Gateway Production Index. Their spend share has more than quadrupled since June, when open weight accounted for one in twenty gateway dollars. September delivered the largest single-month gains in both open-weight token share and spend share in the index's history.
Where the open-weight money goes
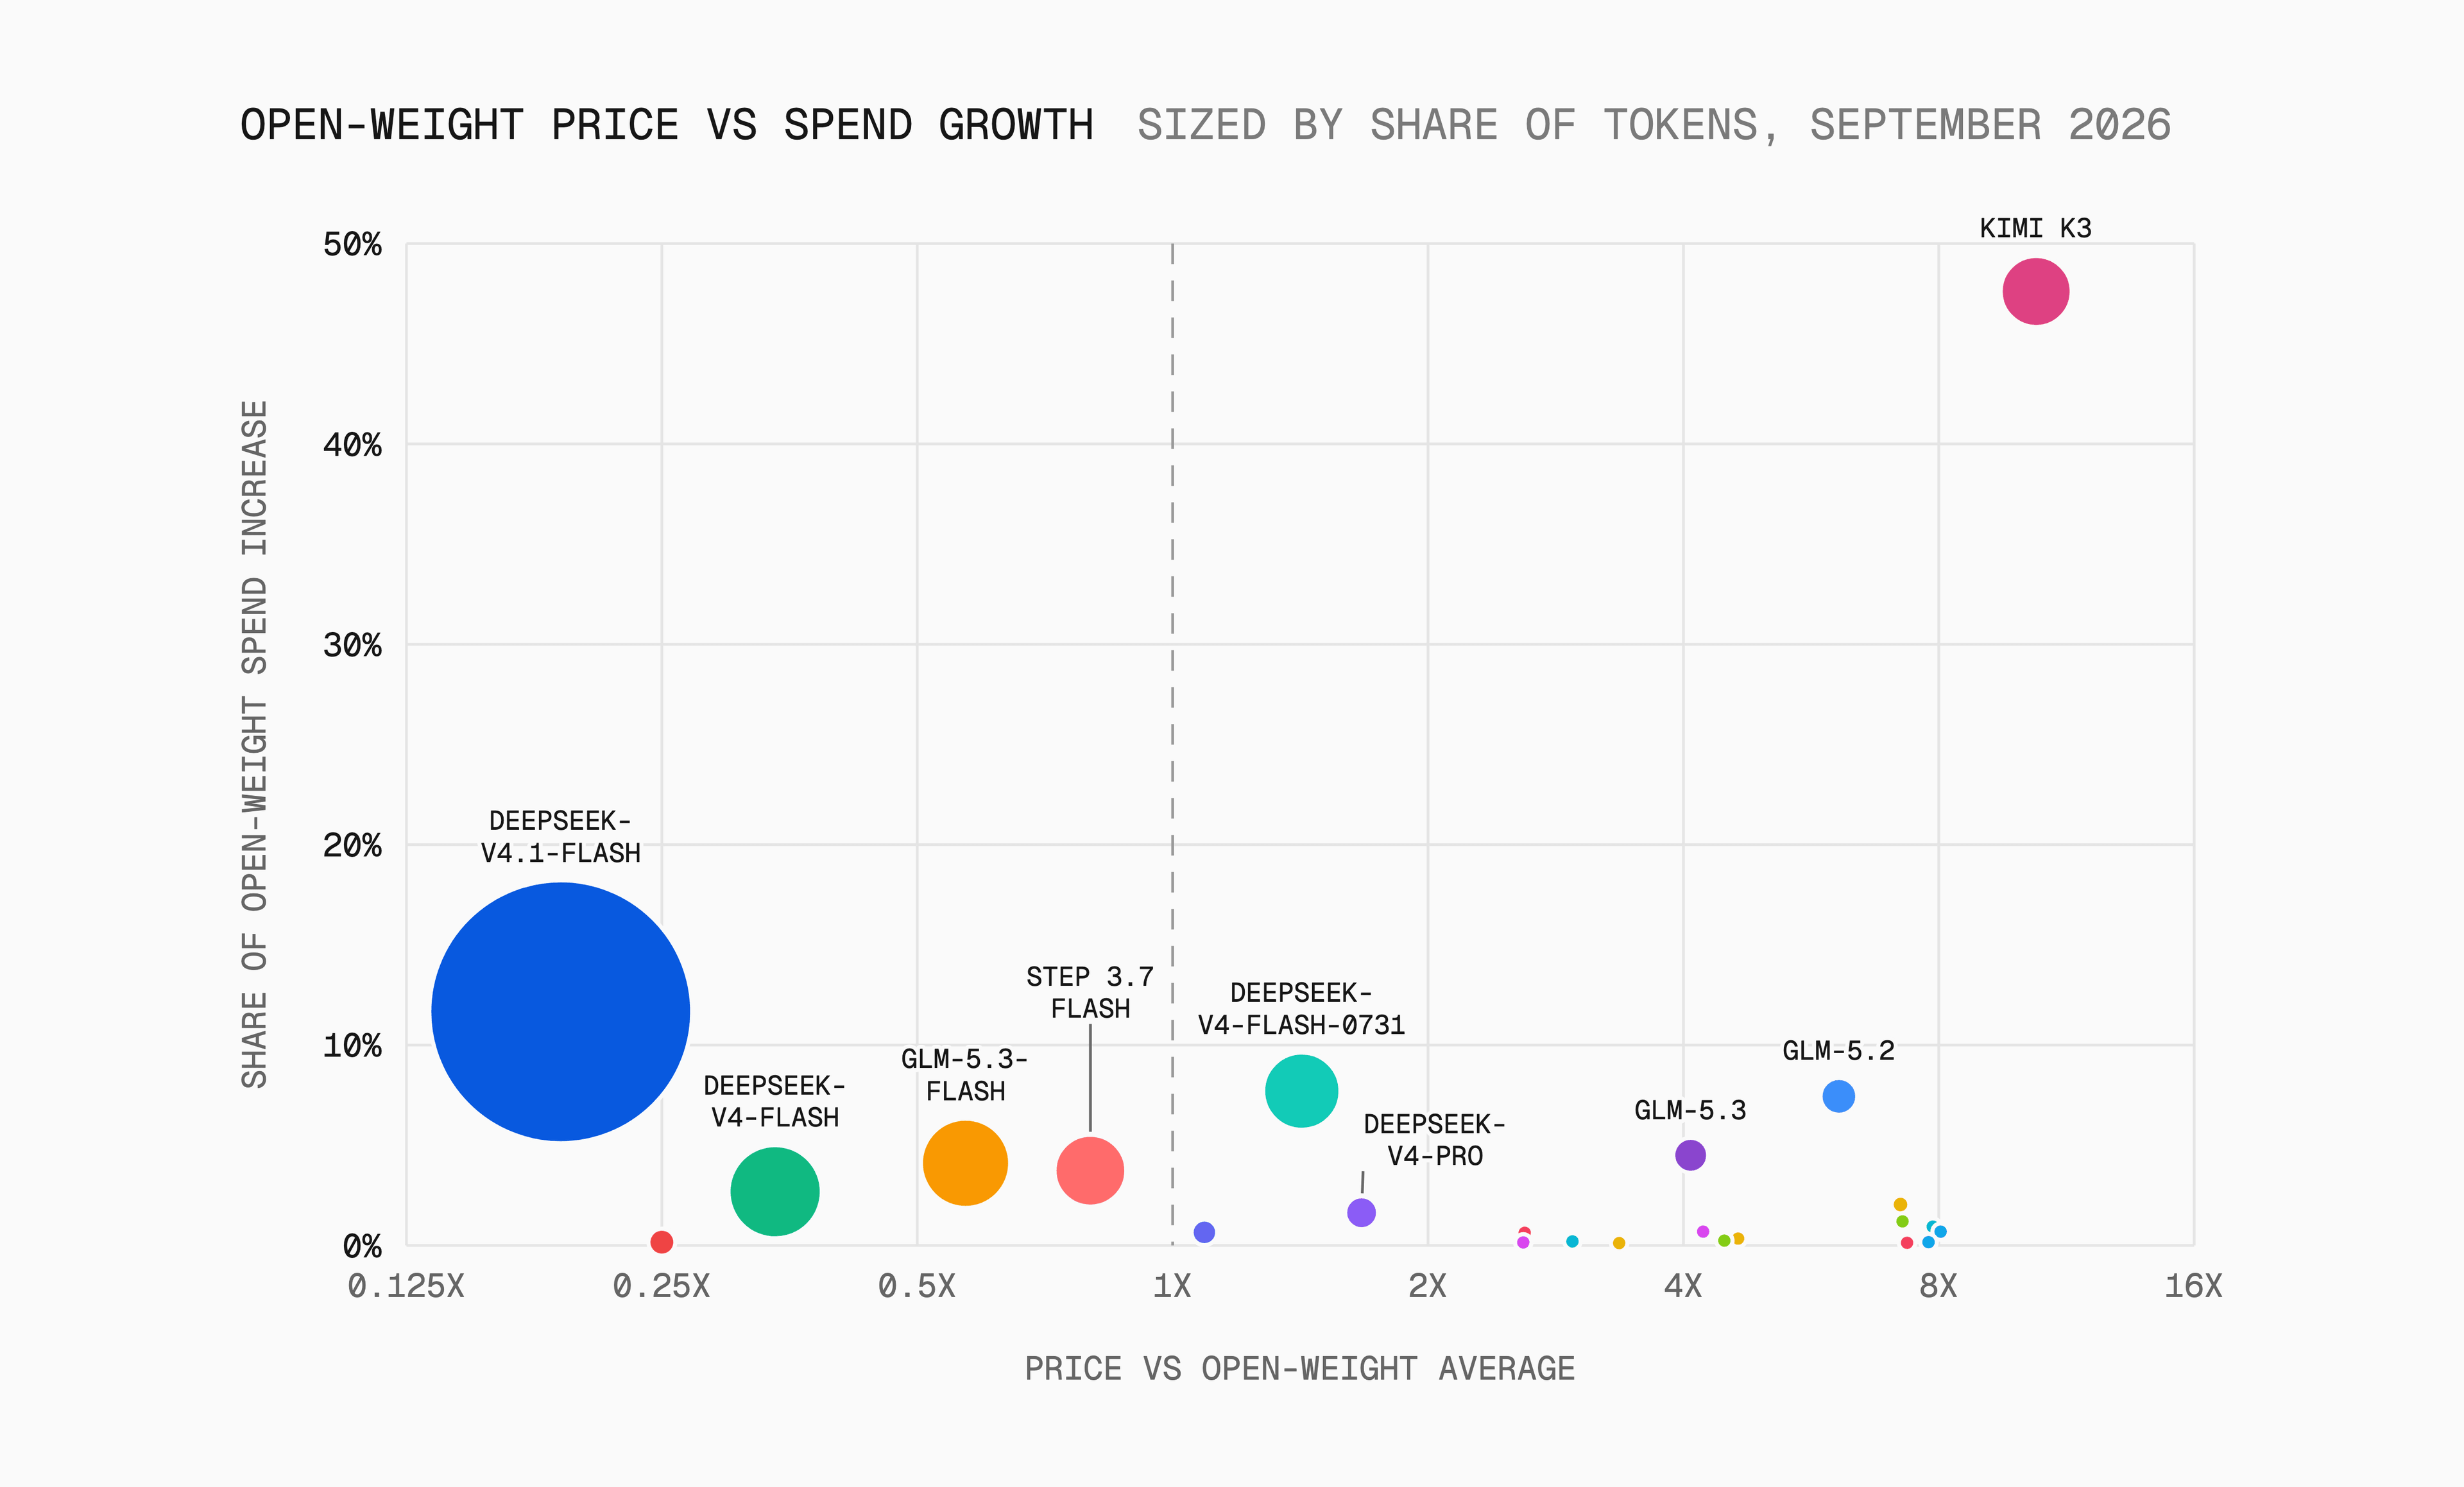
The growth is split across the price range, mirroring the gateway as a whole: the cheapest models pull in tokens, the expensive ones pull in dollars. Led by Kimi K3, models priced at four times the open-weight average cost per token or more produced about two-thirds of the increase in open-weight spend. DeepSeek-v4.1-Flash, by contrast, handled nearly half of all September tokens for just 2.6% of spend, at a price per token roughly one-fifth of the open-weight average.
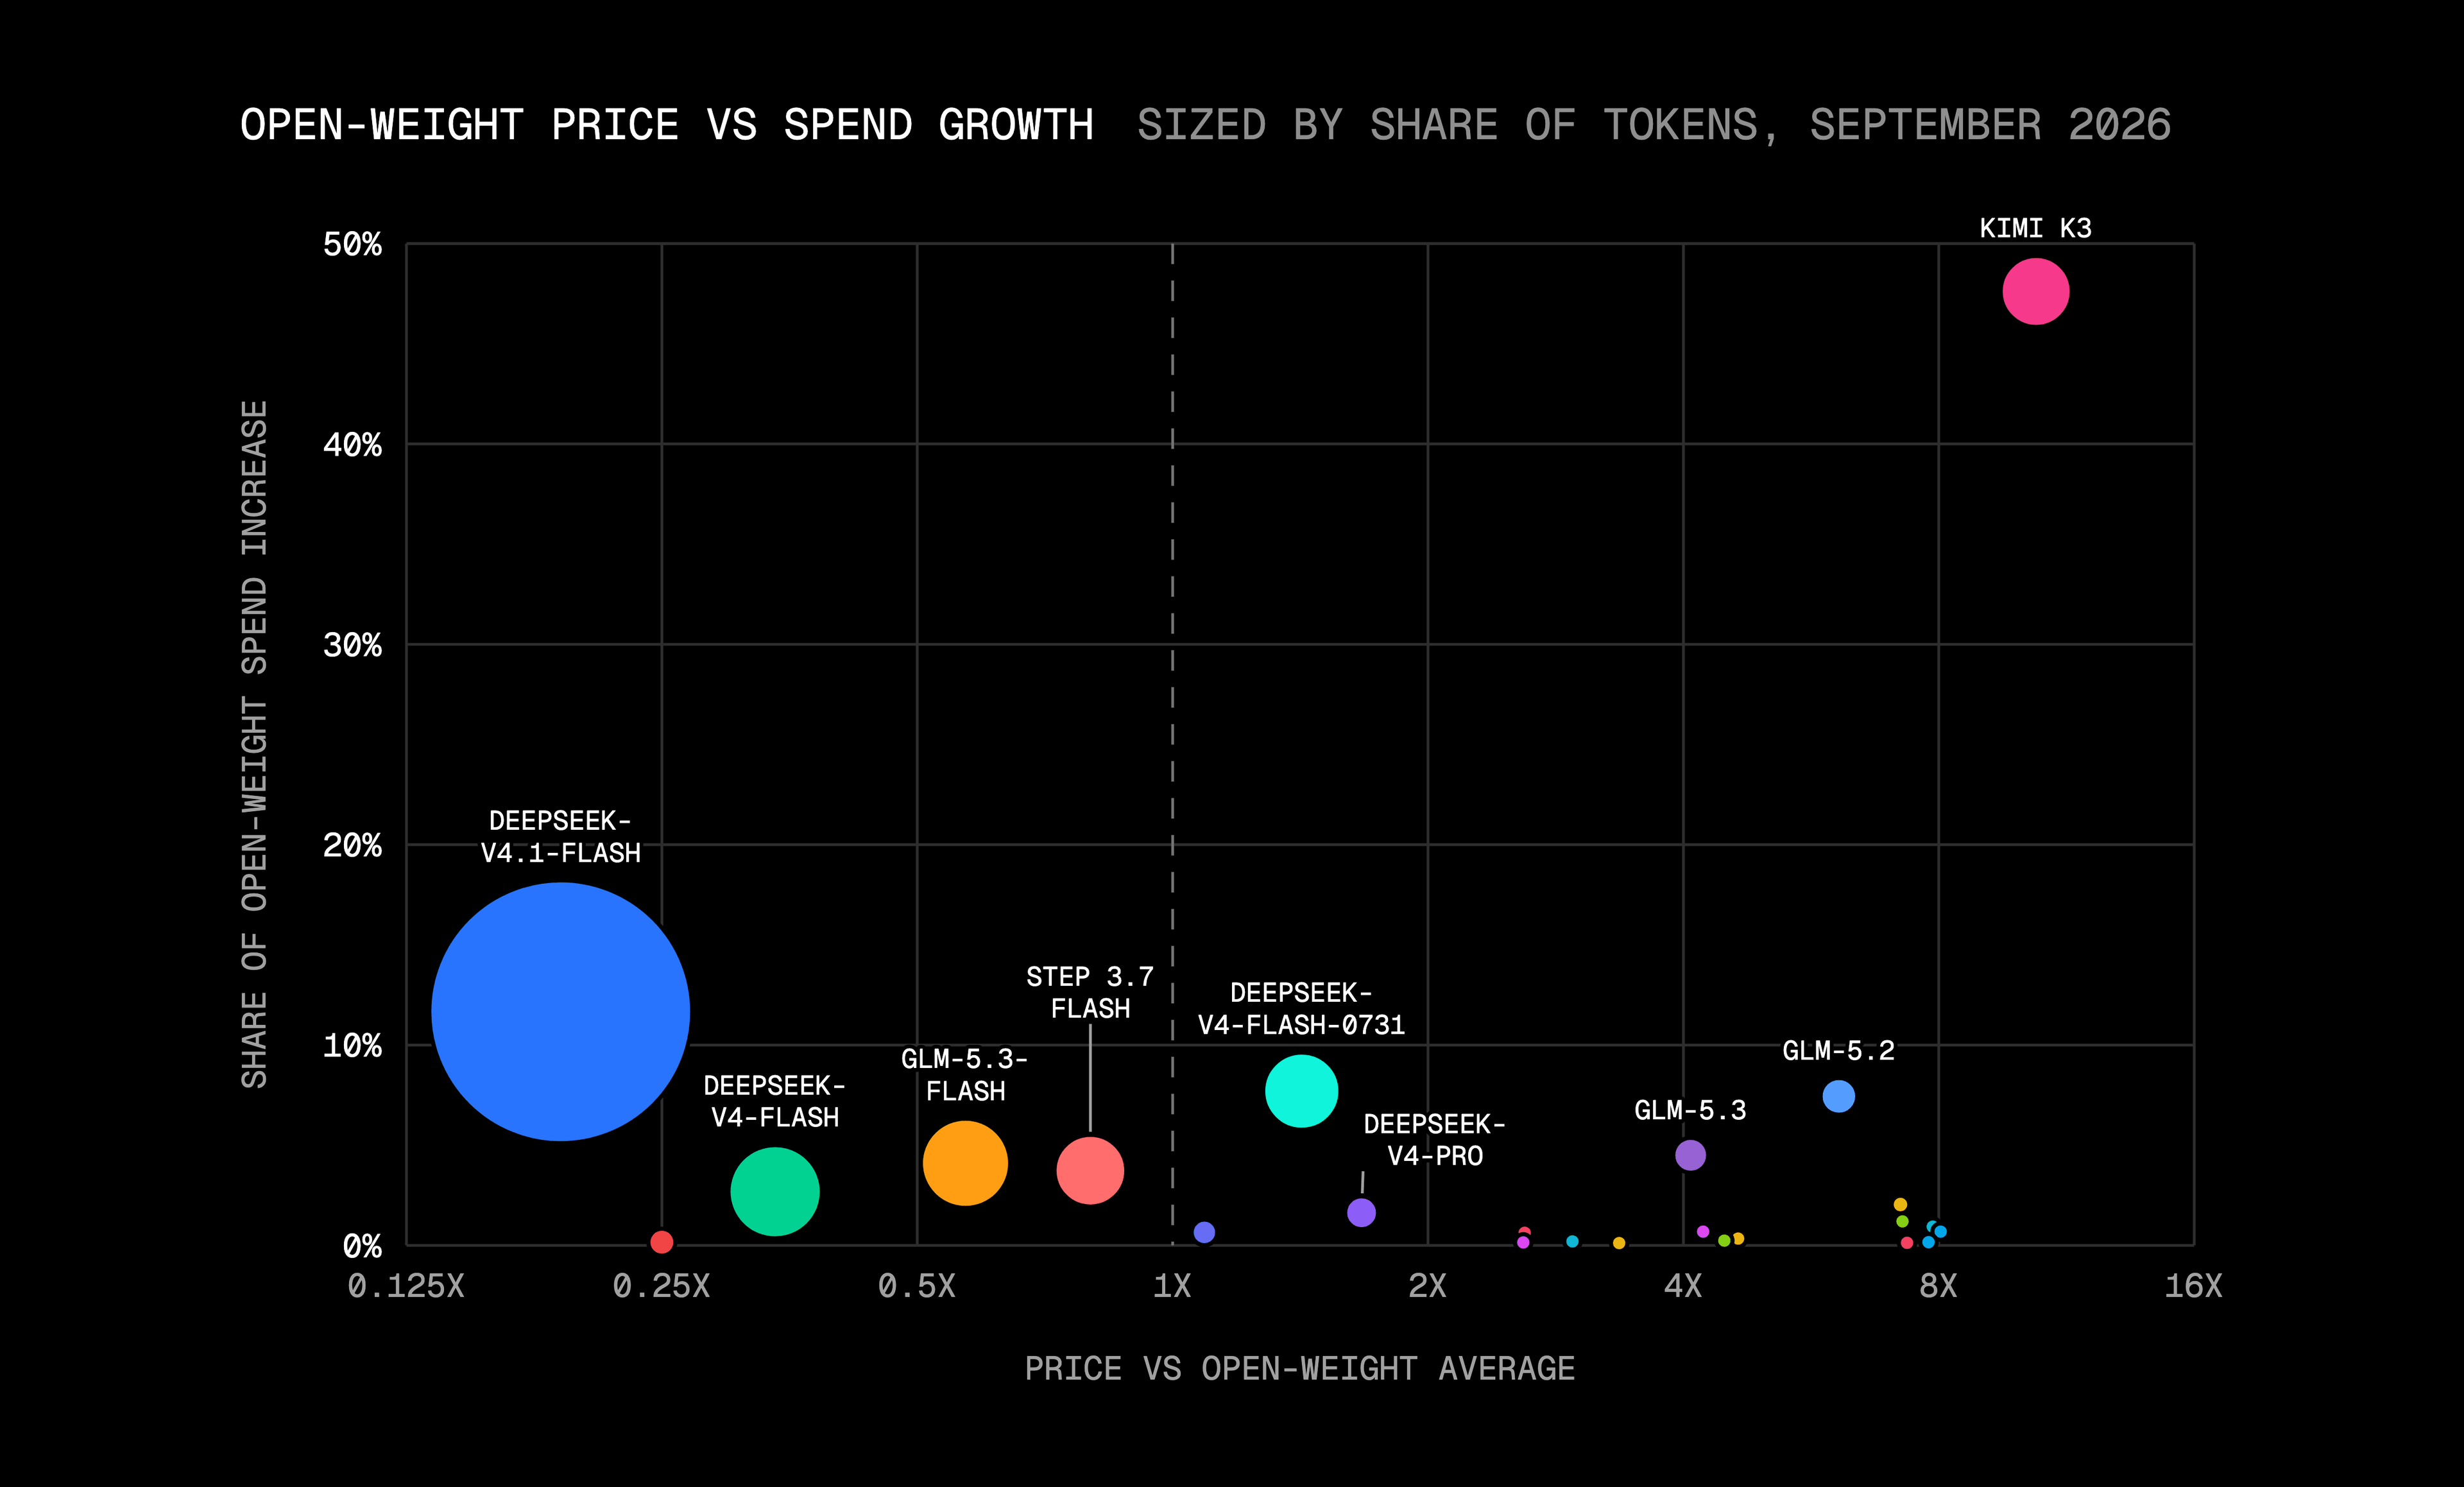
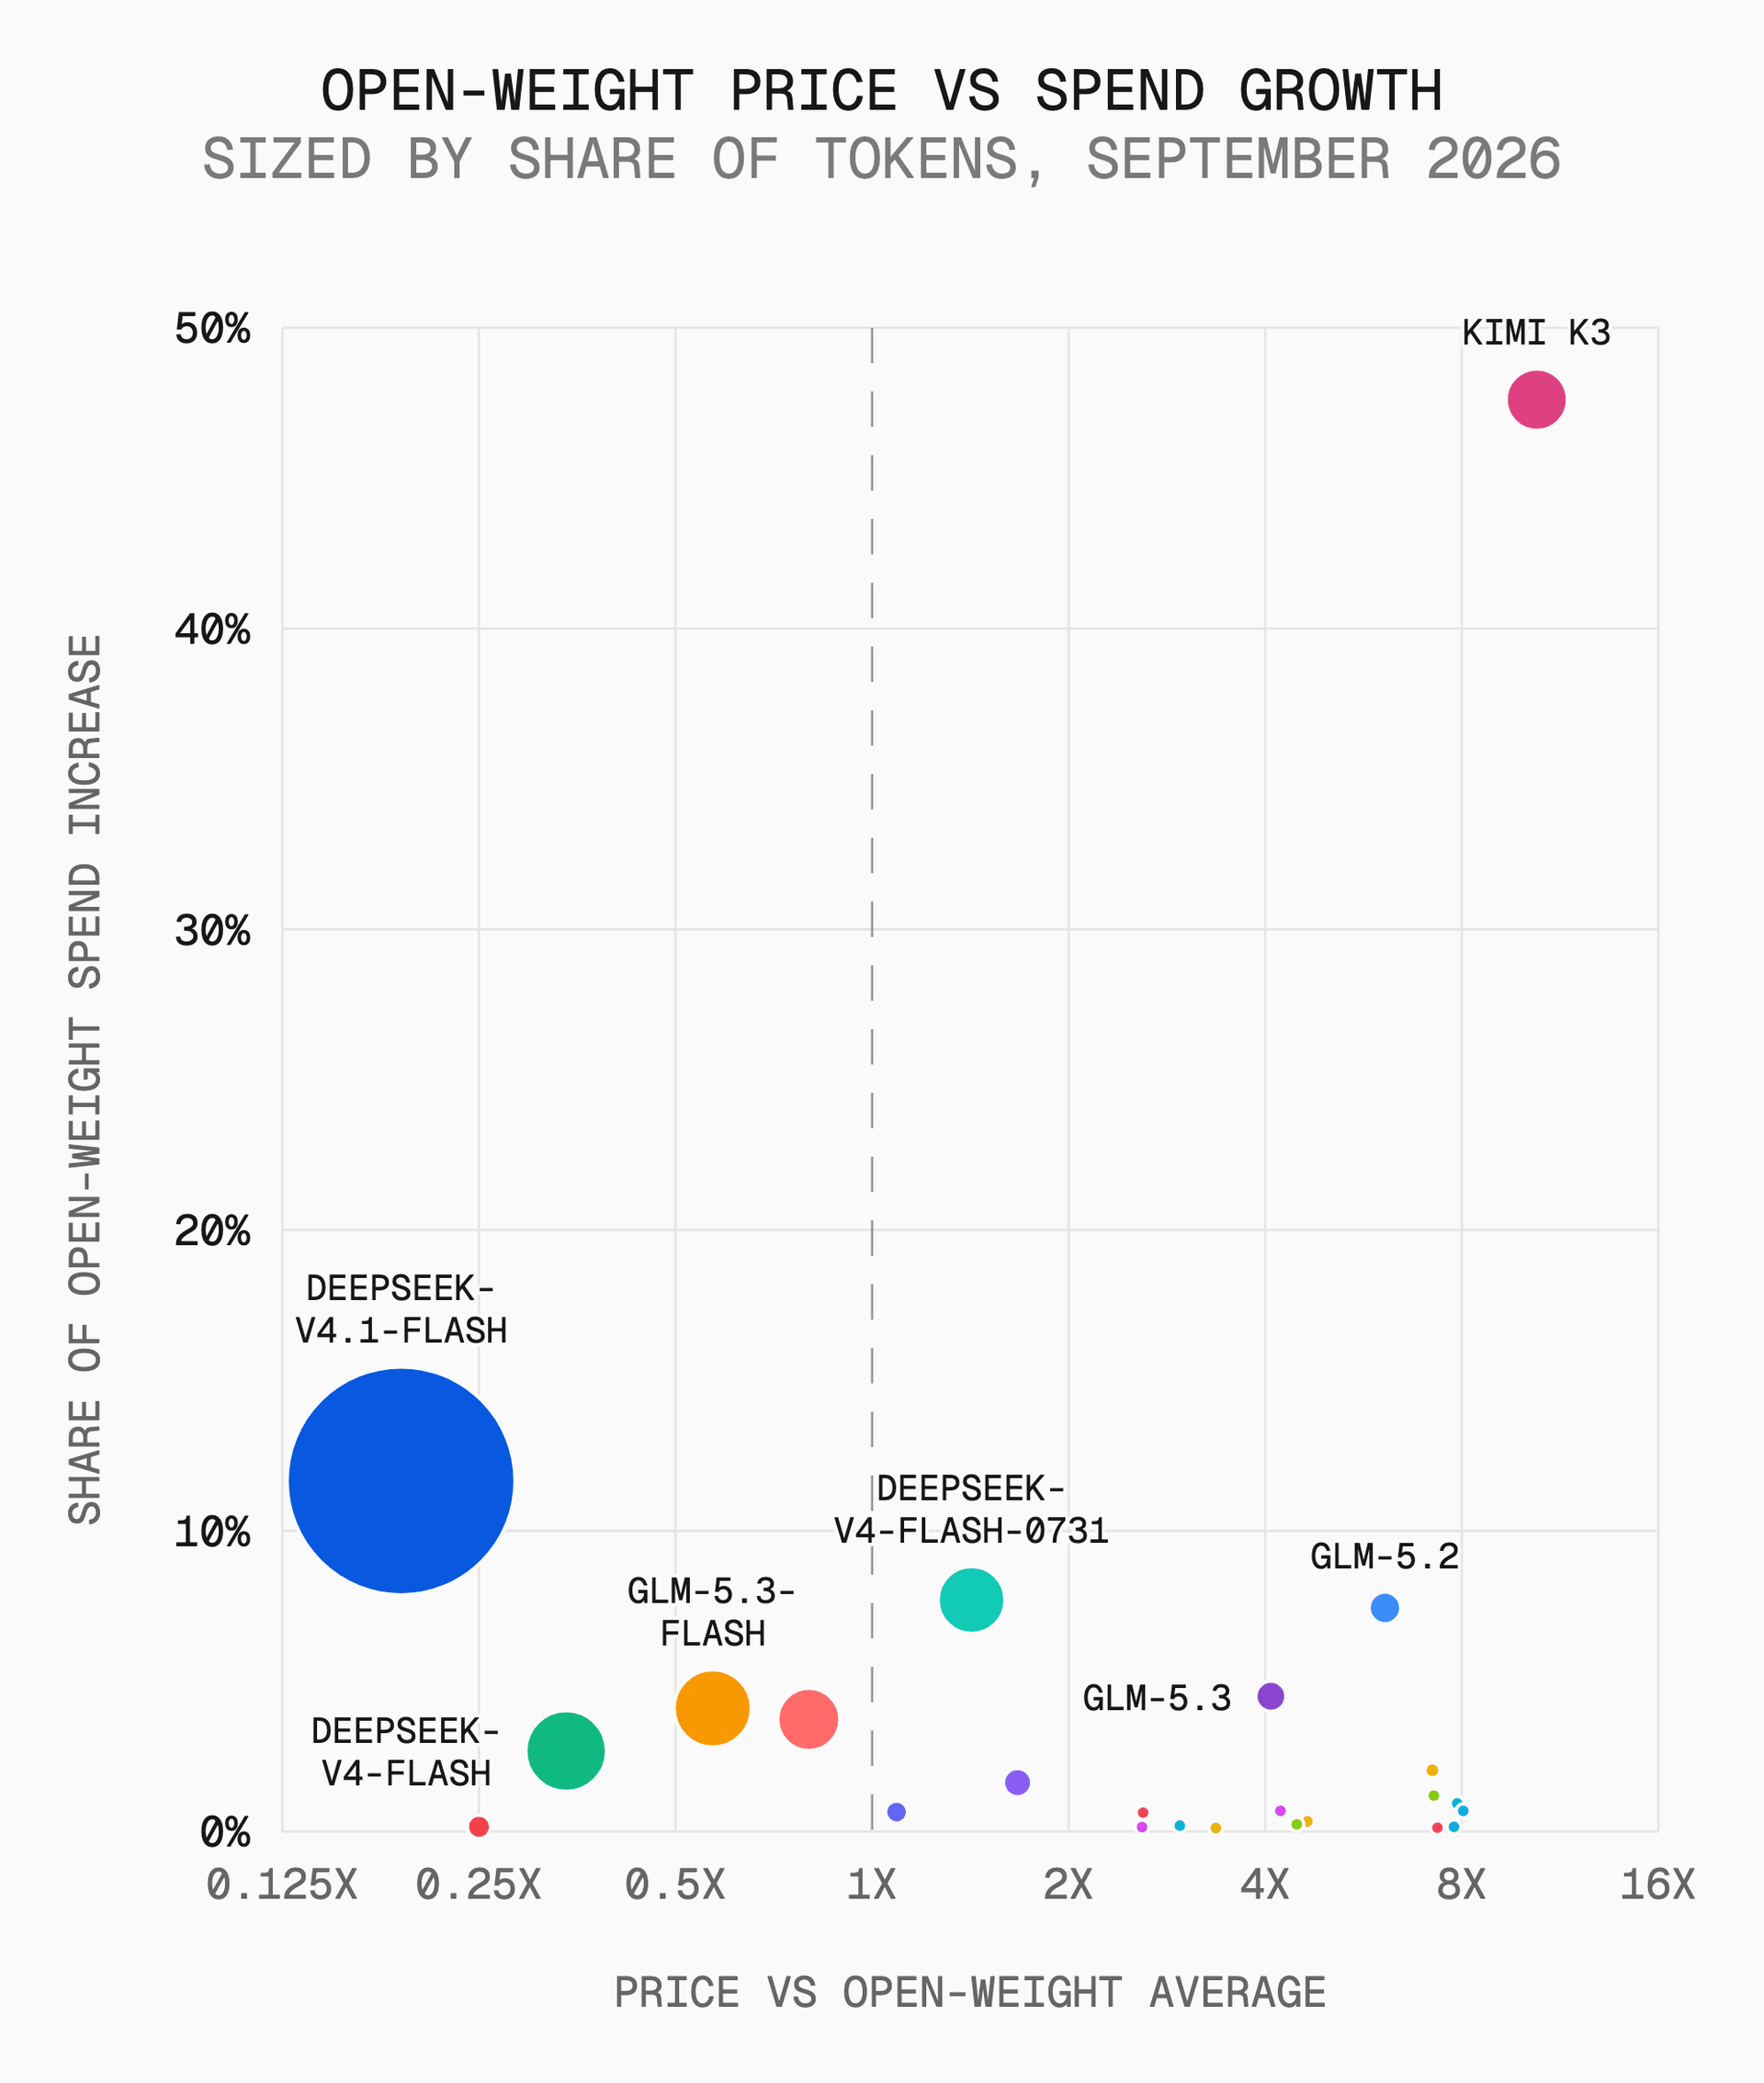
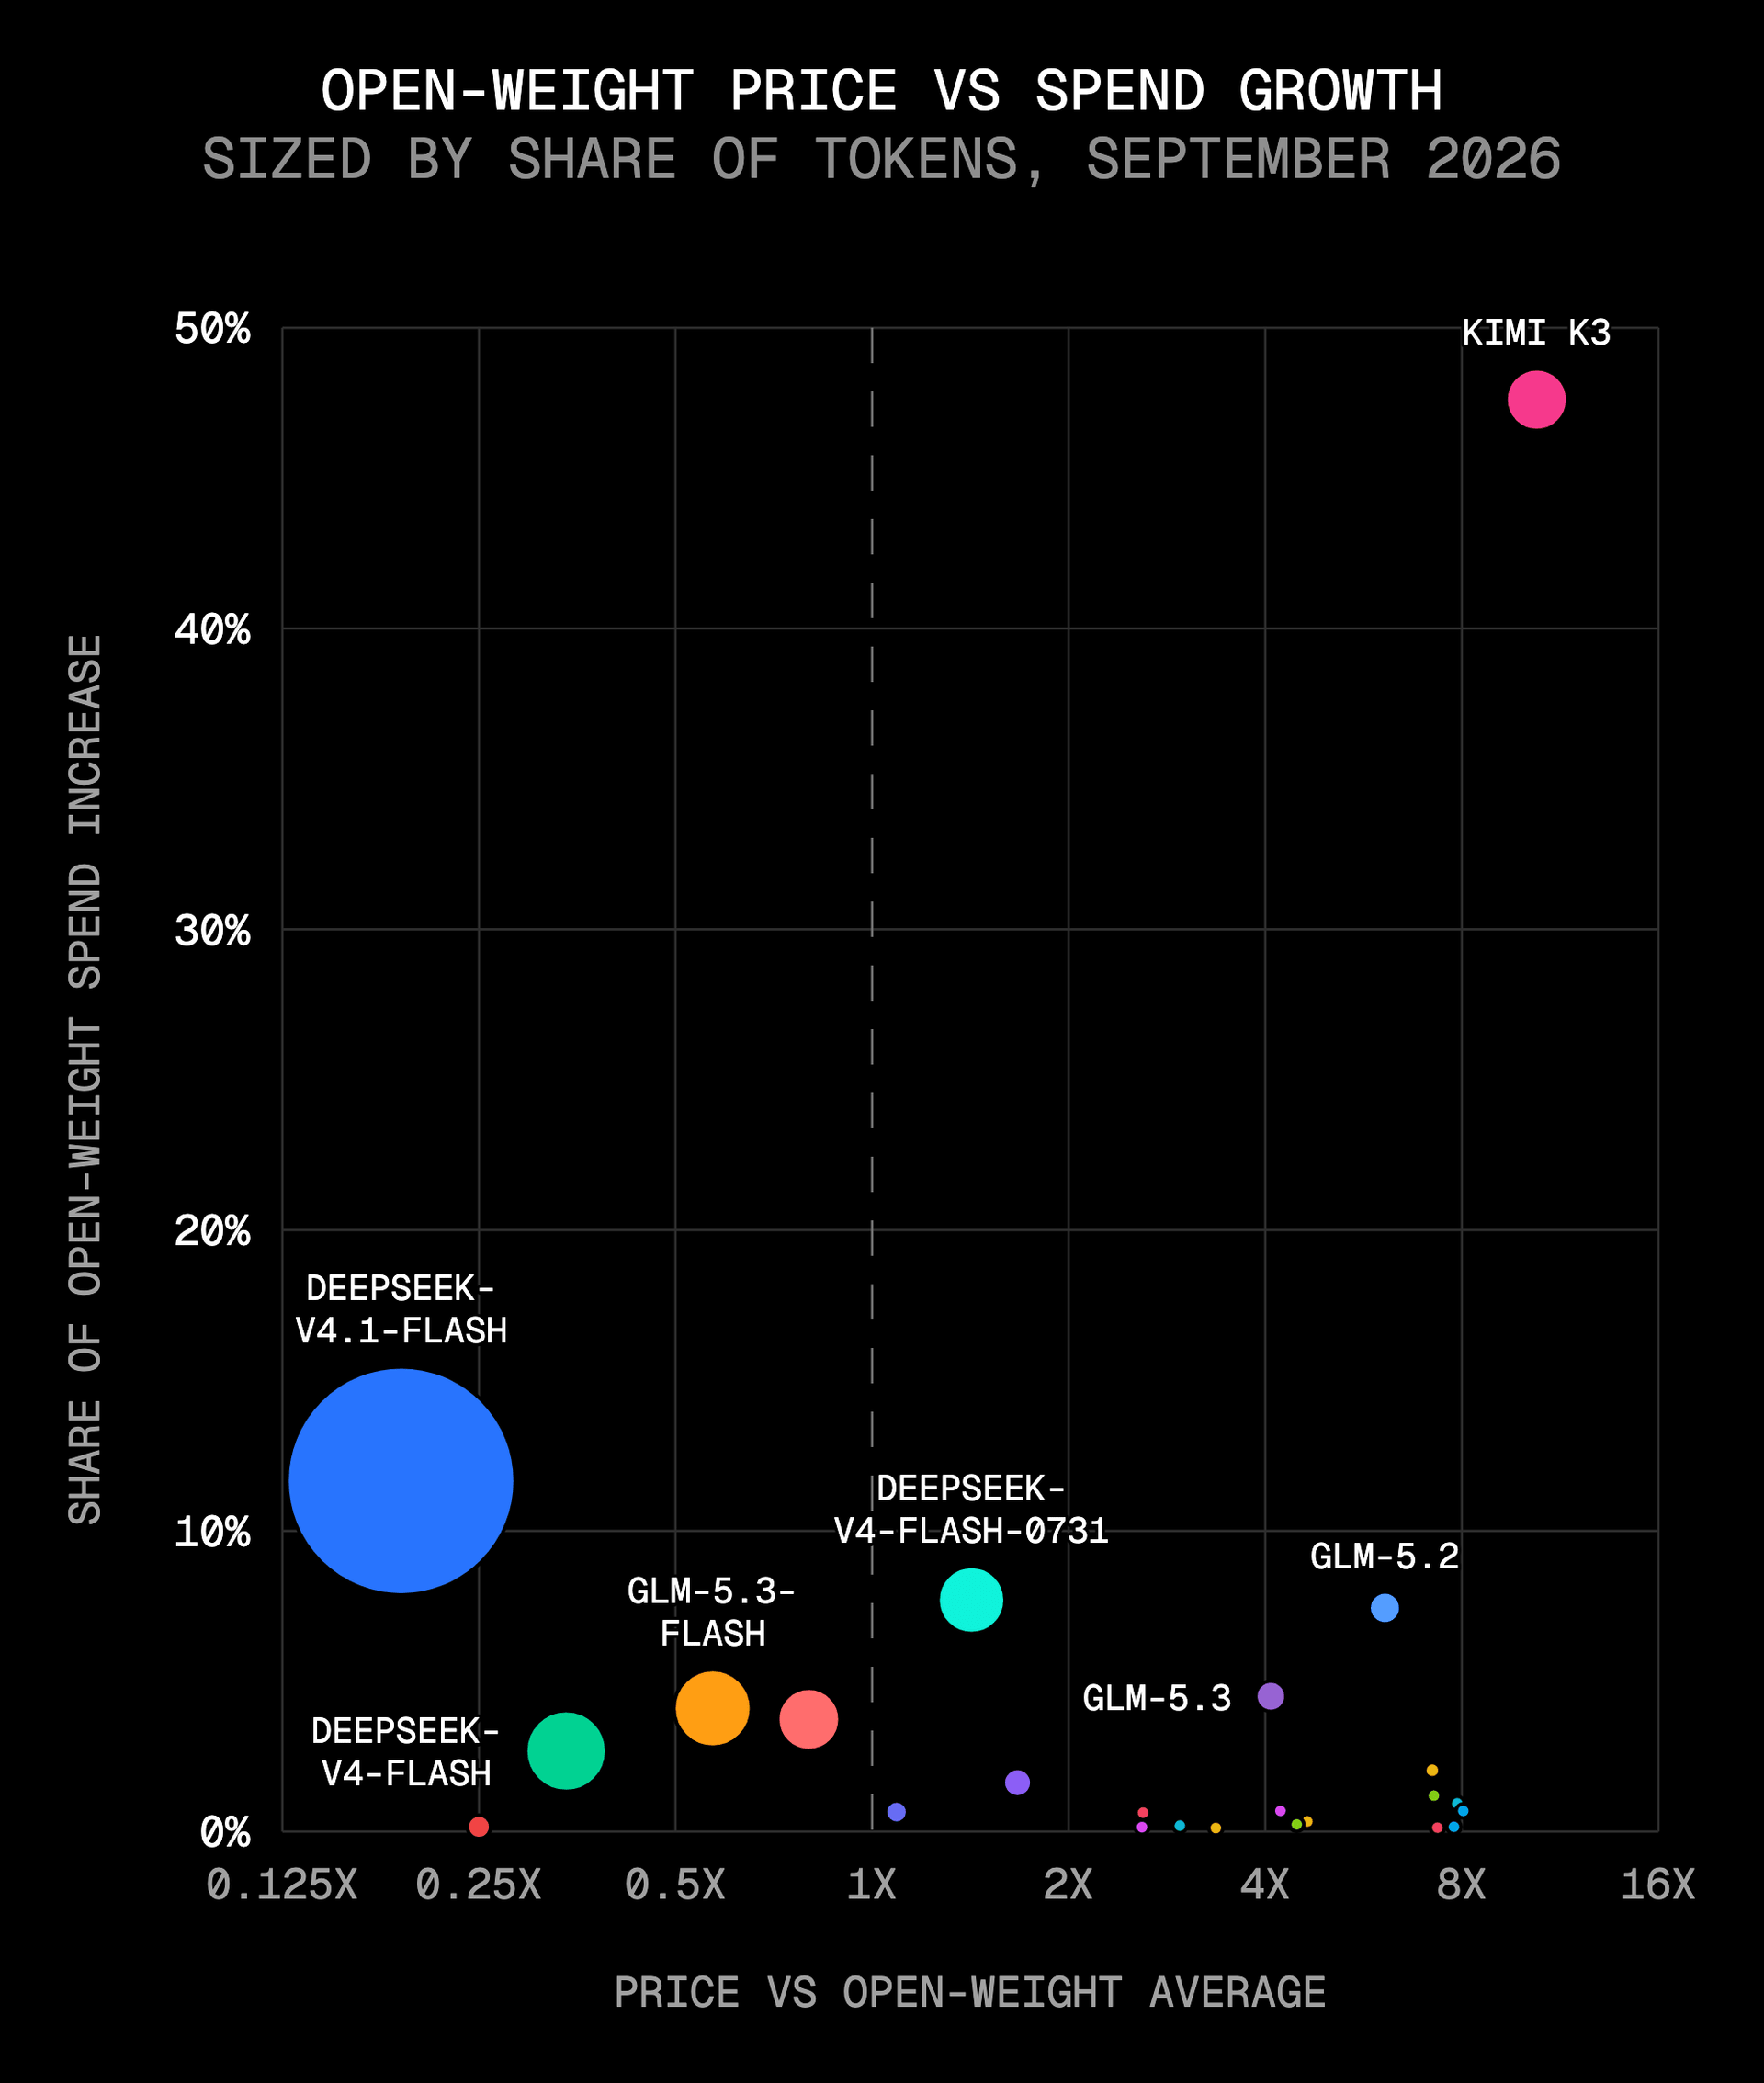
Budgets are expanding on both sides of the market. Frontier spend has grown tenfold since December, while open-weight spend has grown more than seventyfold. In September, 68% of teams that increased open-weight spending also increased closed-weight spending, and more than two in five teams already paying for frontier models spent more on them than in August — the highest share this year. A company can therefore spend more with a frontier lab while depending on it for fewer workloads.
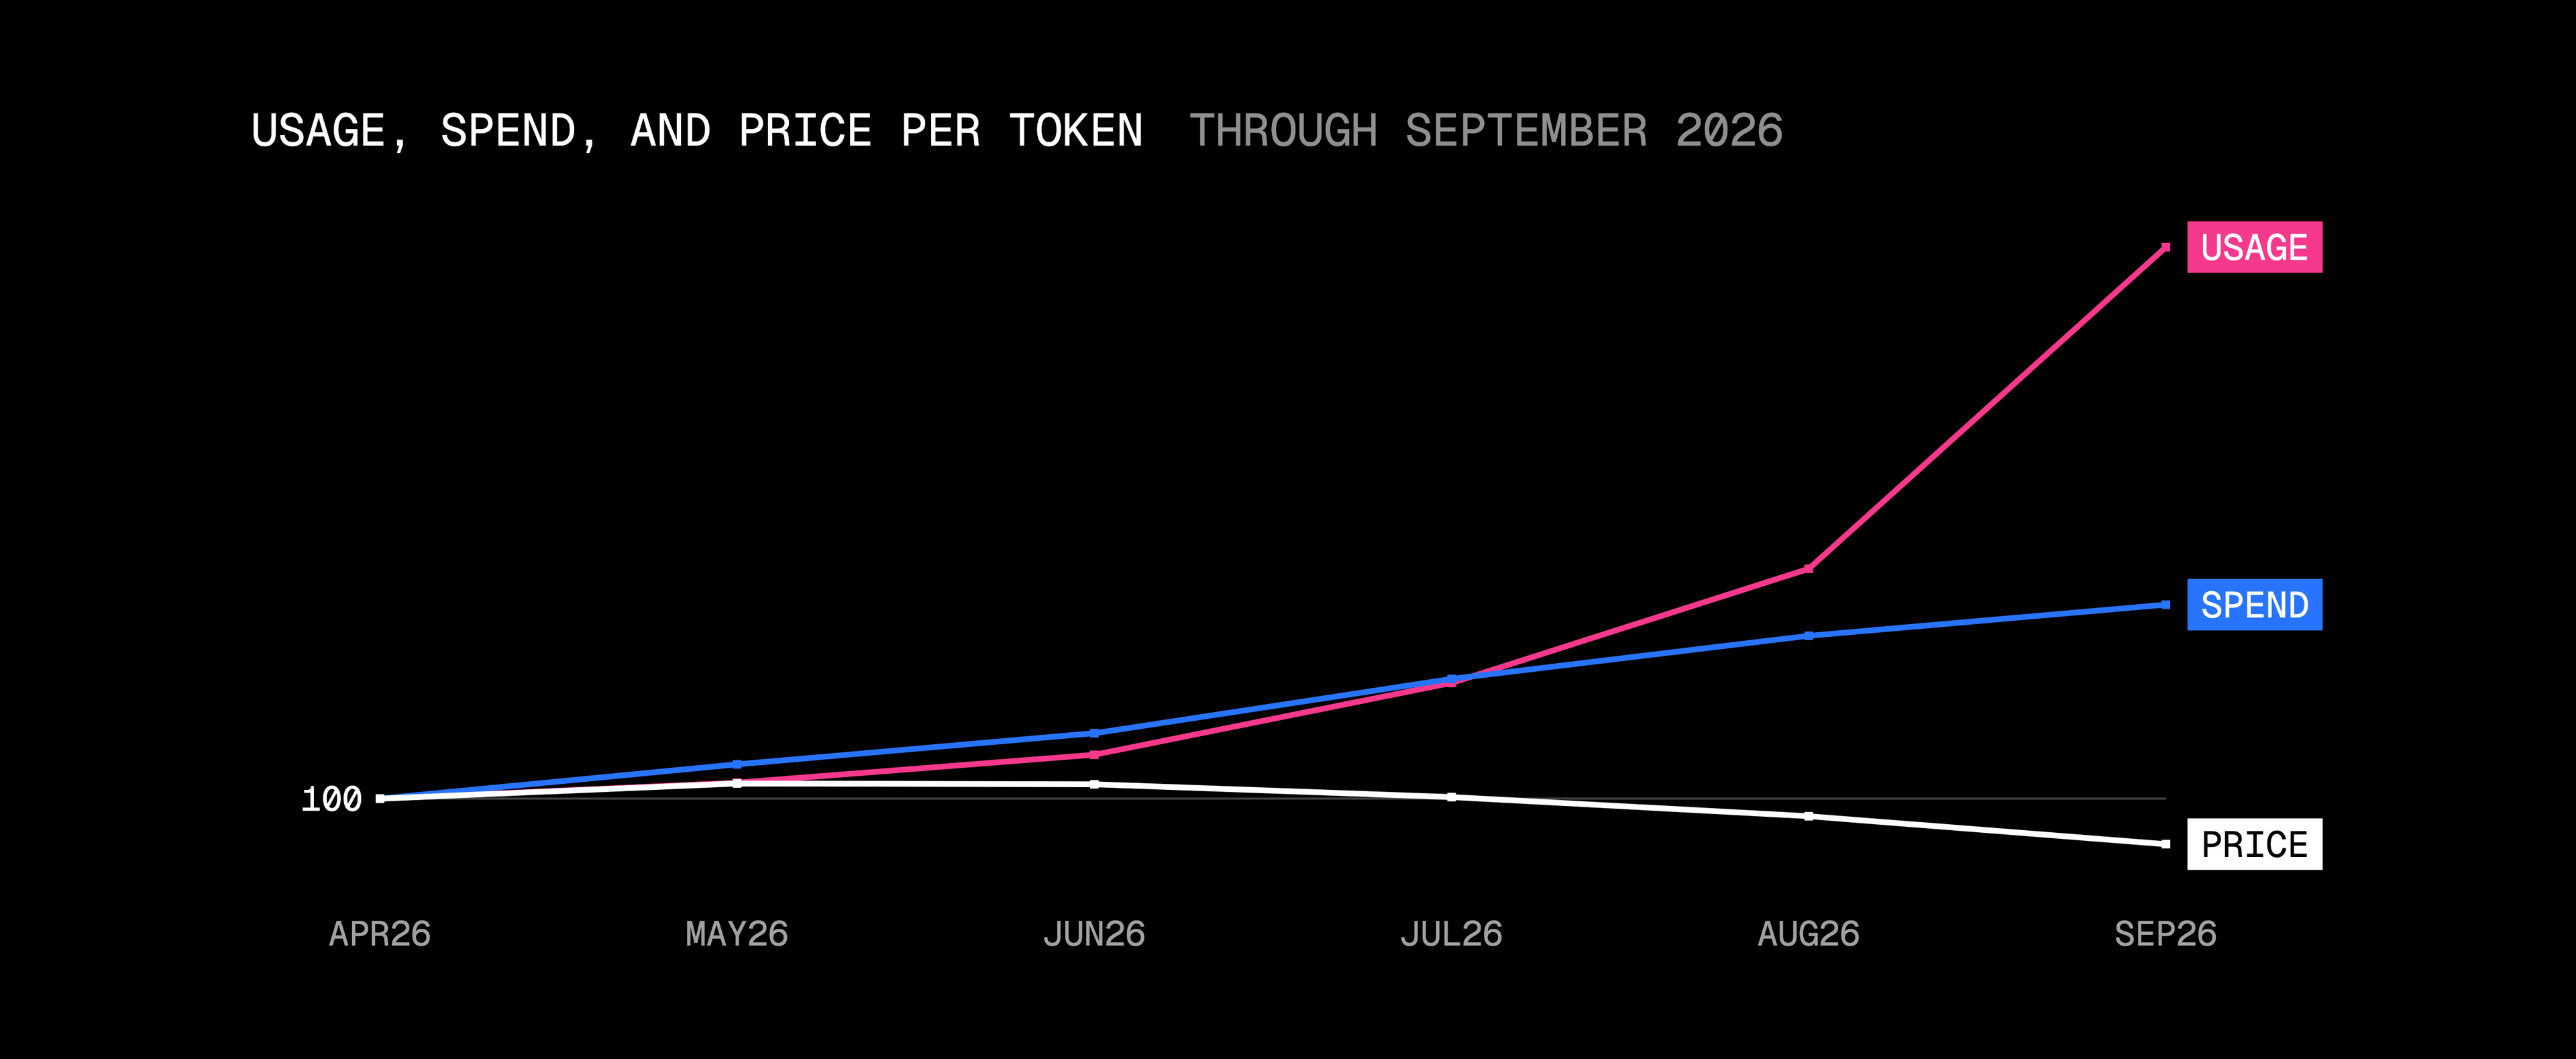
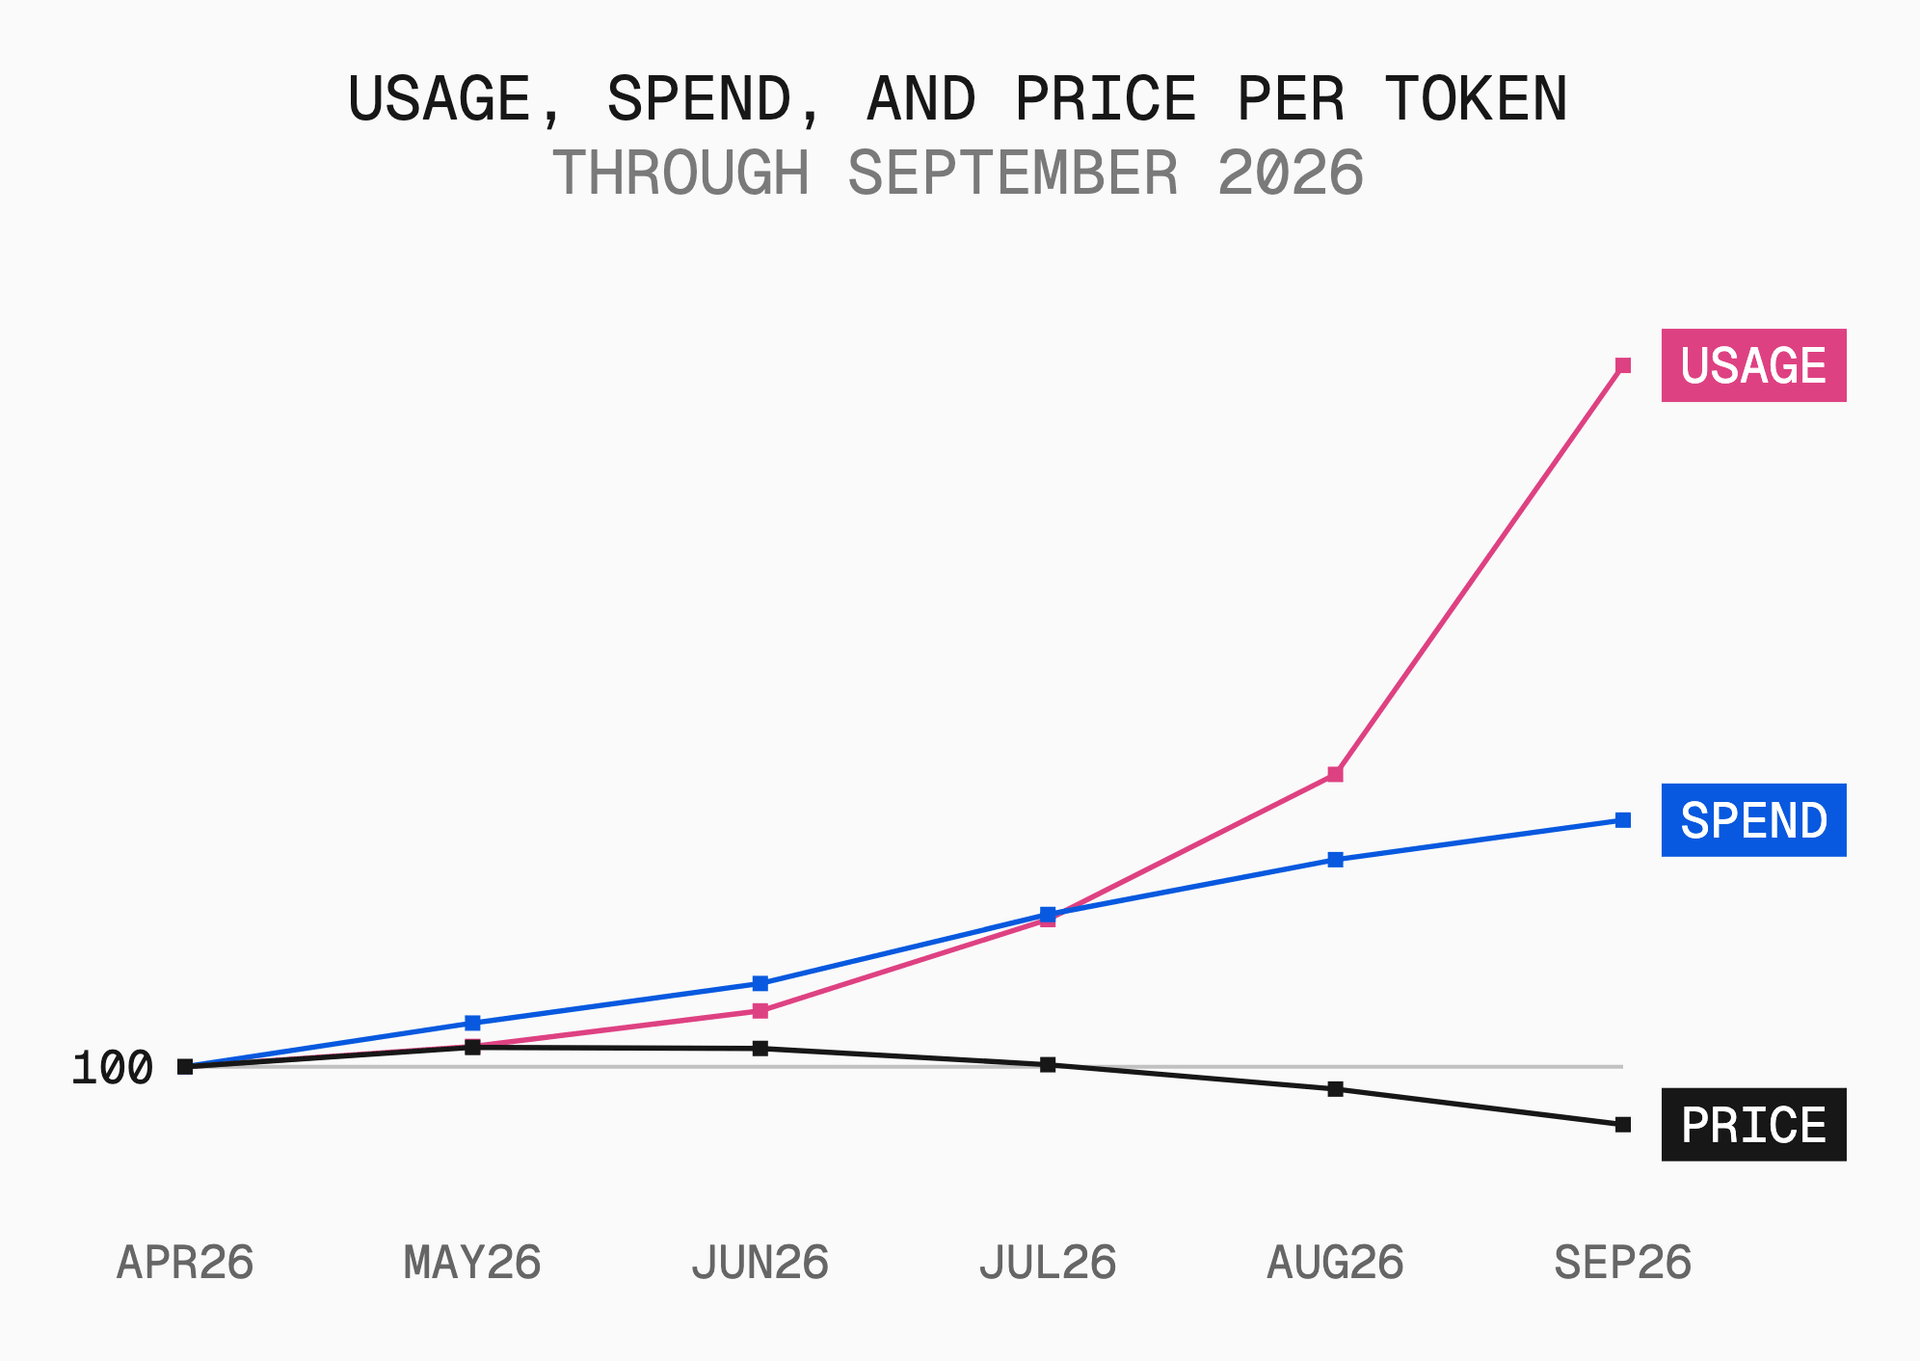
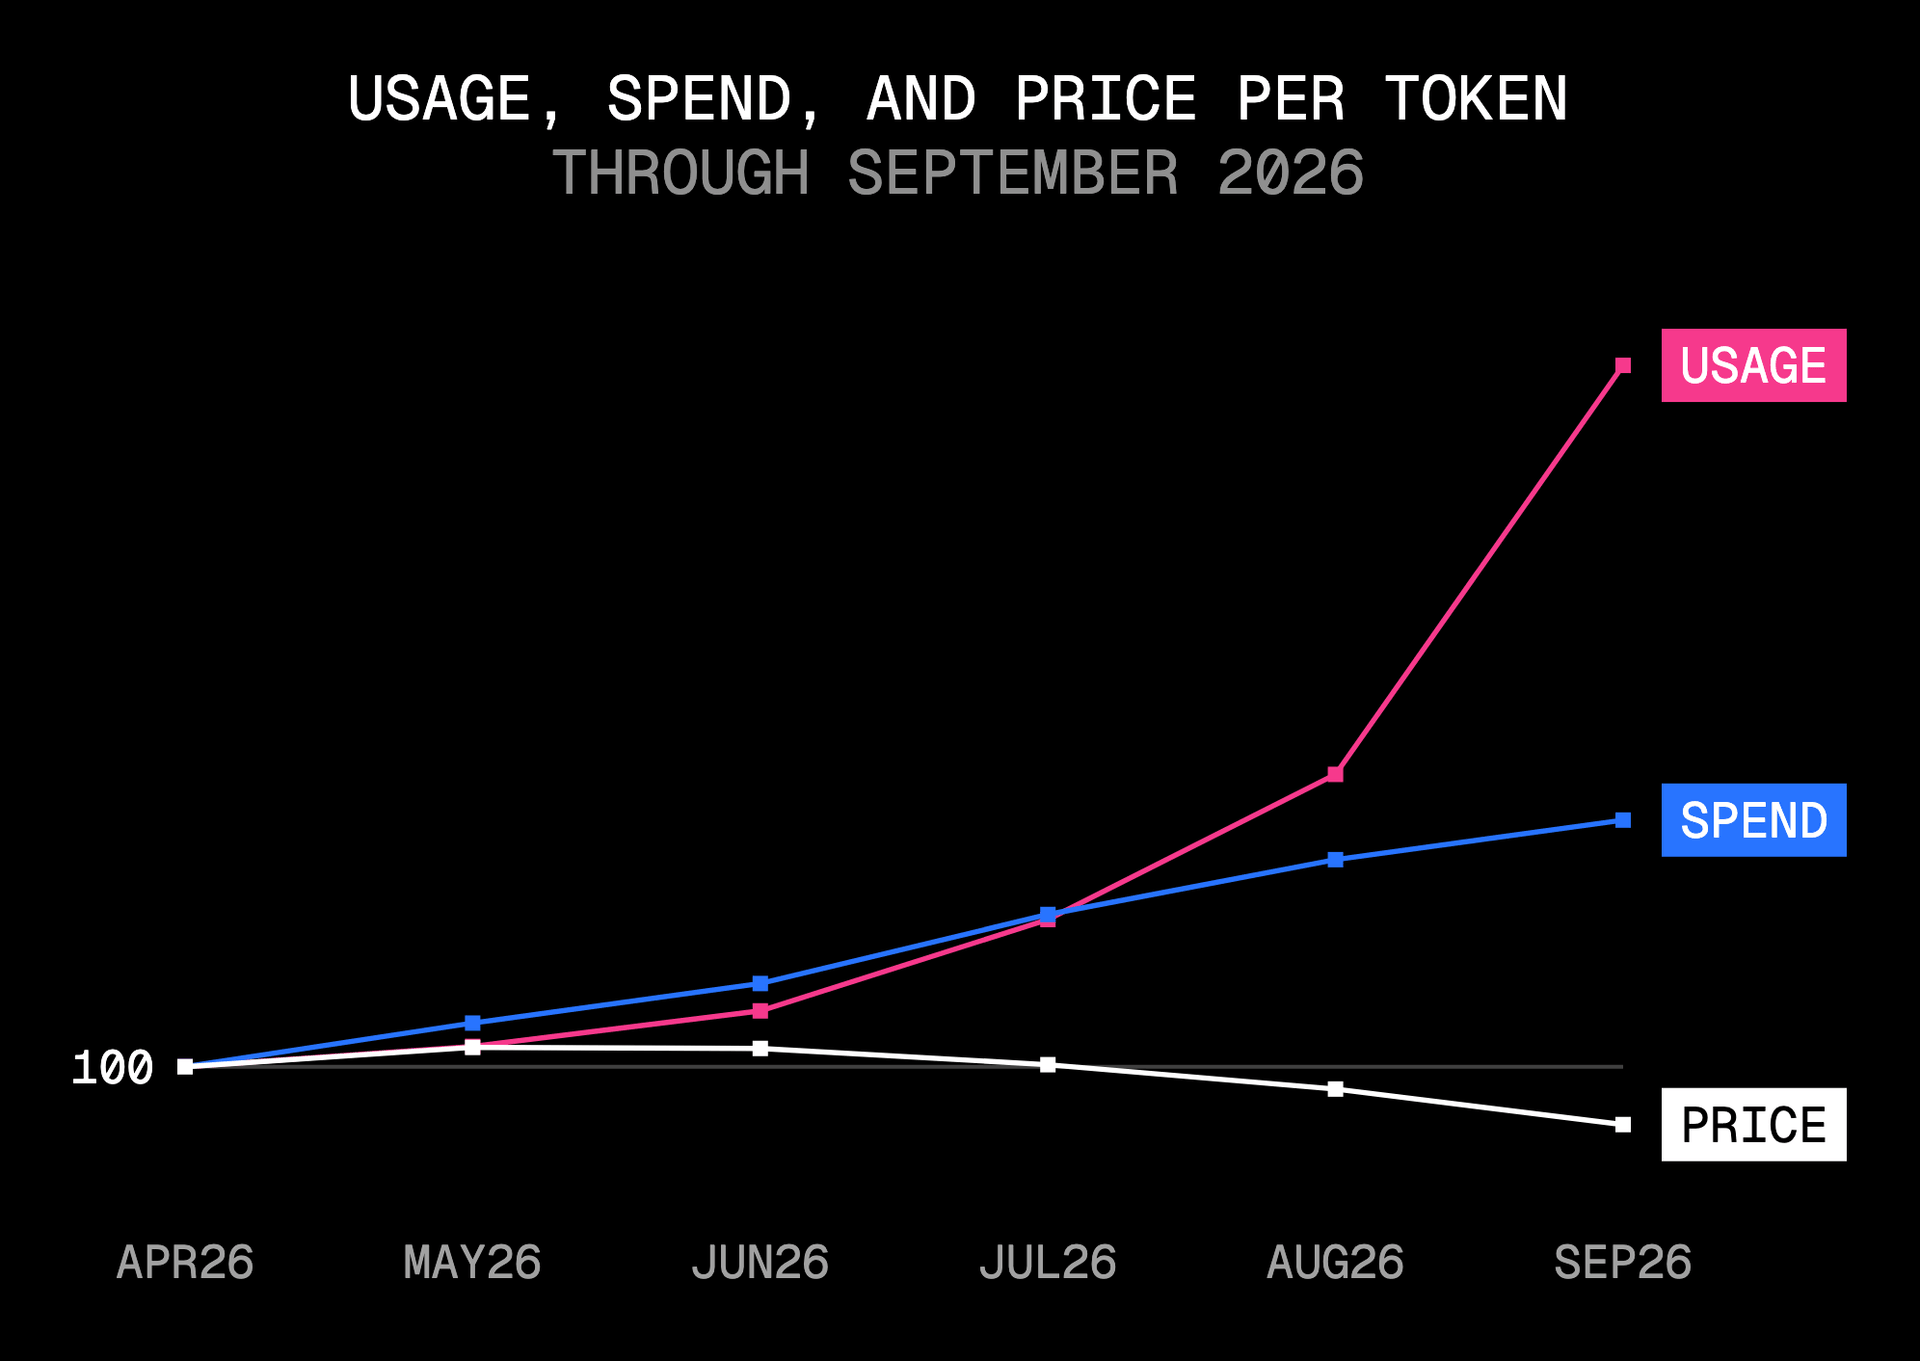
Spend up 13x, price per token down 47%
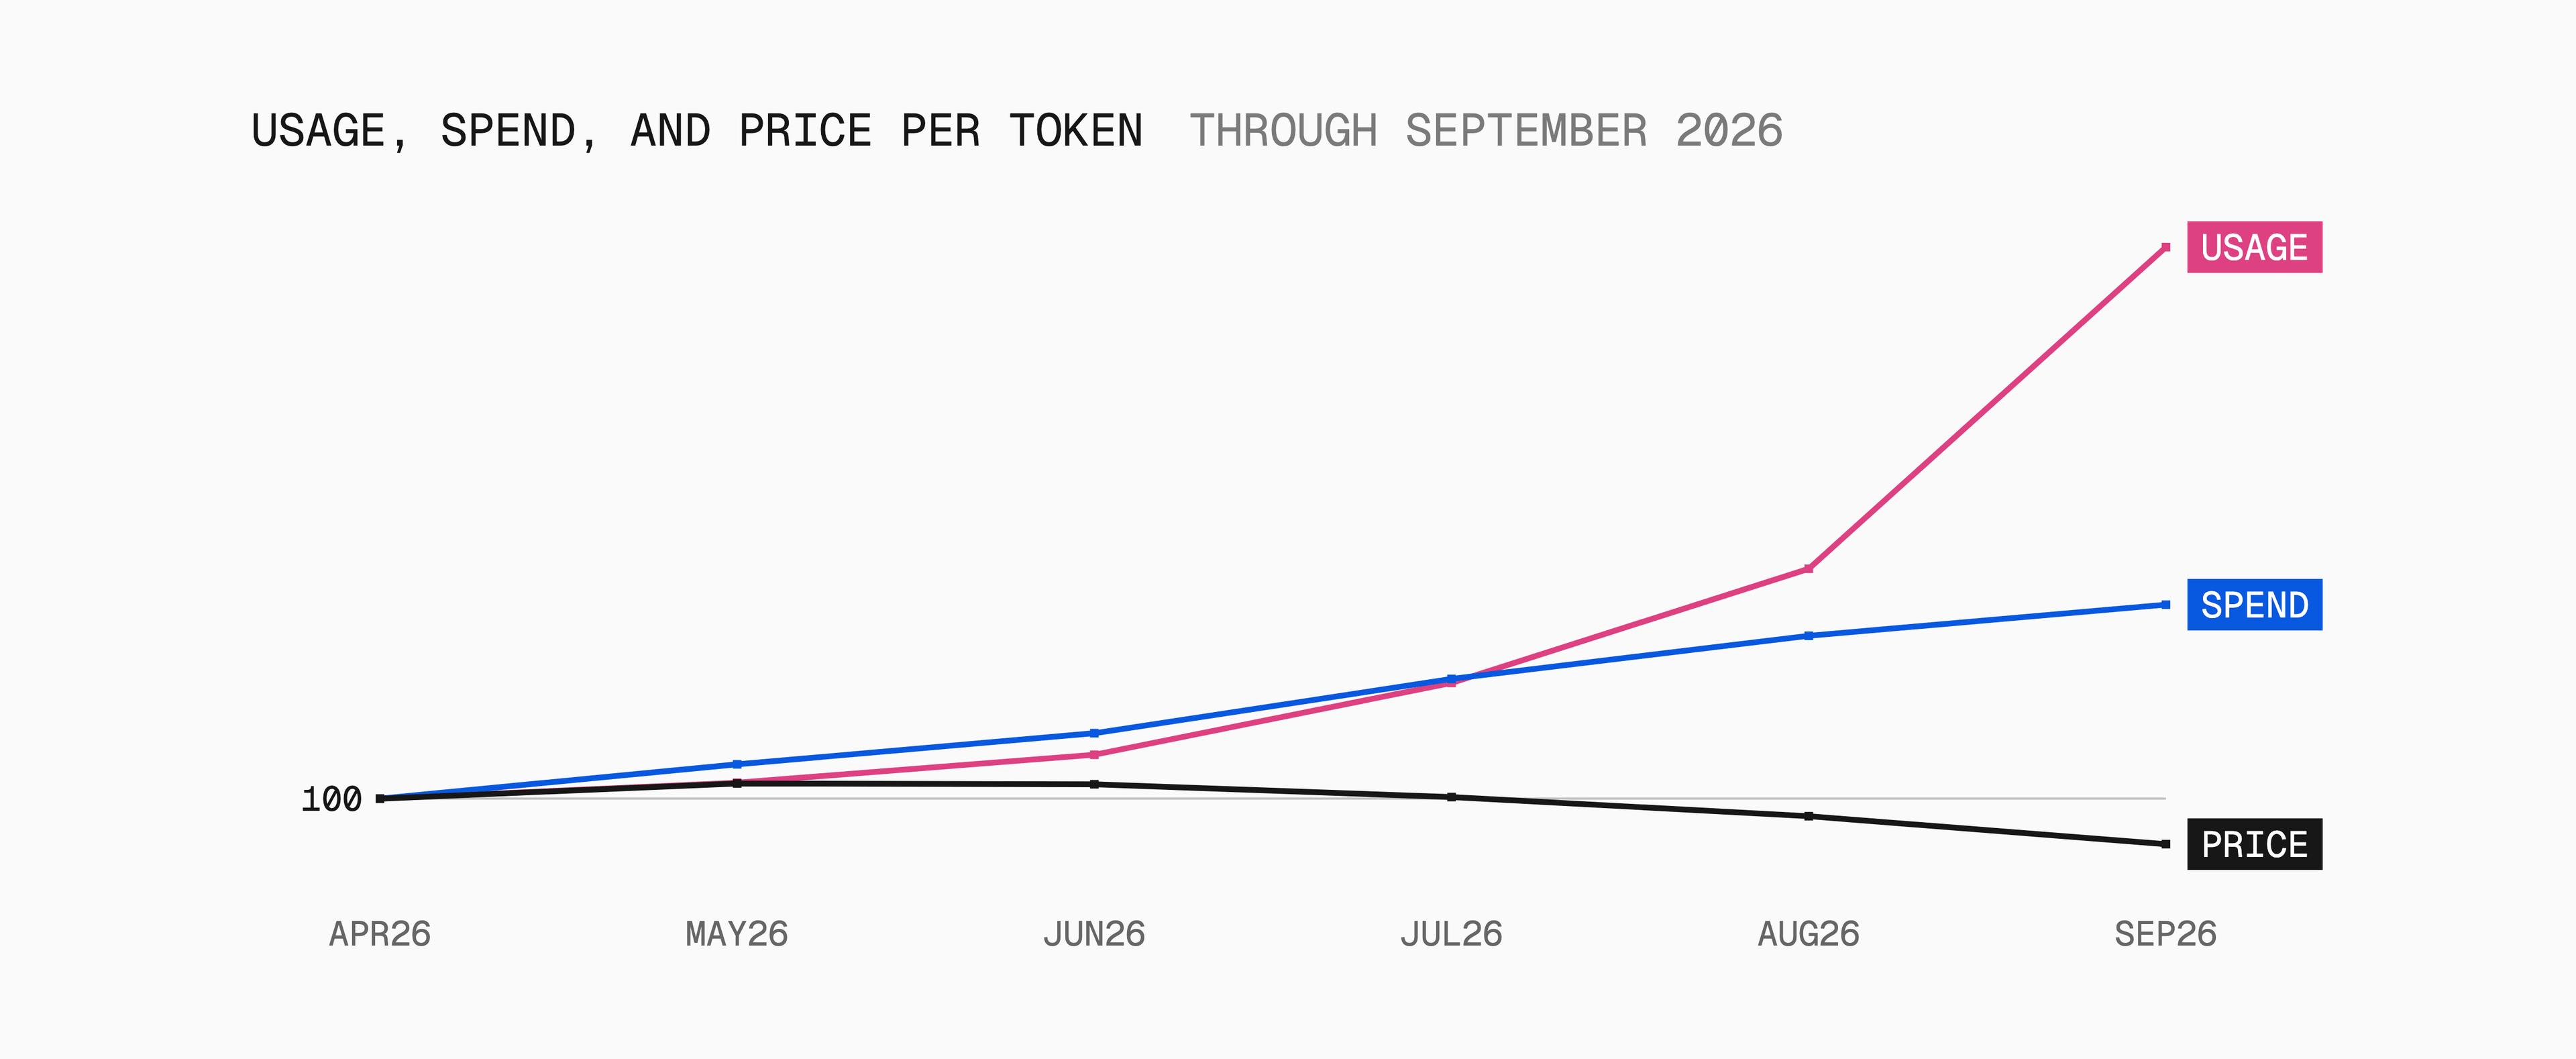
The share shift is happening inside a market that is growing and cheapening at the same time. September gateway spend was roughly 13 times December's, an increase of 1,180%, while the average price per token fell 47%. The median paid customer active in both months more than doubled its spend.
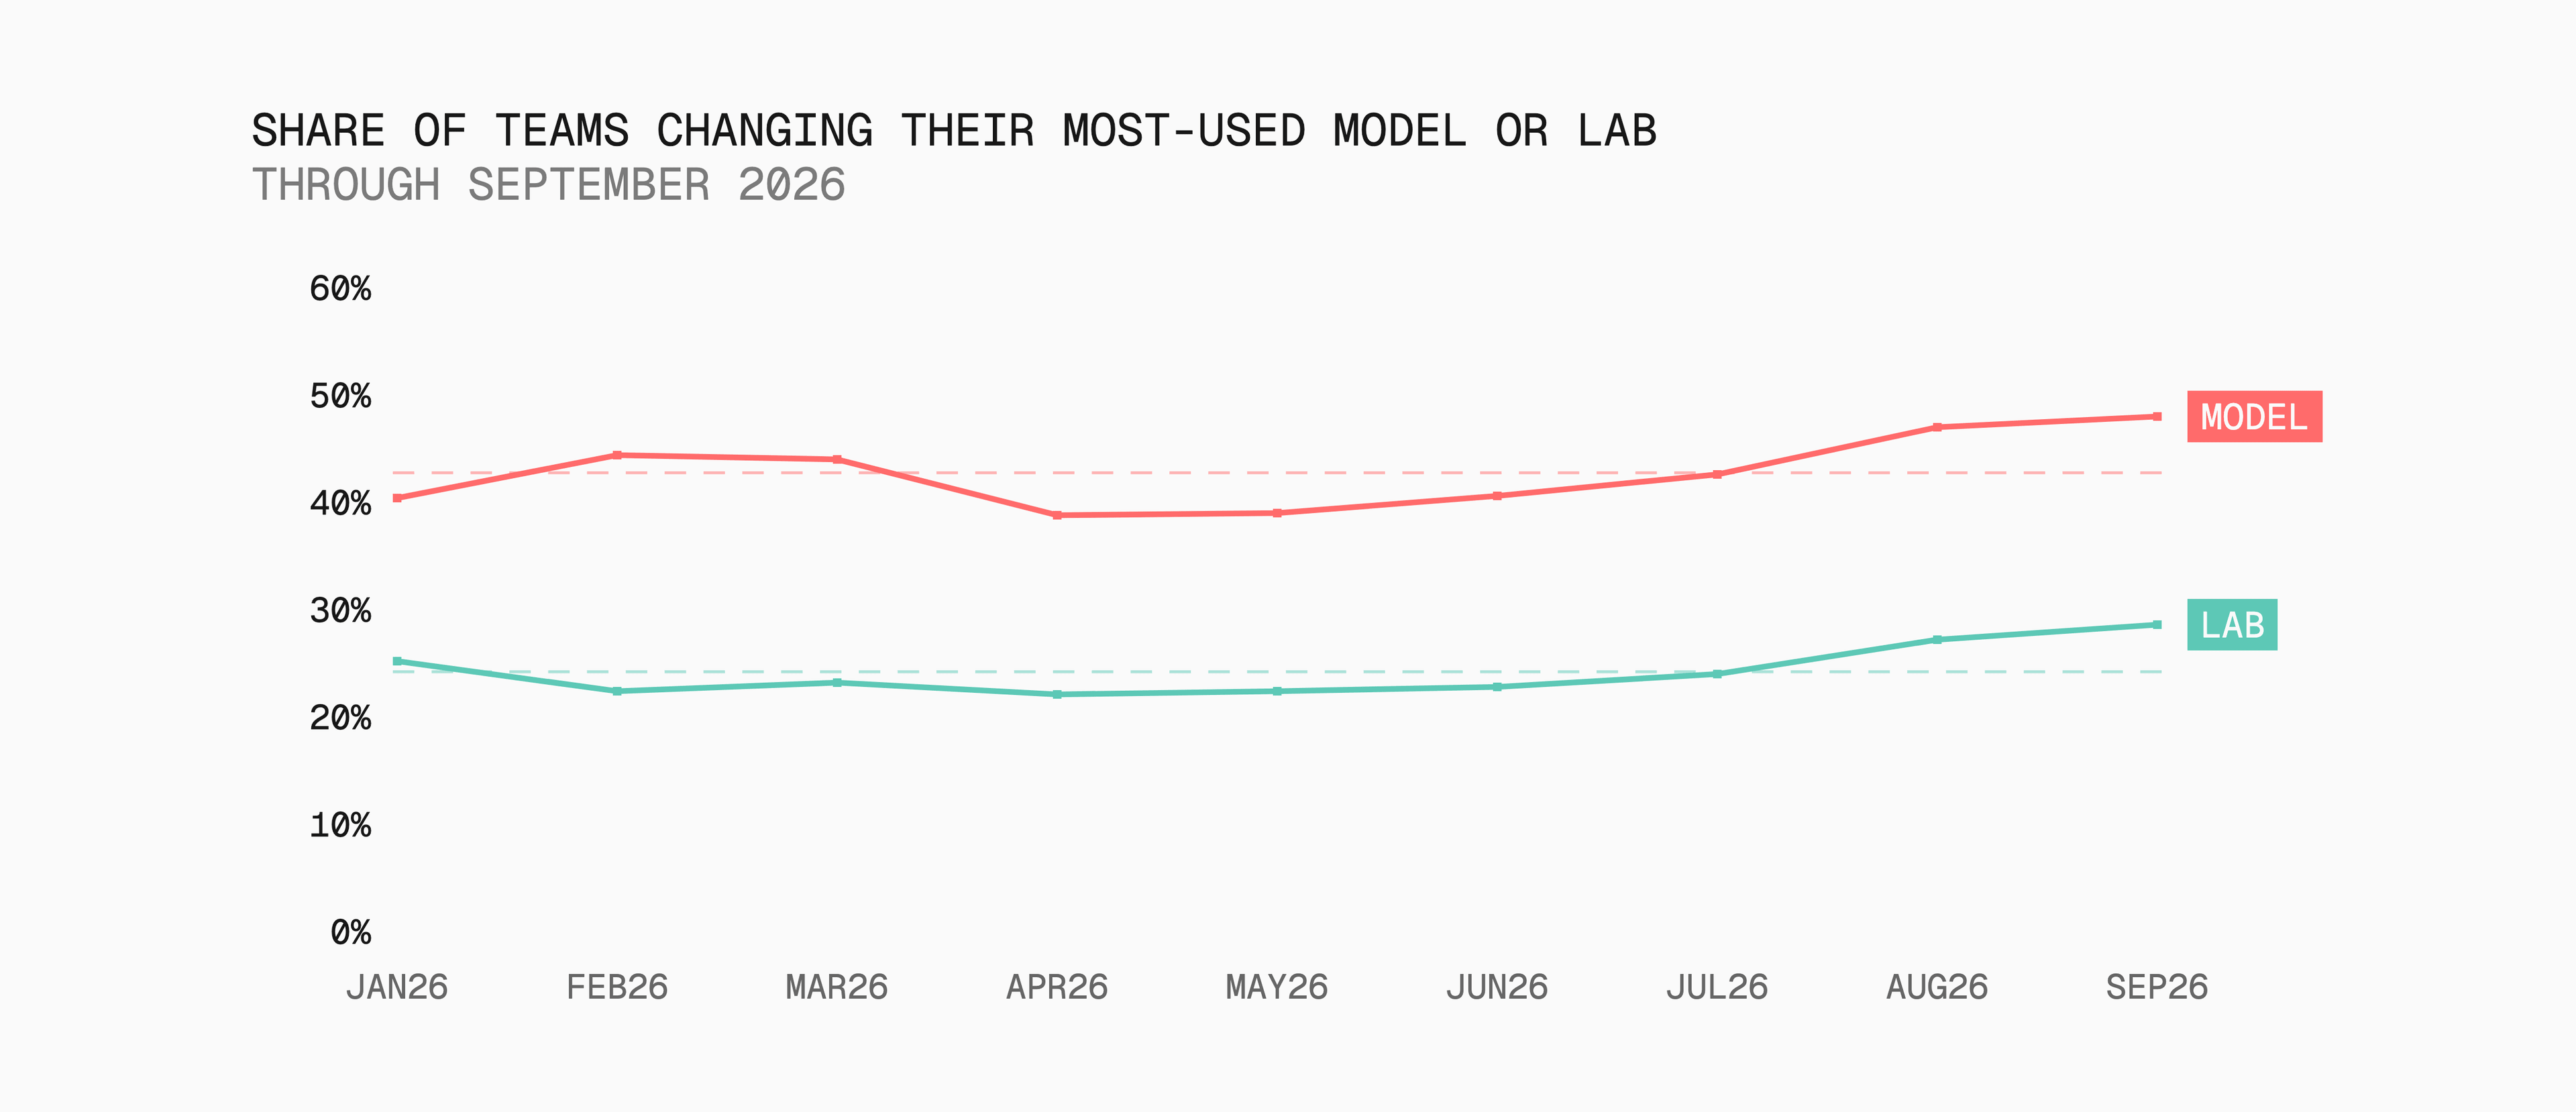
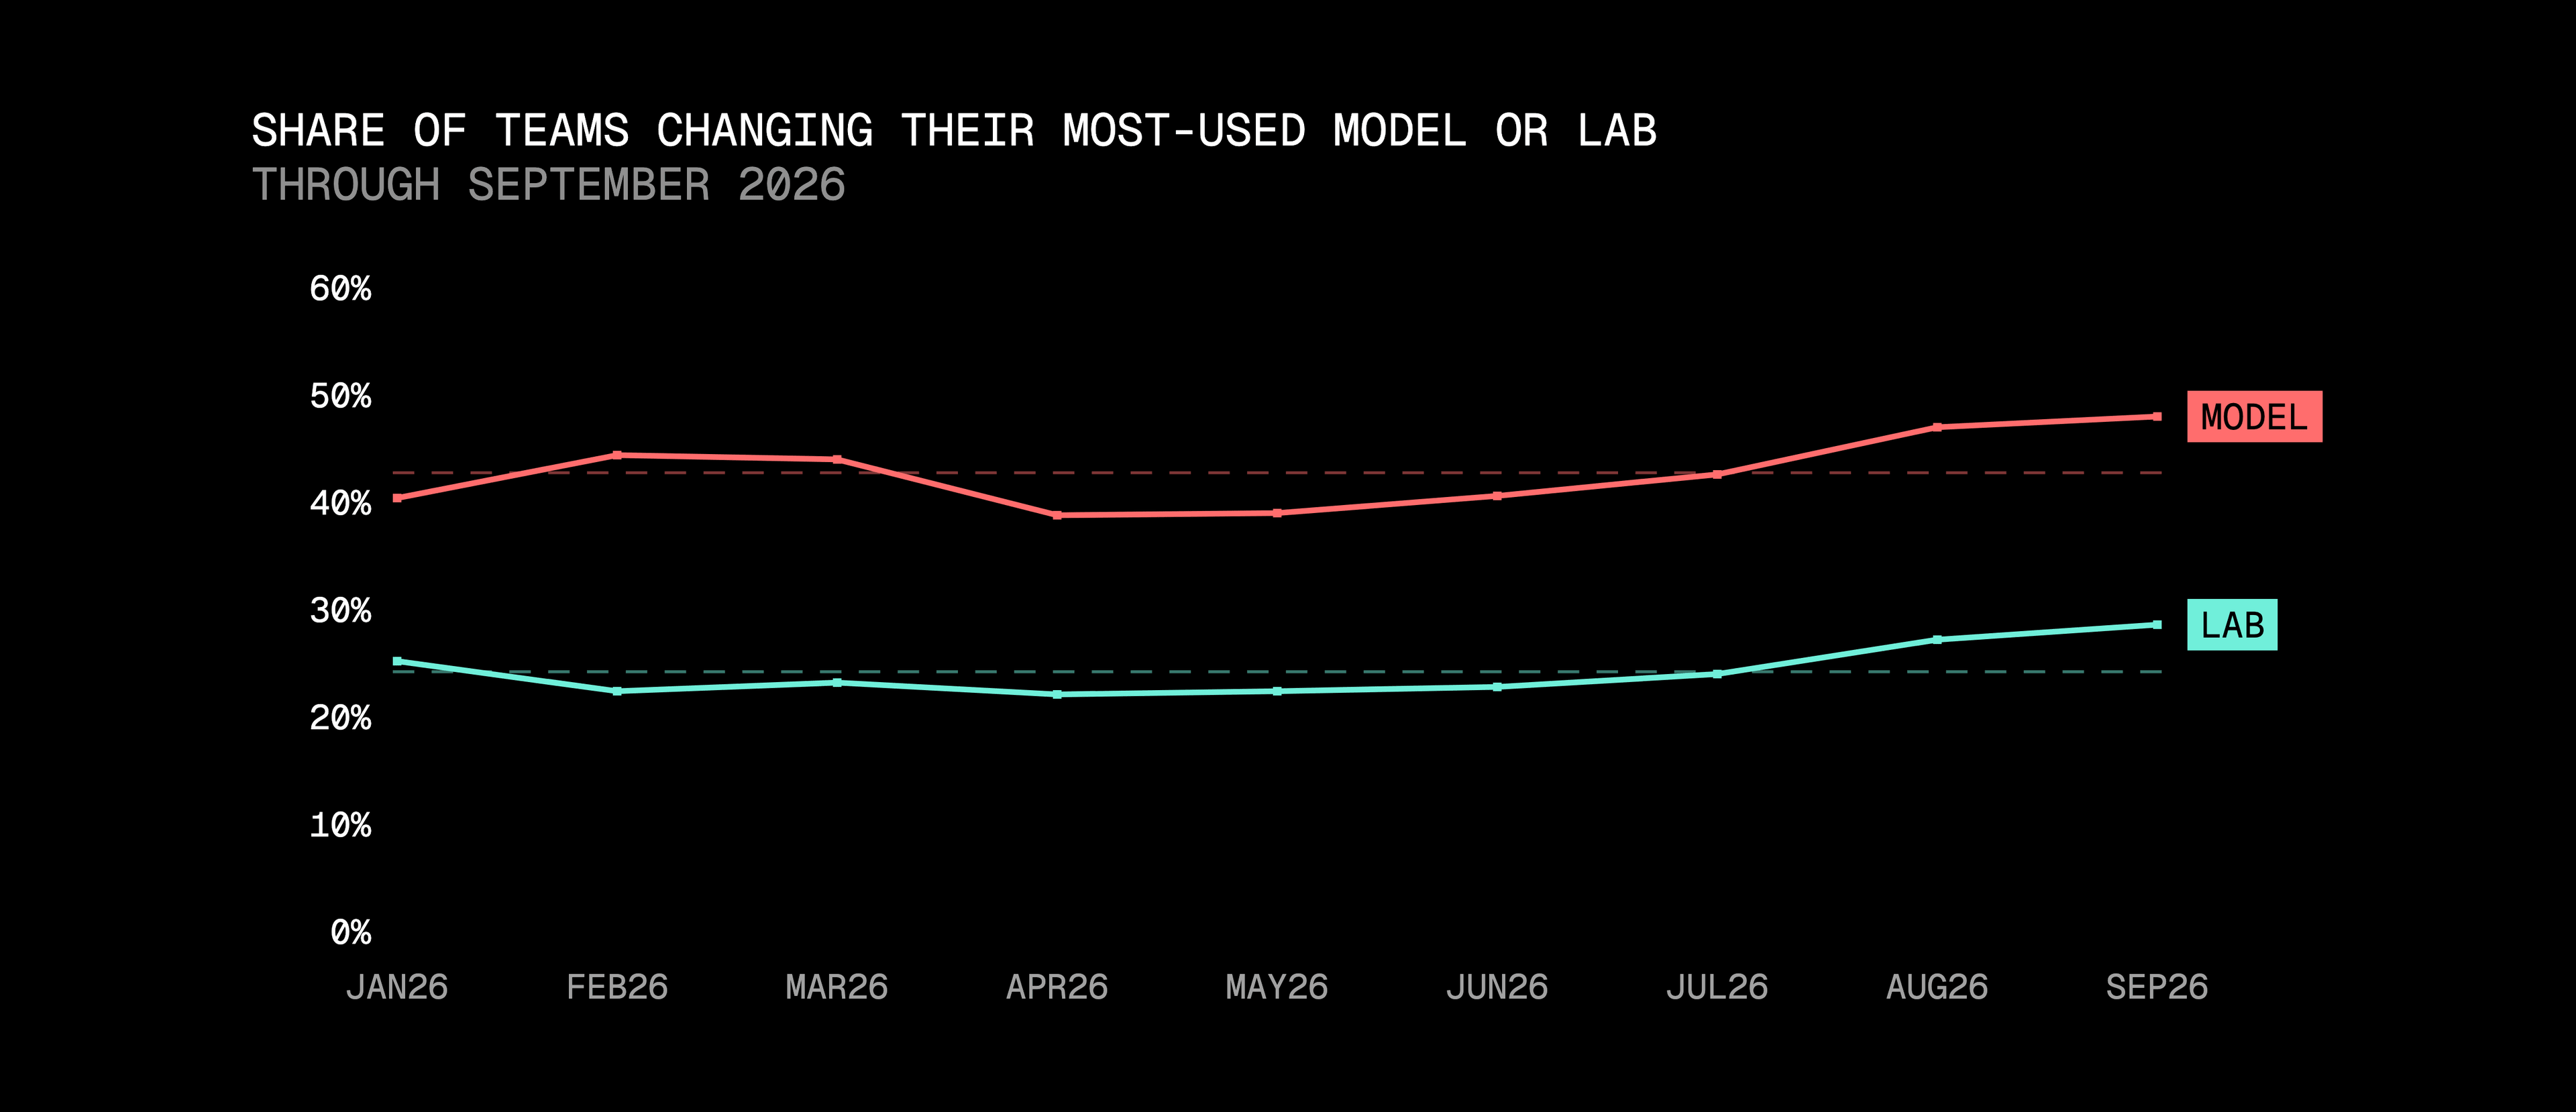
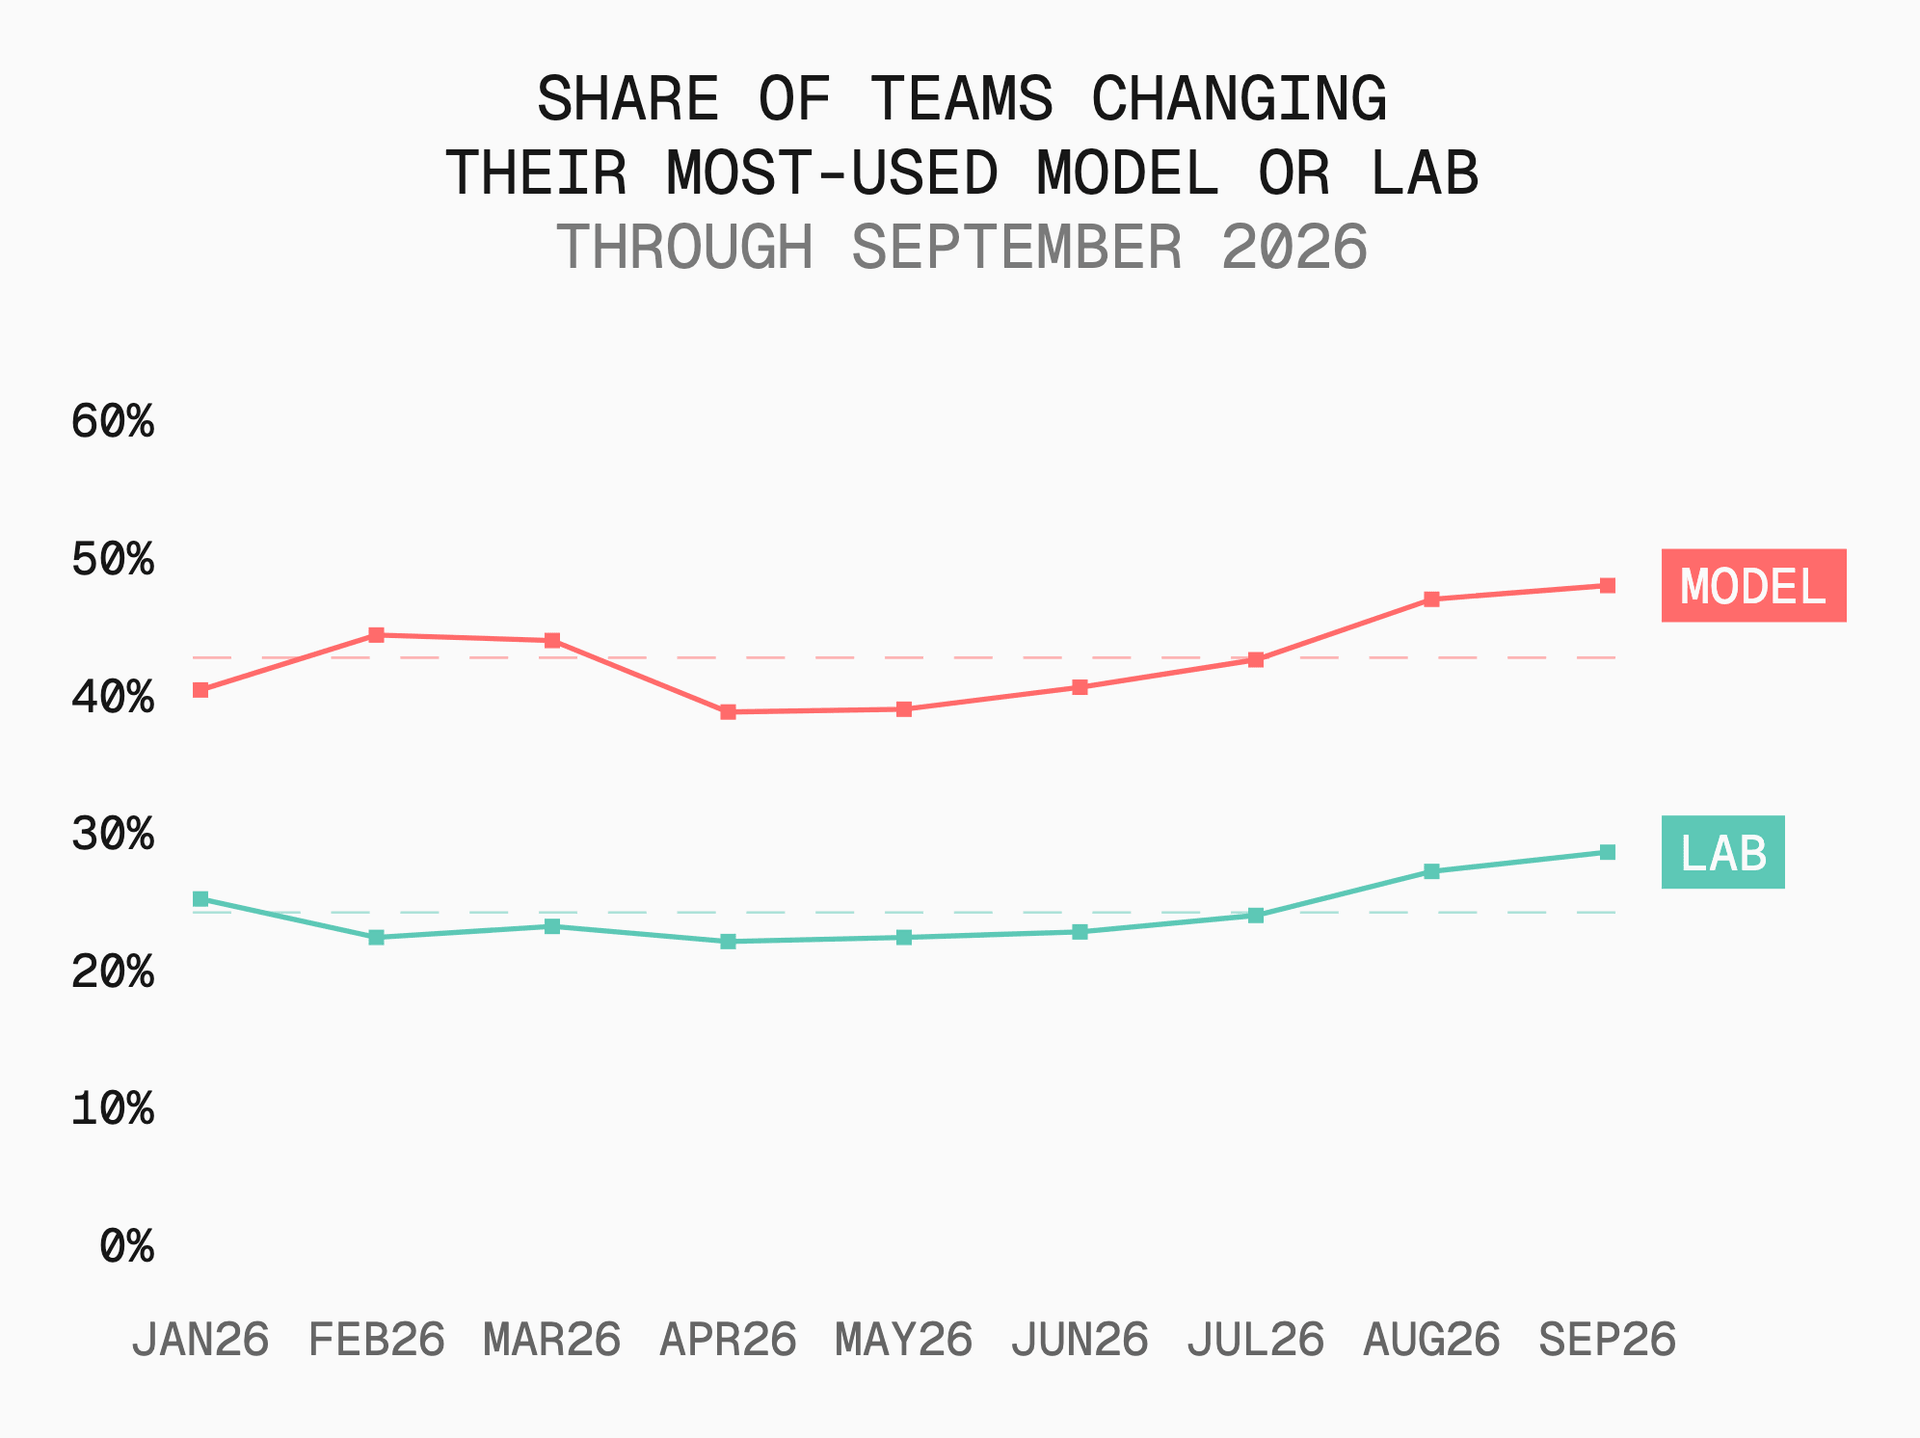
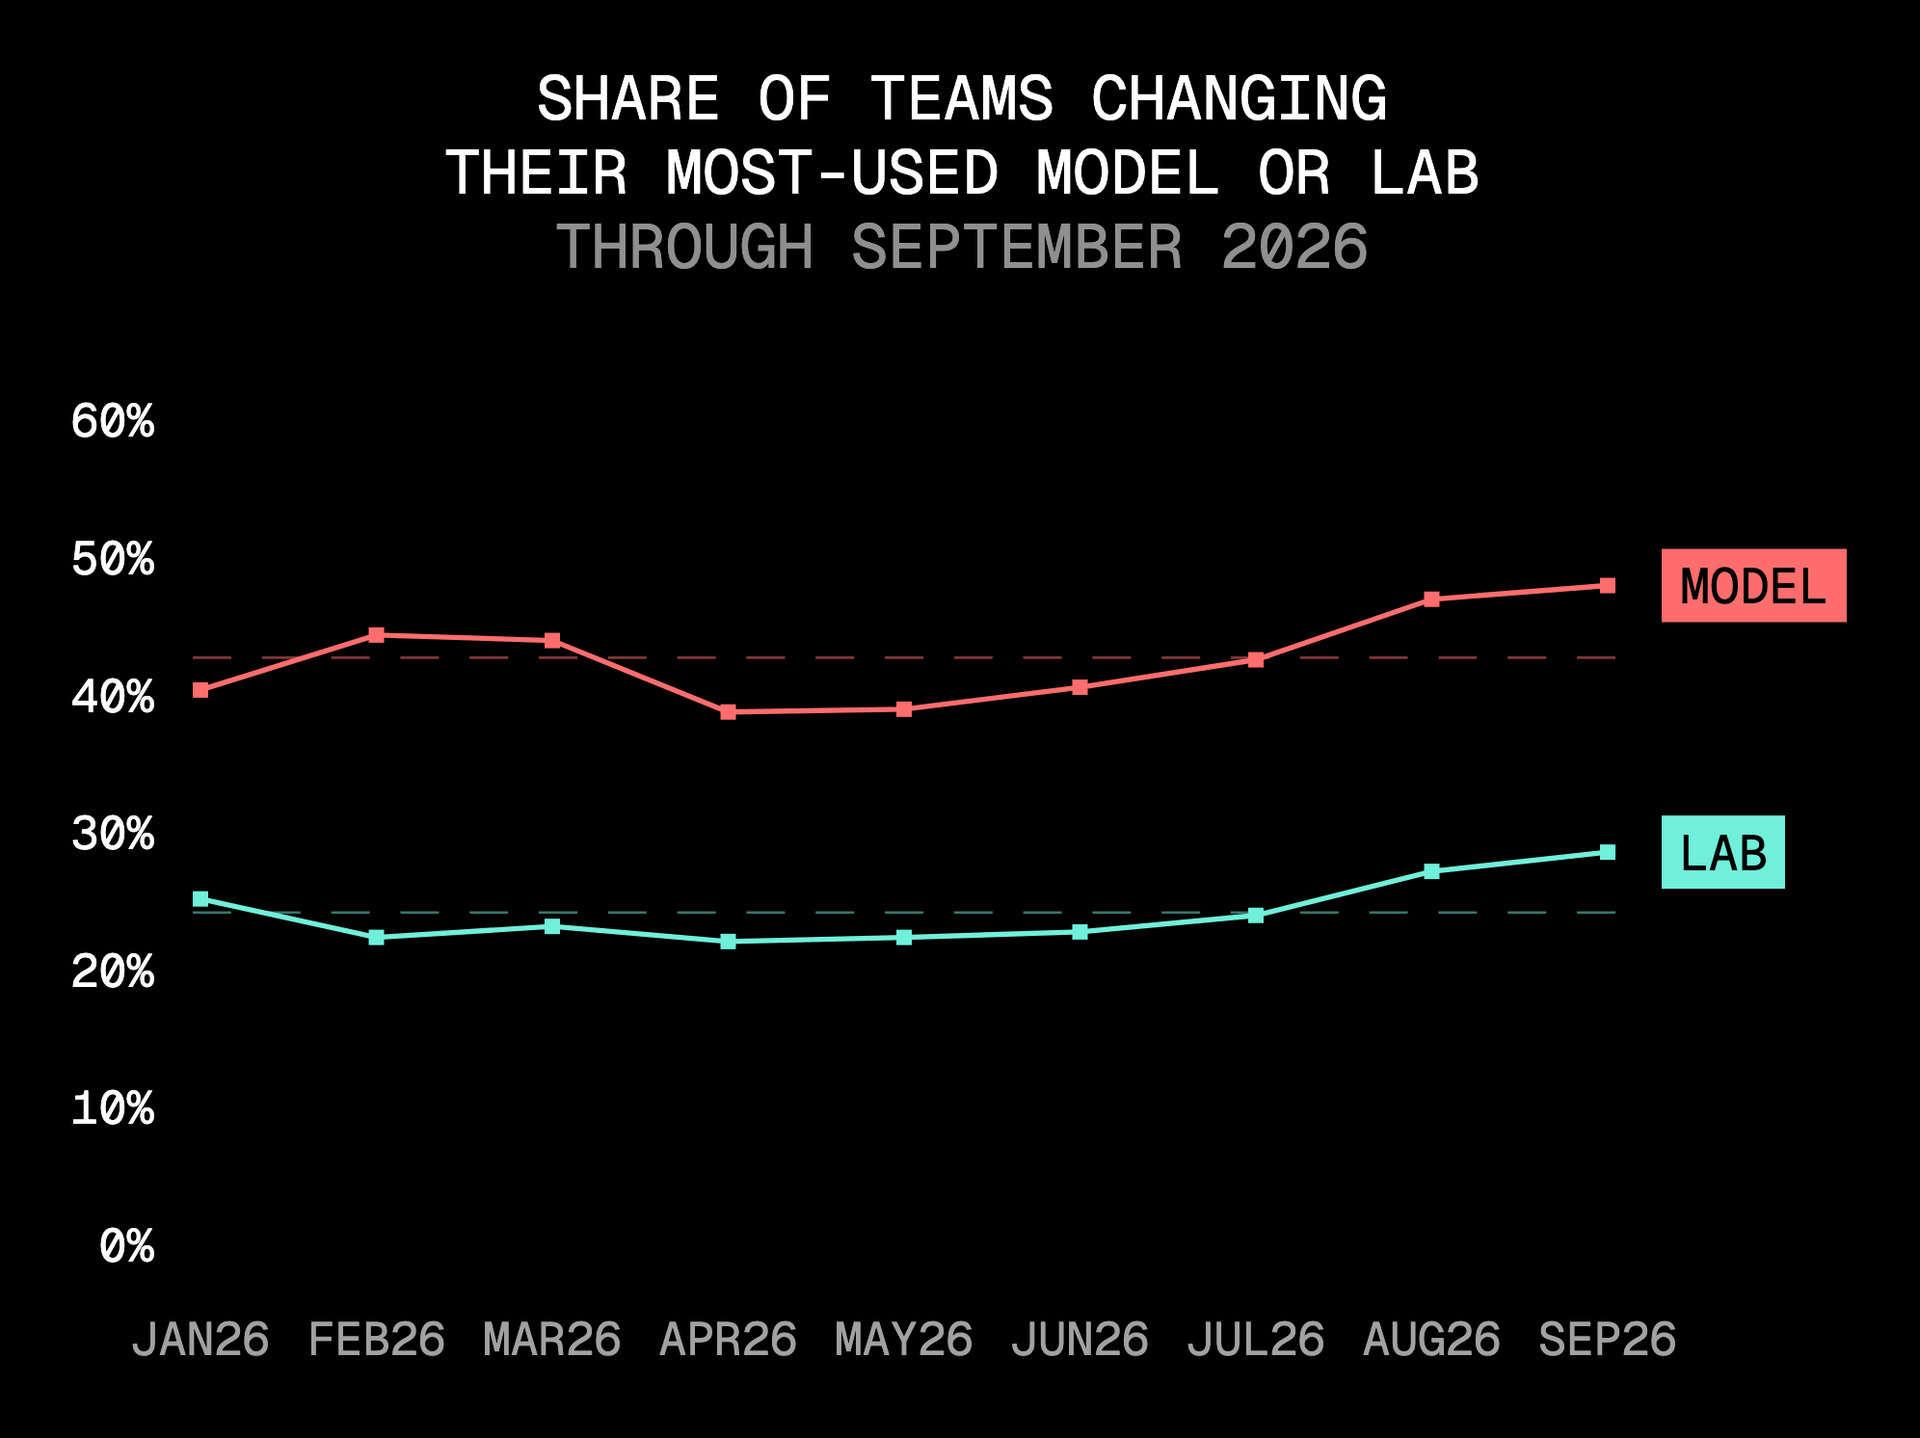
Labs have to keep earning that business. Nearly one in two teams changed its most-used model in September, and almost one in three changed its most-used lab — a record for the index, and the fifth consecutive monthly rise in model and lab switching.
Model diversity is already broad even among modest users. Over the December–September period, teams processing at least 10 million tokens used an average of 15 different models; the average rose to 26 for teams at 100 million tokens and 42 for teams at a billion.
Chinese models, American providers
More than two-thirds of September's gateway spend on Chinese-origin models went to US-based providers, versus less than a tenth in December — about $2.50 through US providers for every $1 through China-based ones. The Chinese lab builds the model; the American provider runs it and sells access.
DeepSeek's line processed 58% of all gateway tokens for 6.6% of spend; more than four in five of those tokens were served by DeepSeek itself, yet two in five dollars spent on its models went through US-based providers. Moonshot AI, the Beijing lab behind Kimi, took 3.6% of tokens and 13.2% of spend, with US-based providers serving nine in ten of those tokens. Z.ai, also Beijing-based and the creator of GLM, accounted for 7.2% of tokens and 4.5% of spend, with seven in ten served from the US.
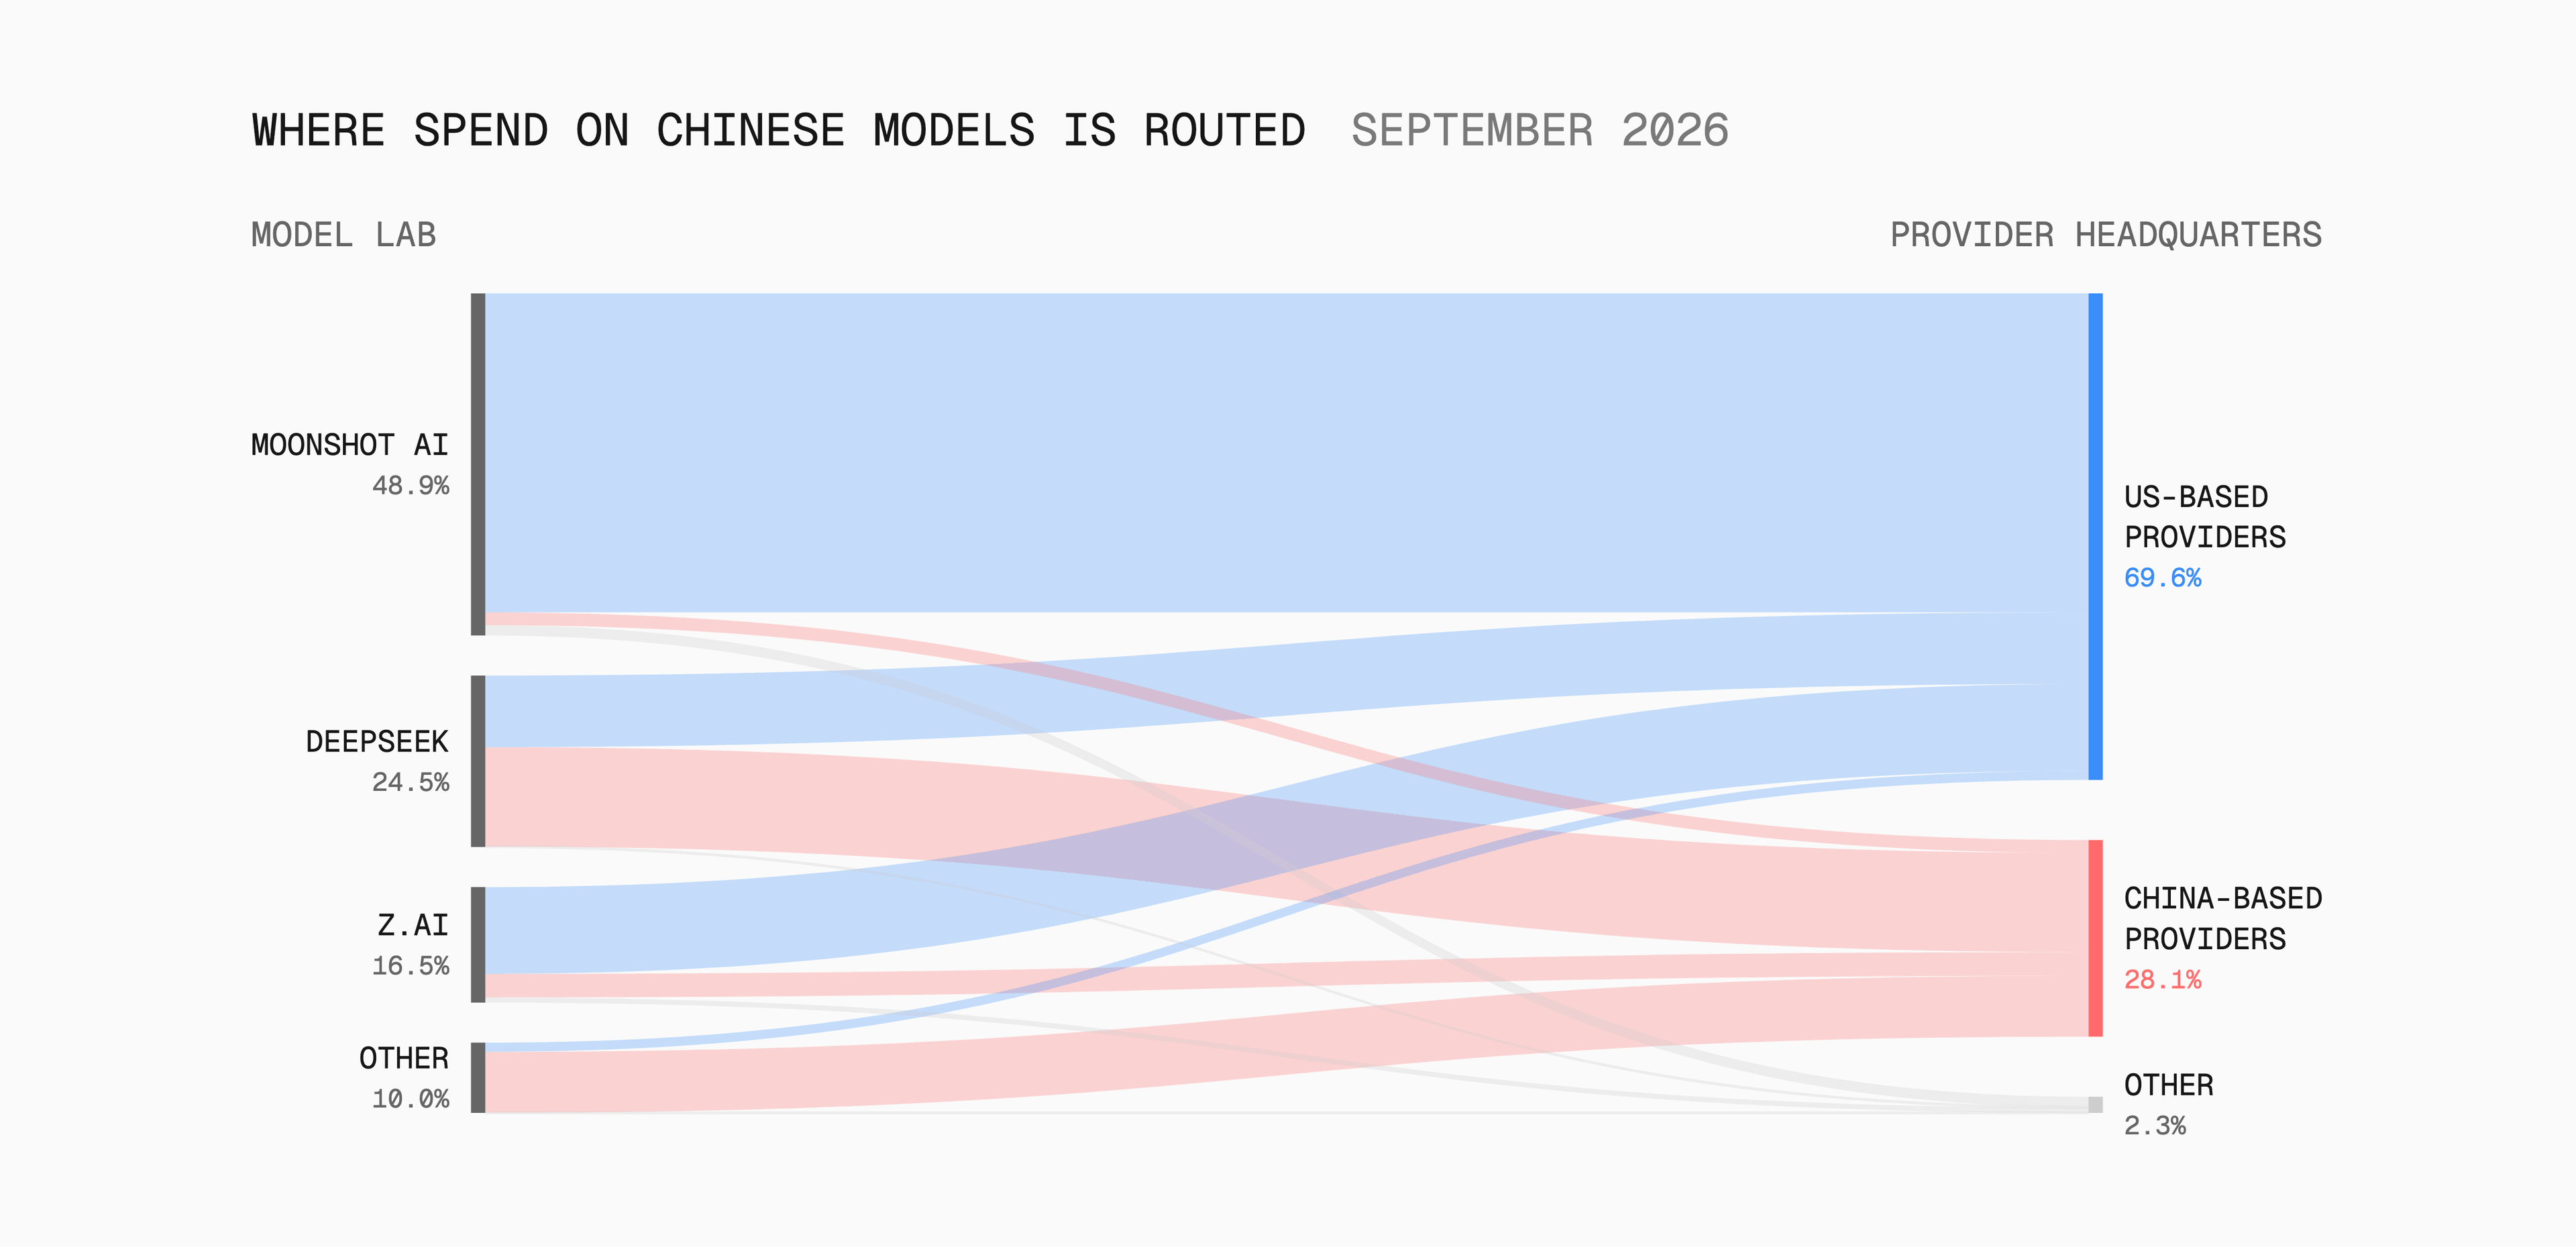
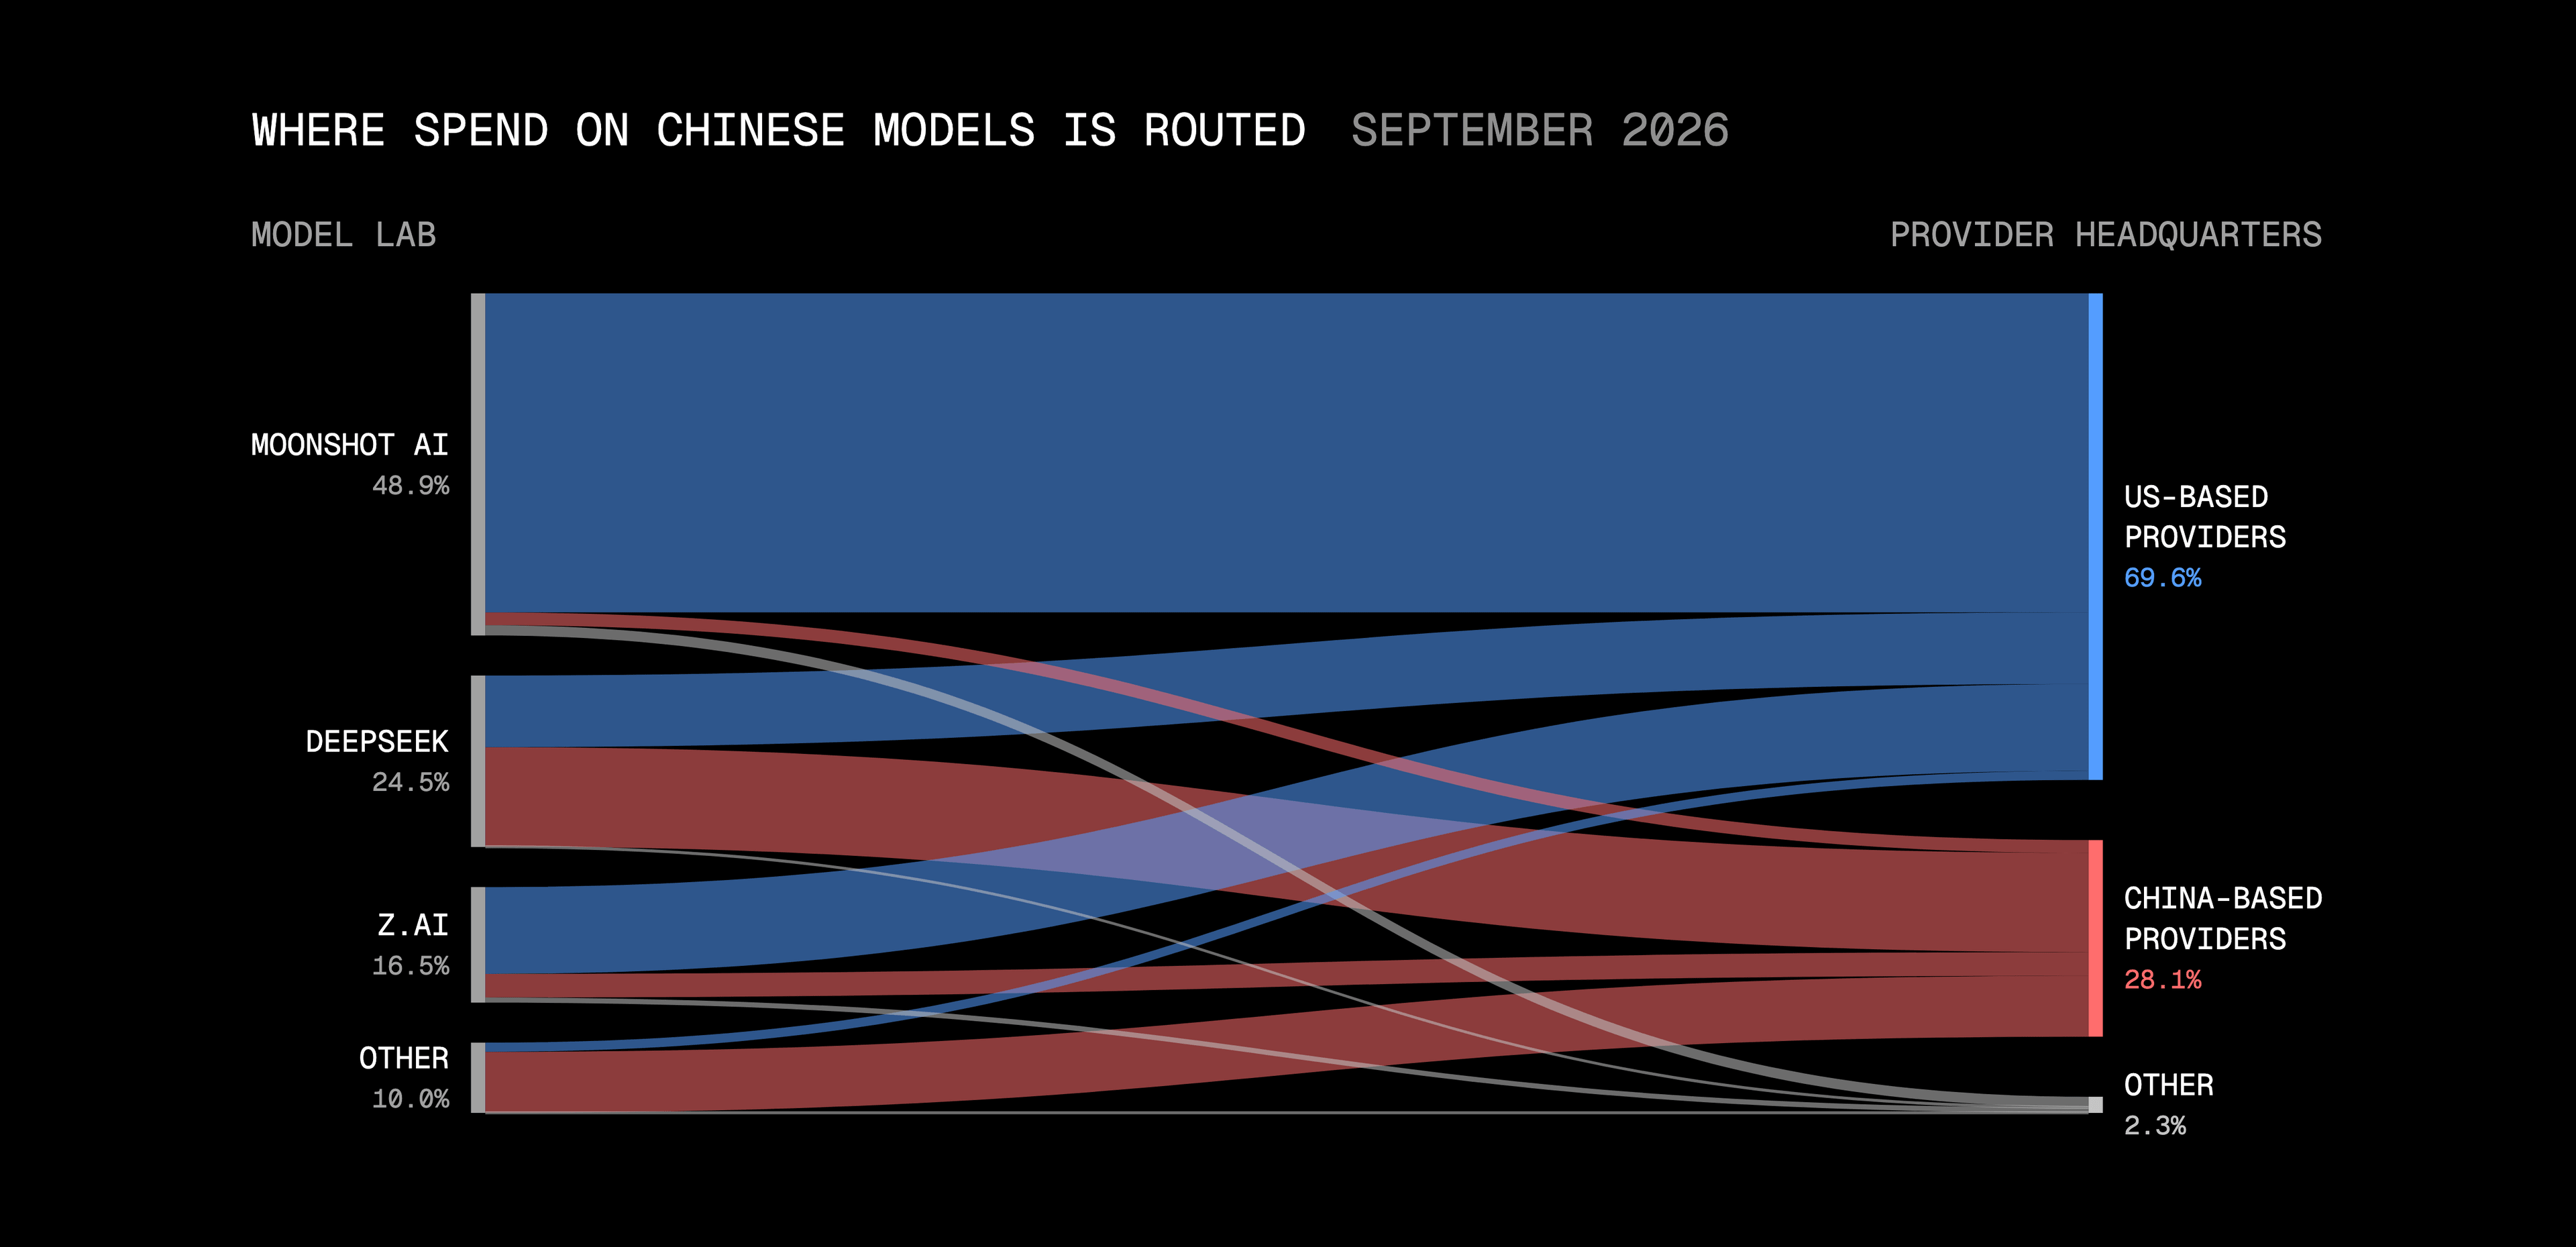
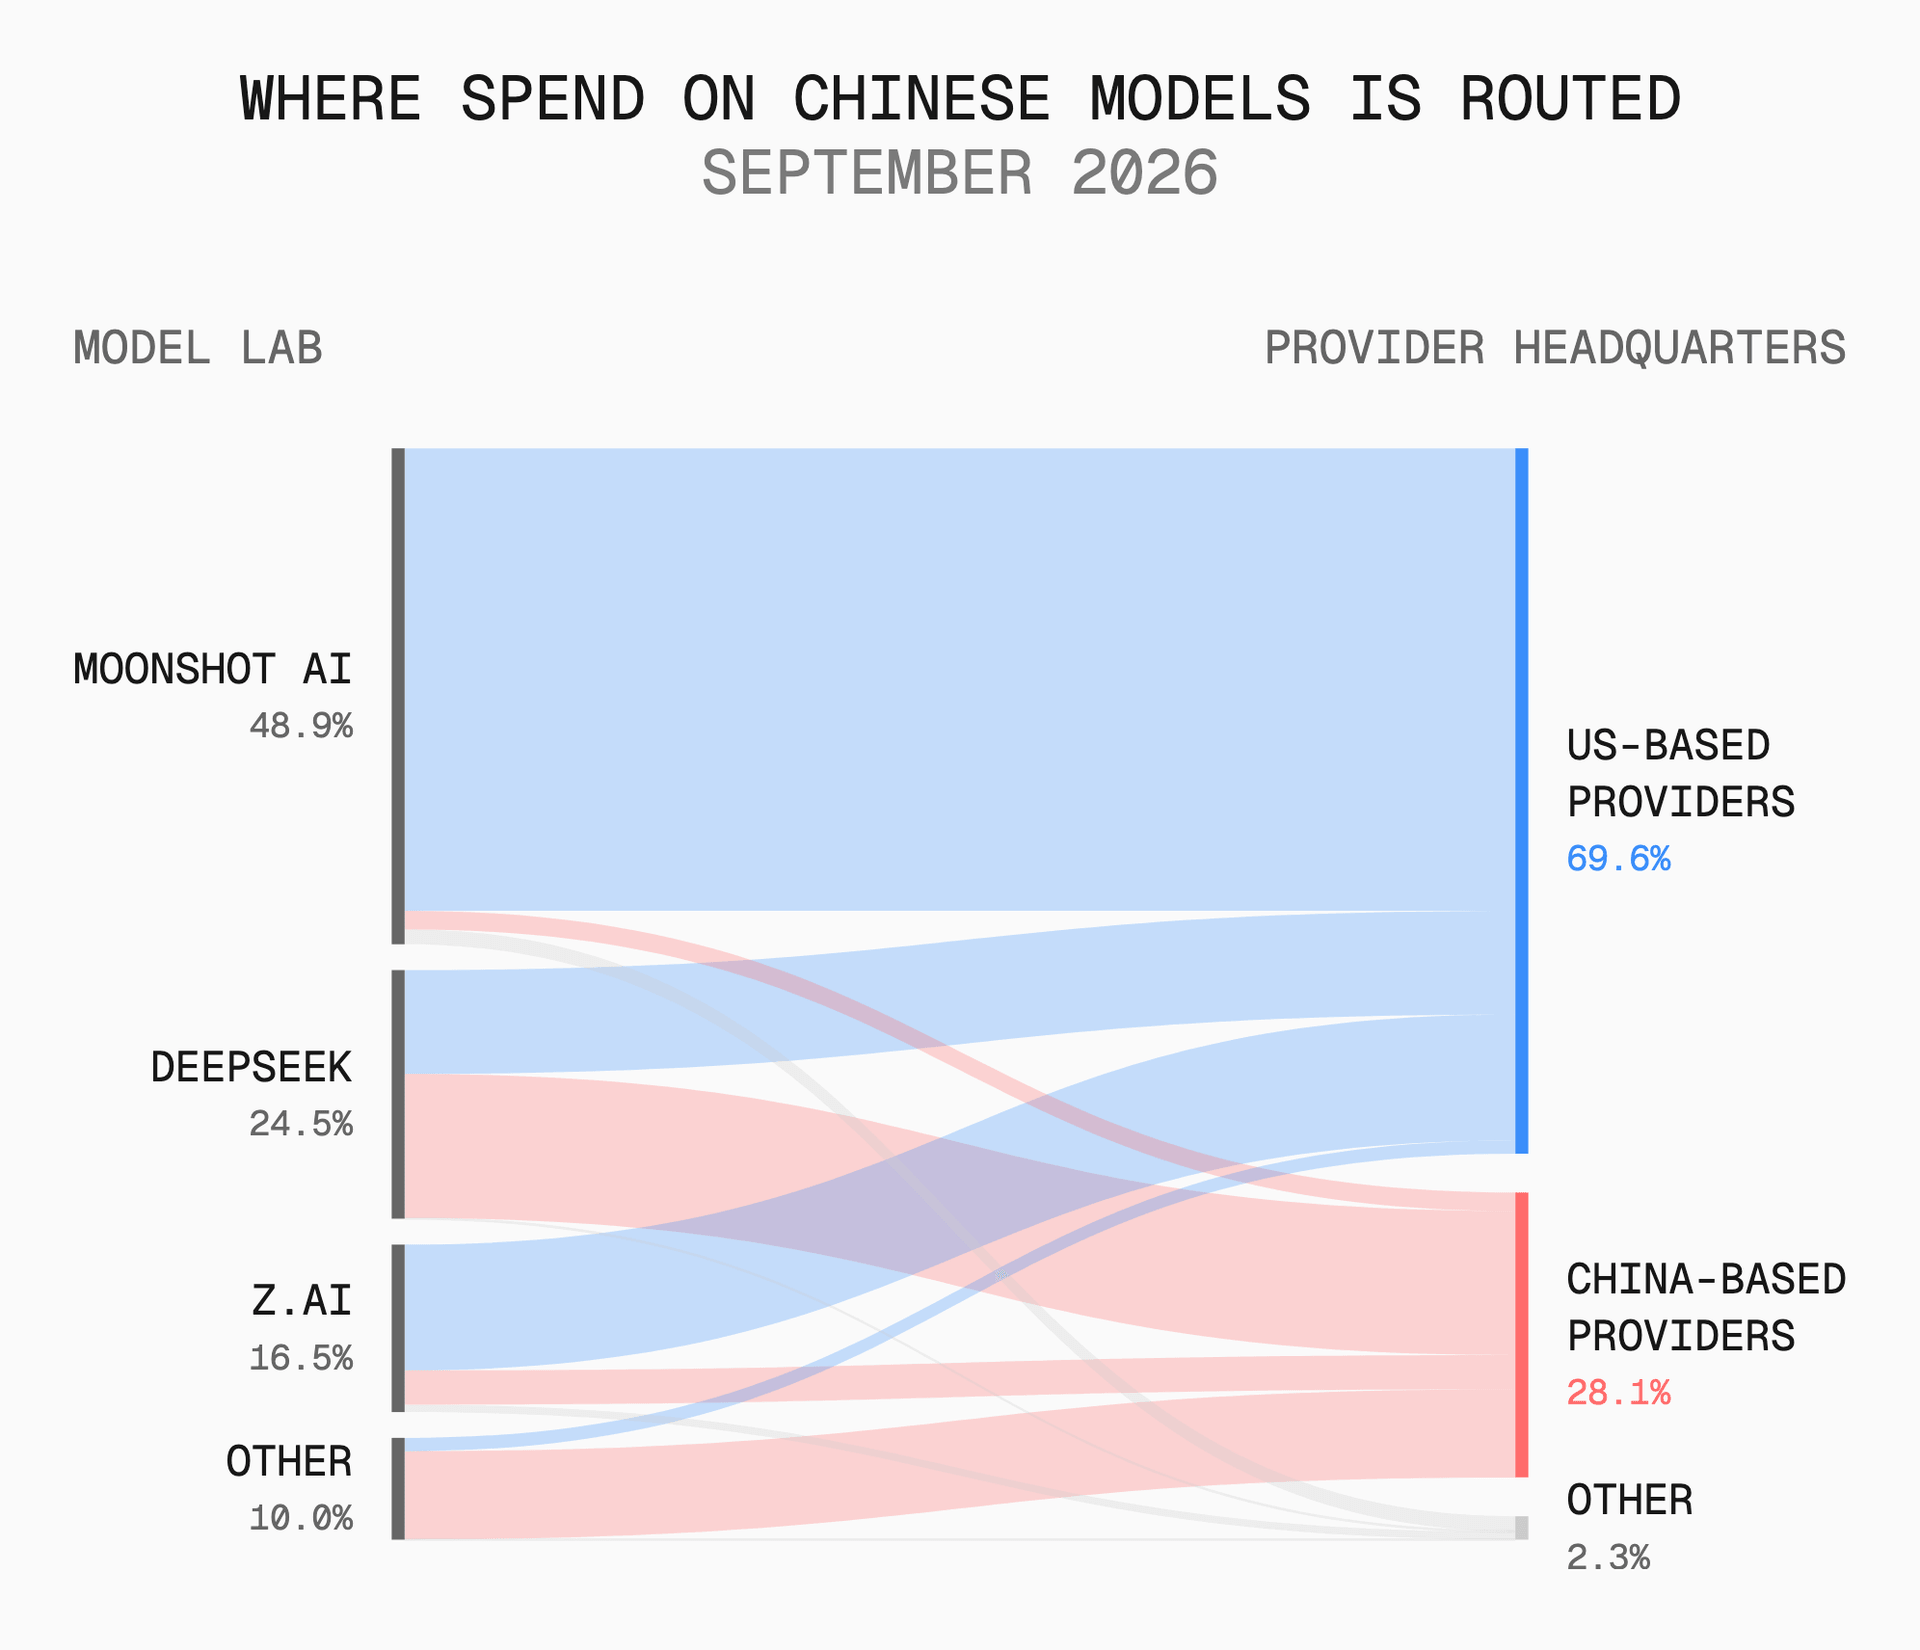
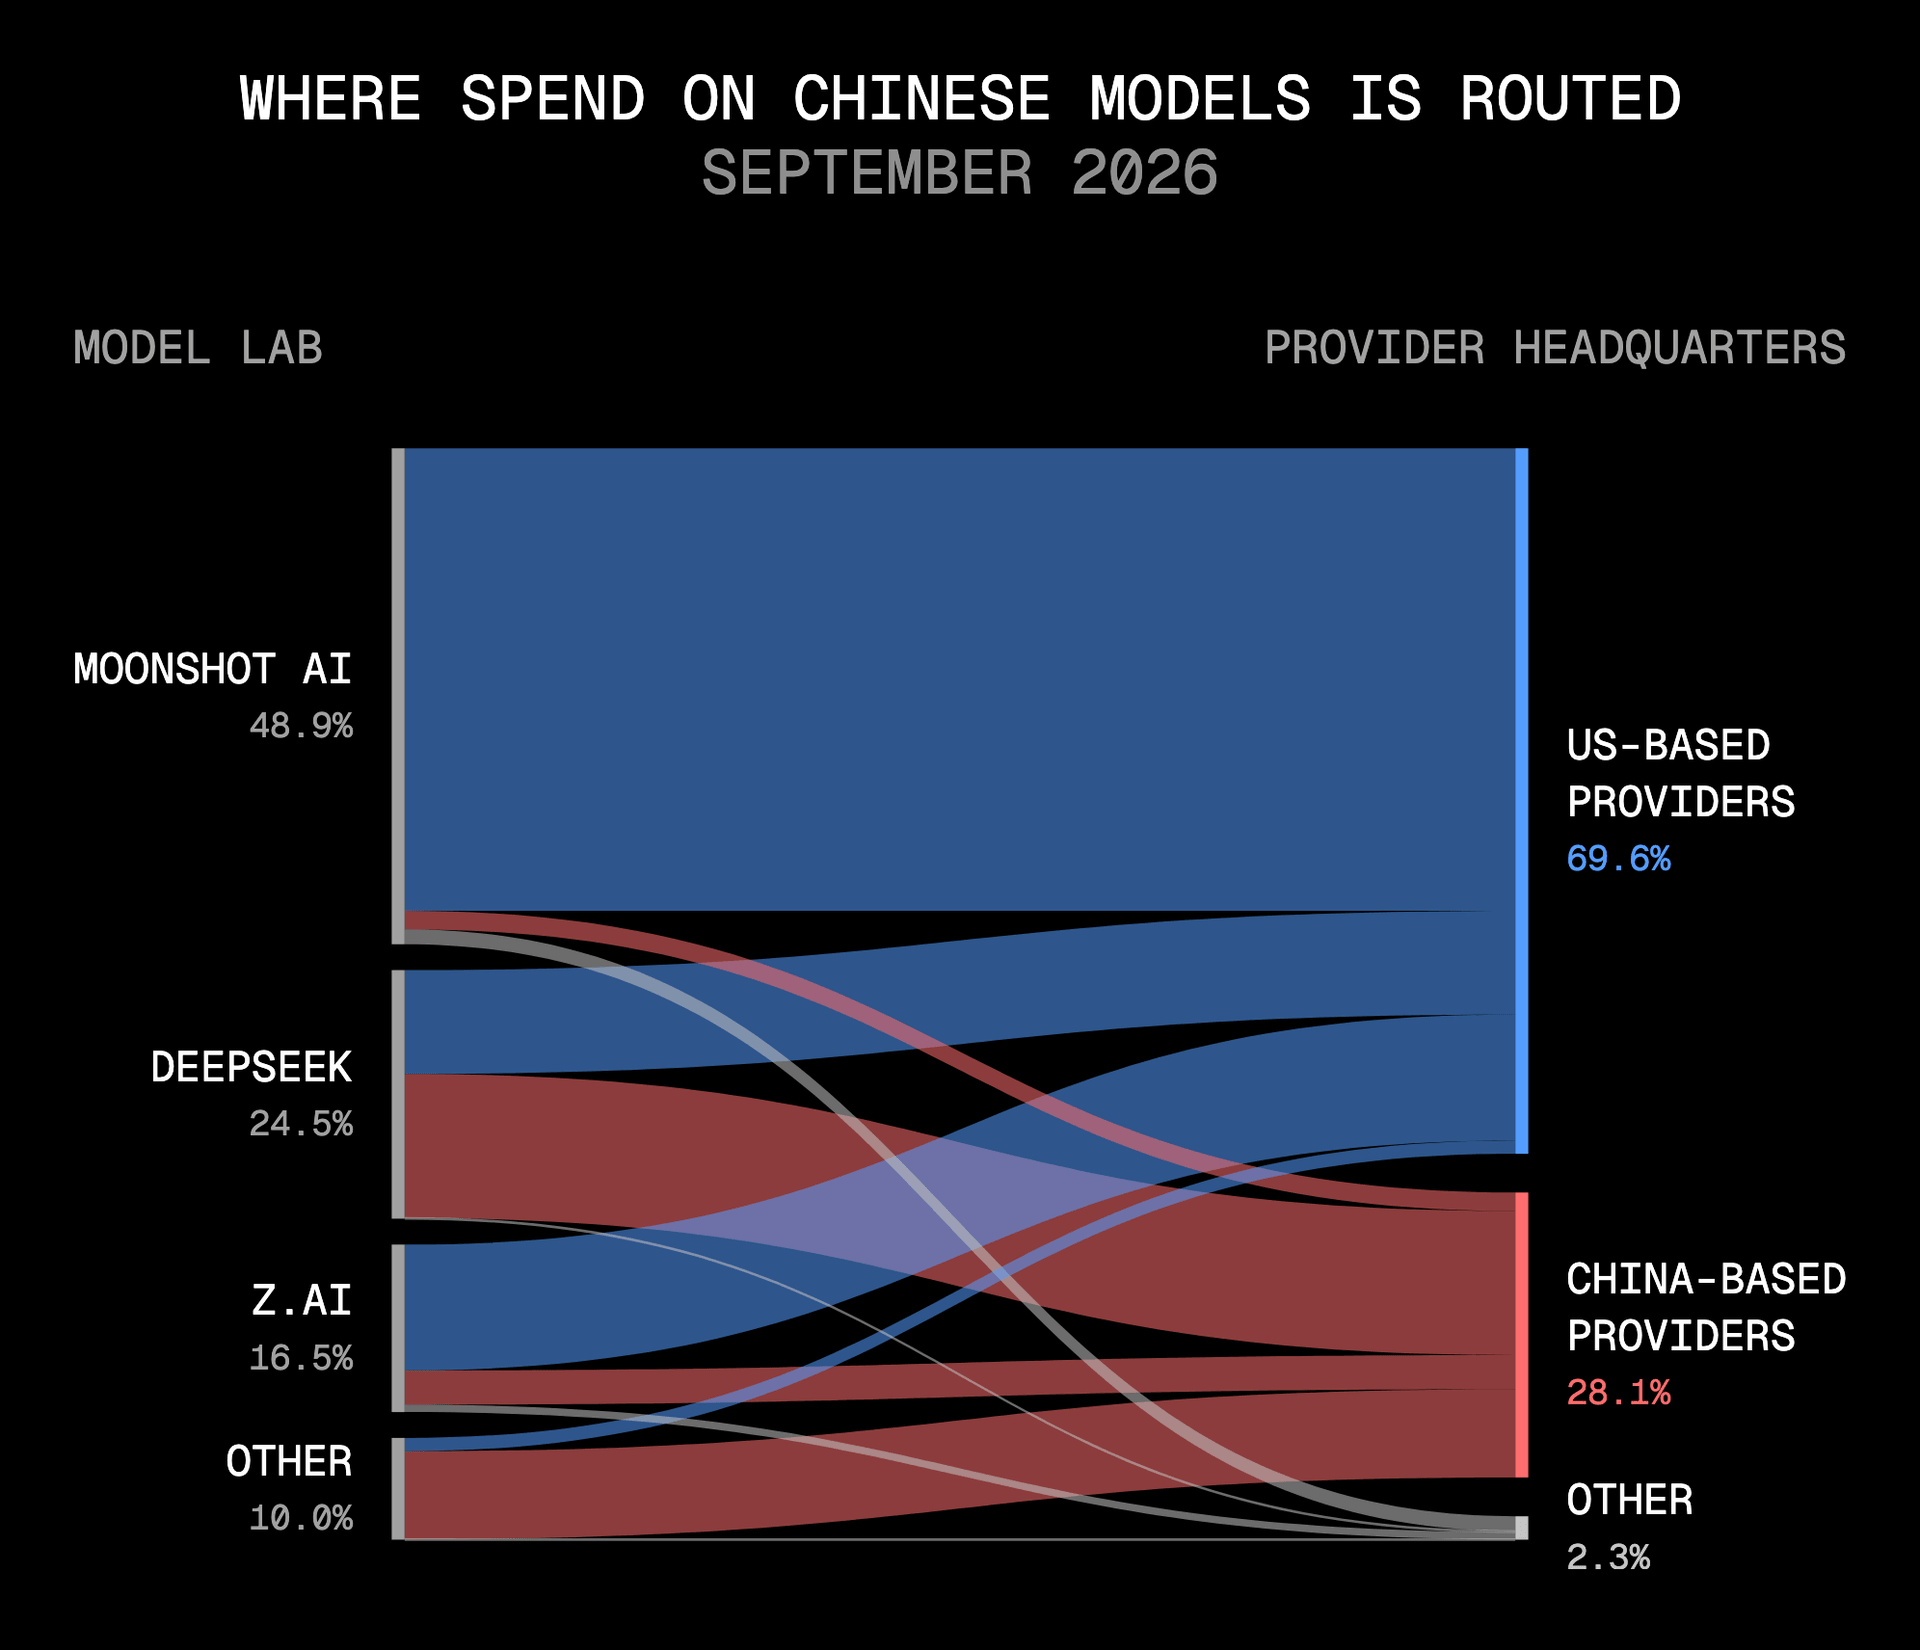
Among teams that increased spending on Chinese models in September, an average of 53% of that spending went through US-based providers and 41% through China-based ones. A single Chinese model can compete with US-built ones while generating revenue for US providers.
Launch scorecard: Jev, Opus 5.5, Luna and Astra
A launch can succeed by different measures — reach, usage, spend, or how many first-time users return. September's launches were ranked on each; the tables below show the leaders.
Jev: fastest adoption on record, negligible share of spend
In its first two weeks, Jev reached 35% of paid teams, nearly double Sonnet 5.5 in second place and the fastest adoption of any model in AI Gateway history. It also took the most requests of any model in September despite launching mid-month, and 55.6% of teams that tried it in week one returned in week two — the fifth-highest retention of the month.
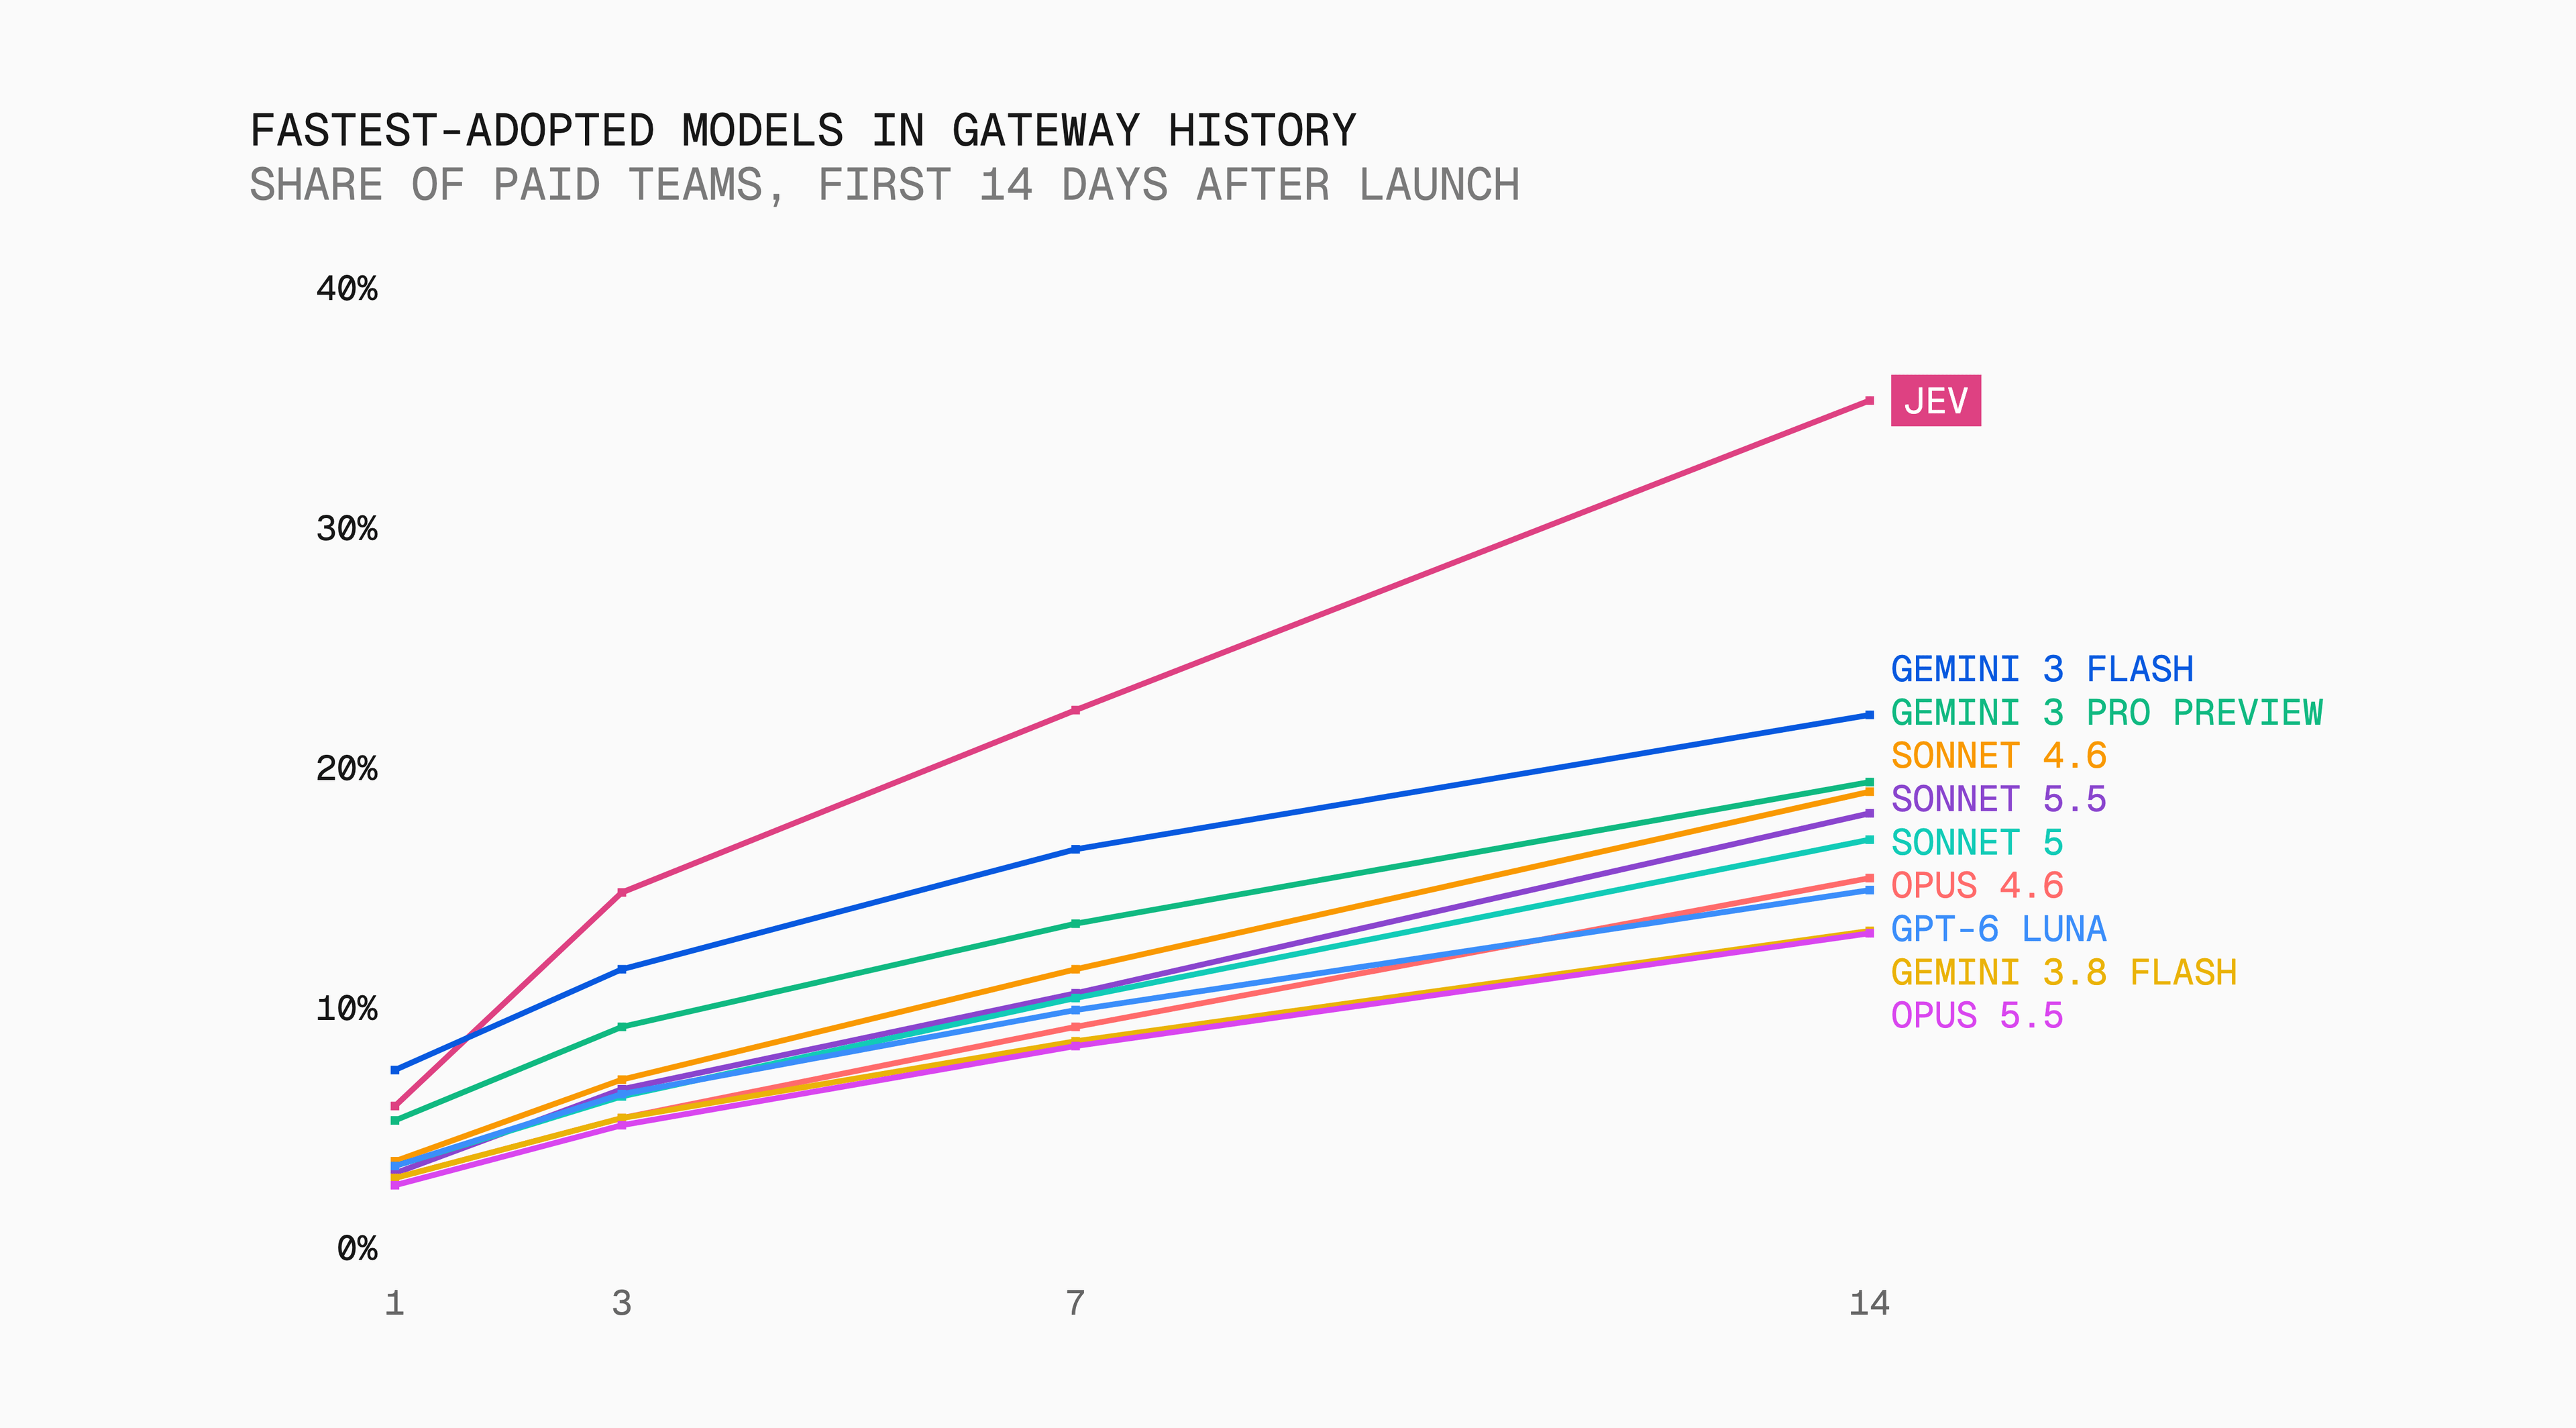
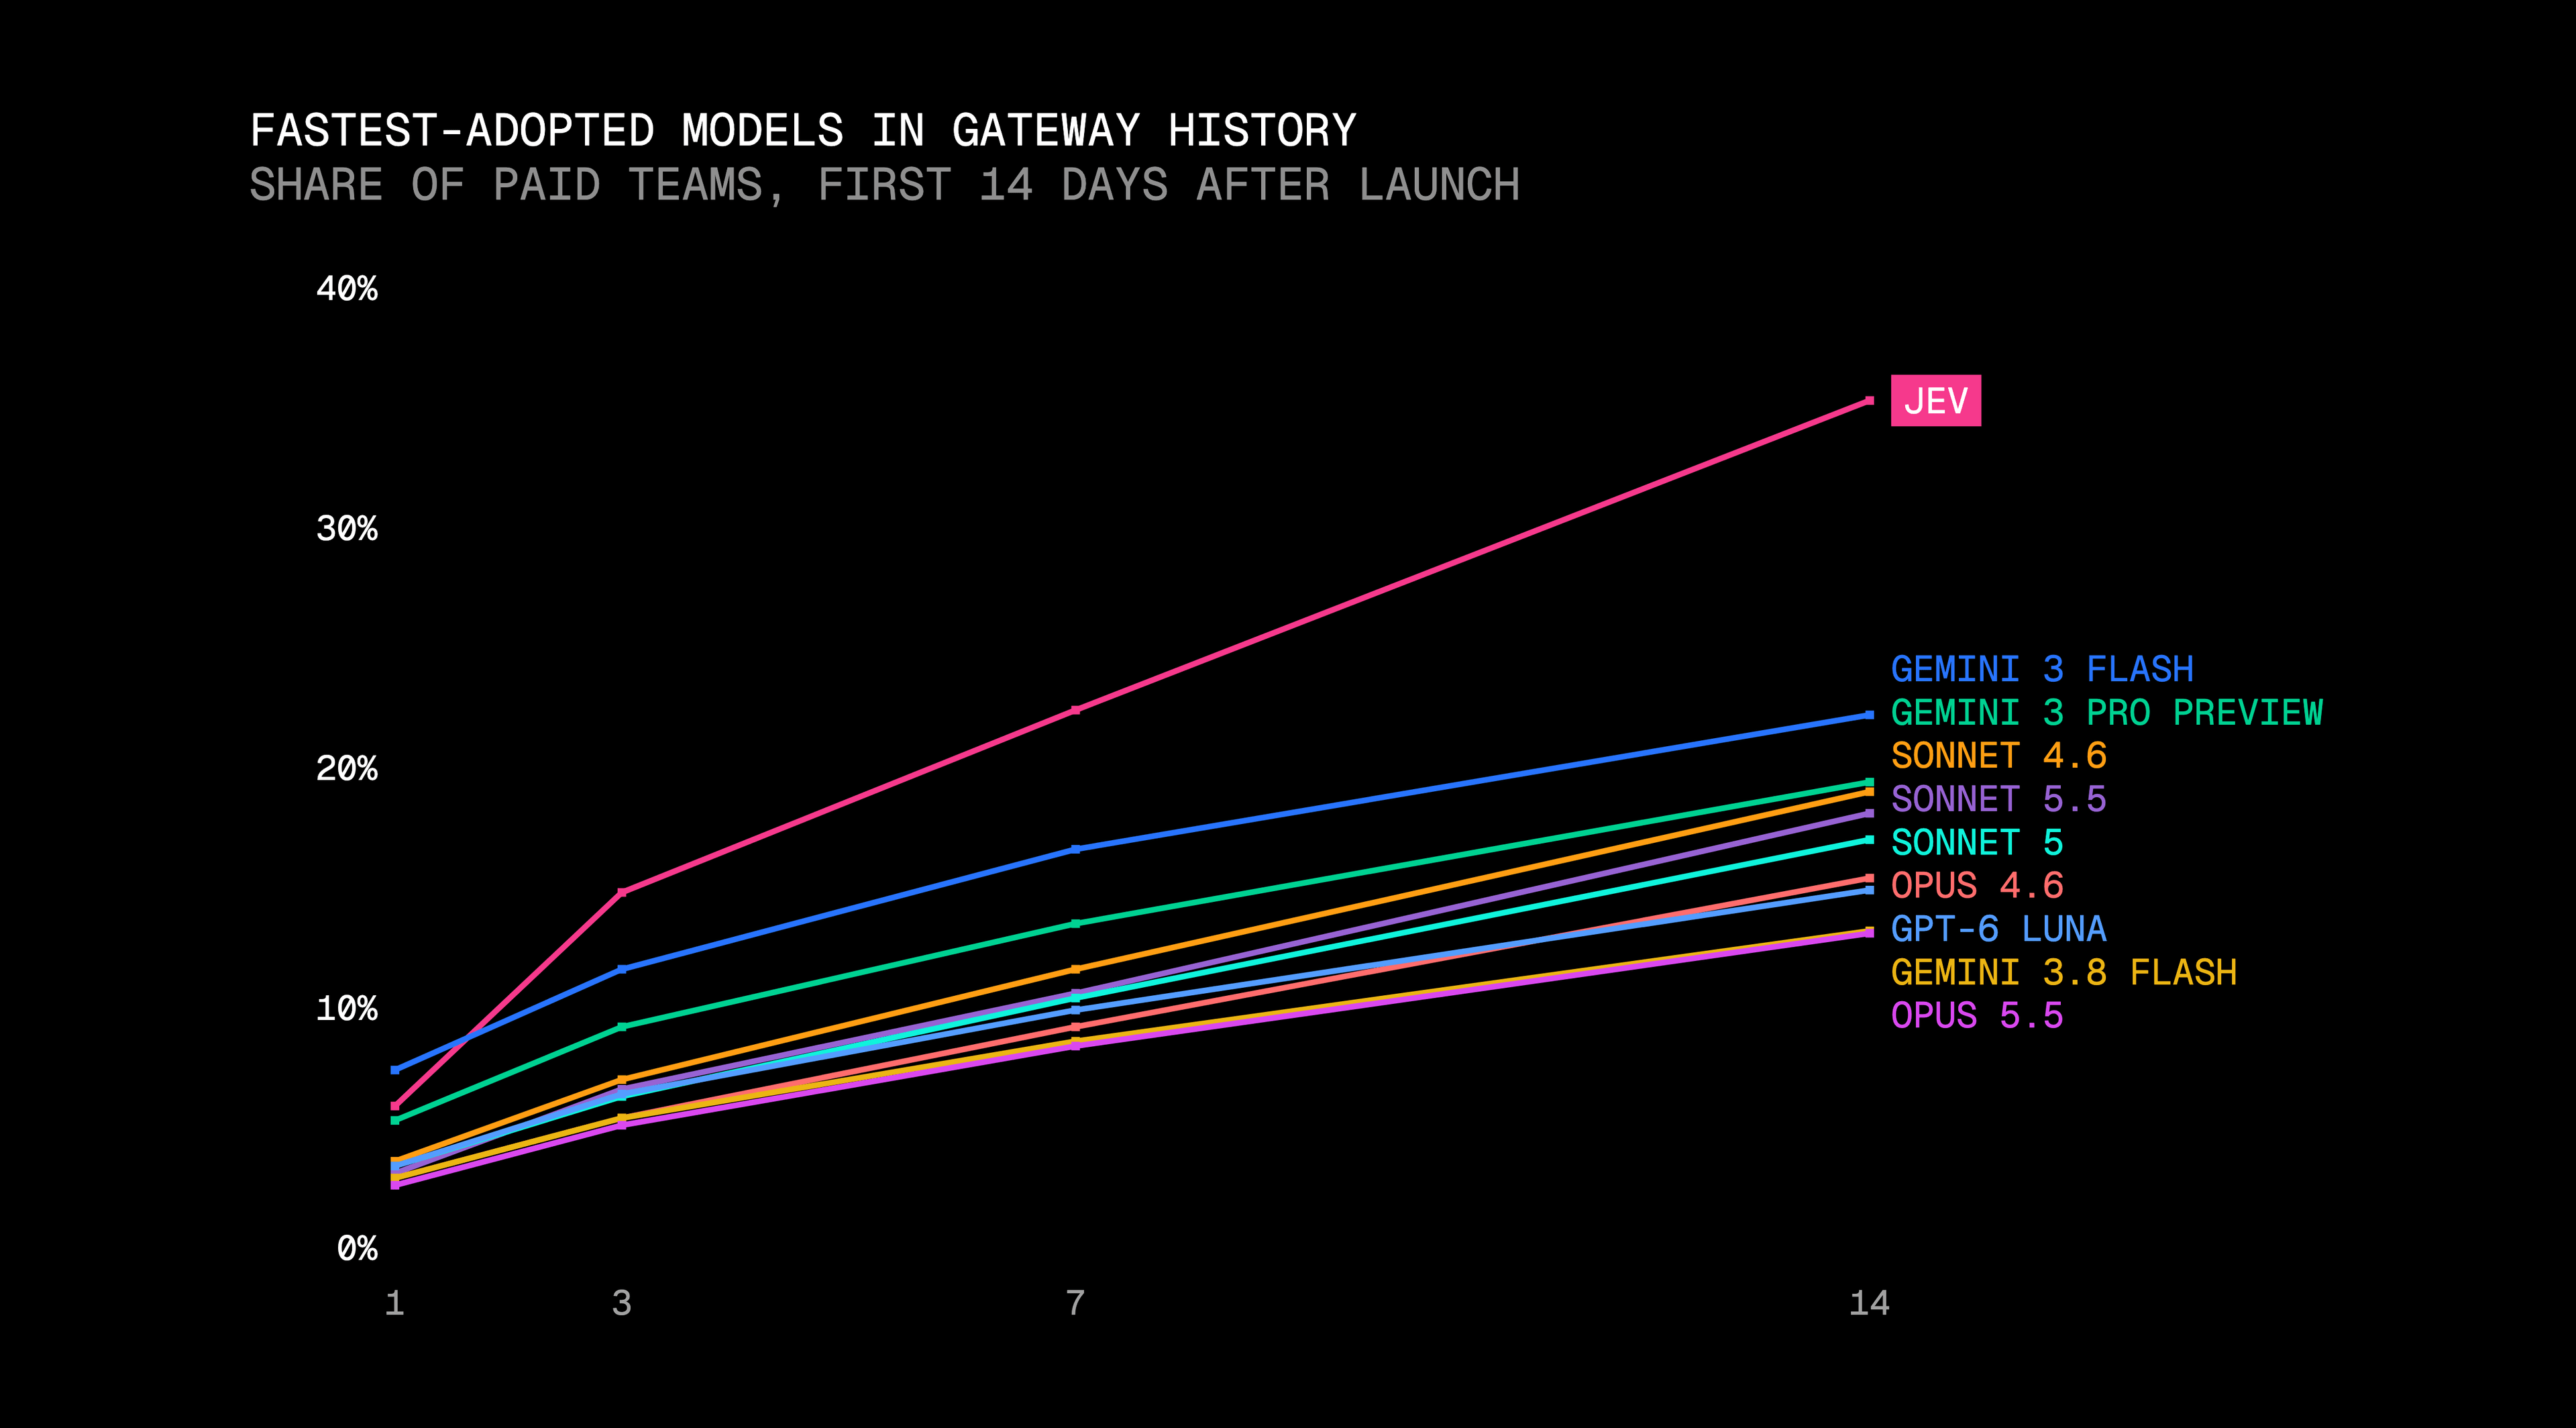
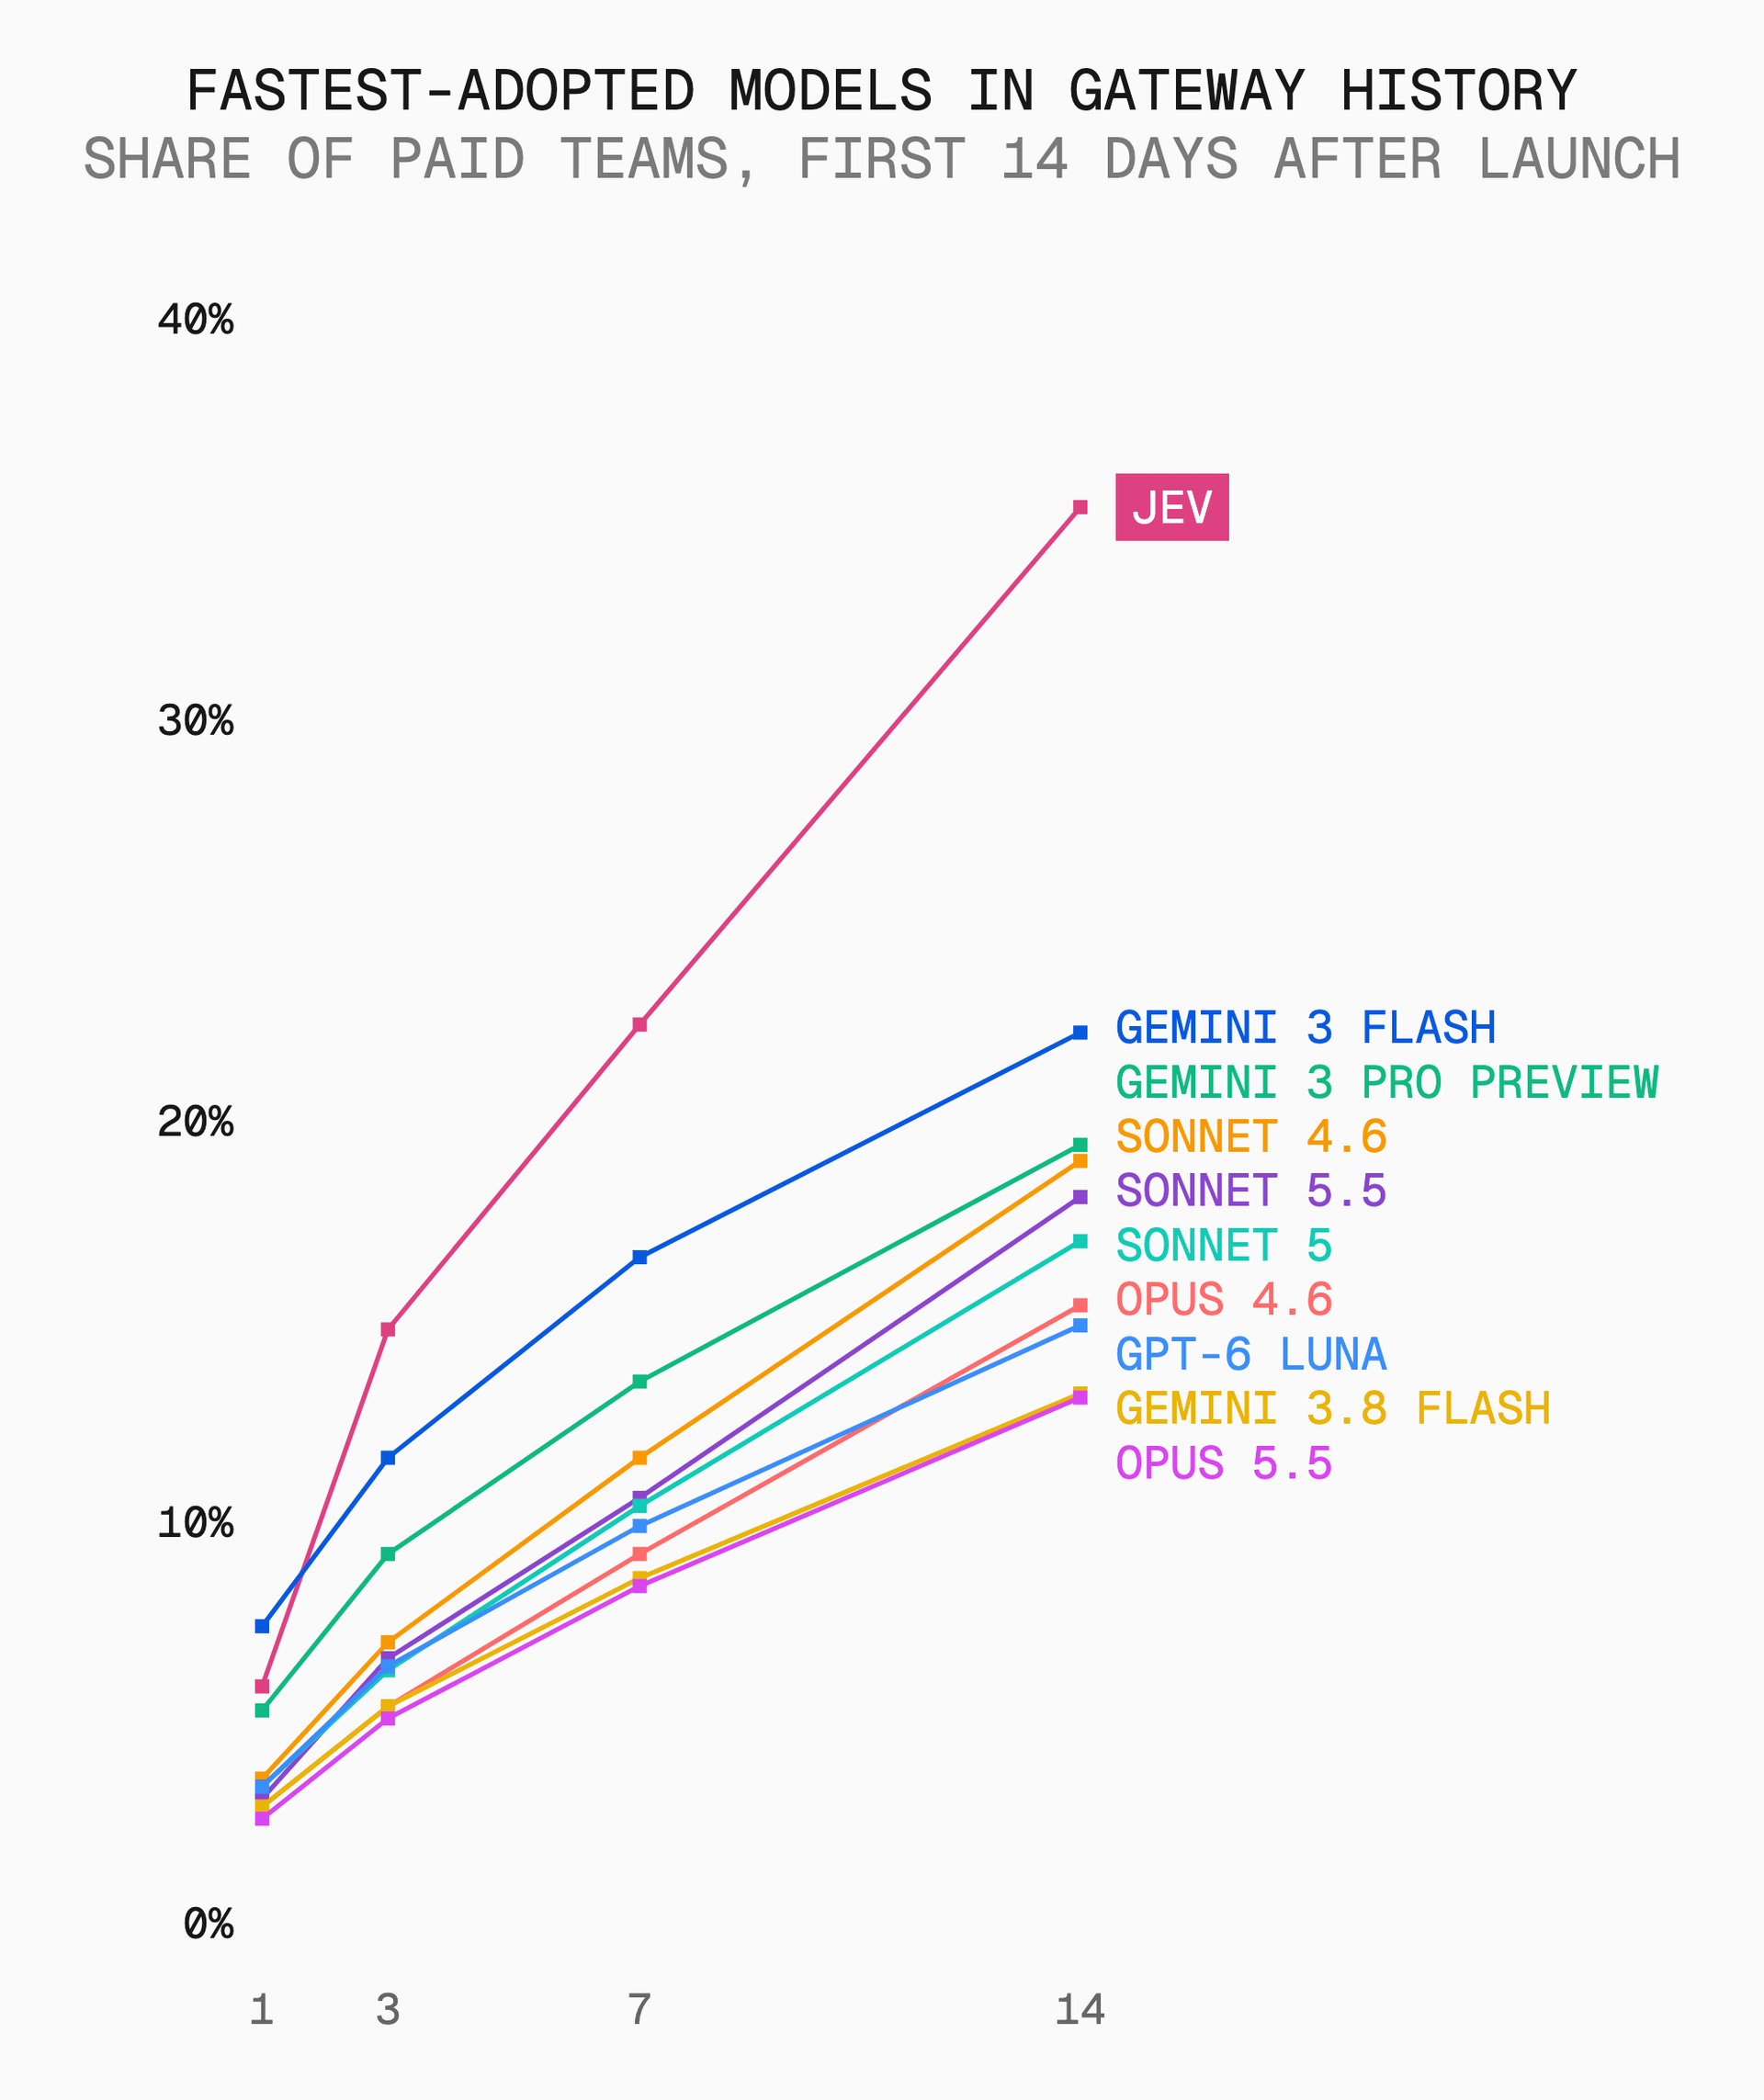
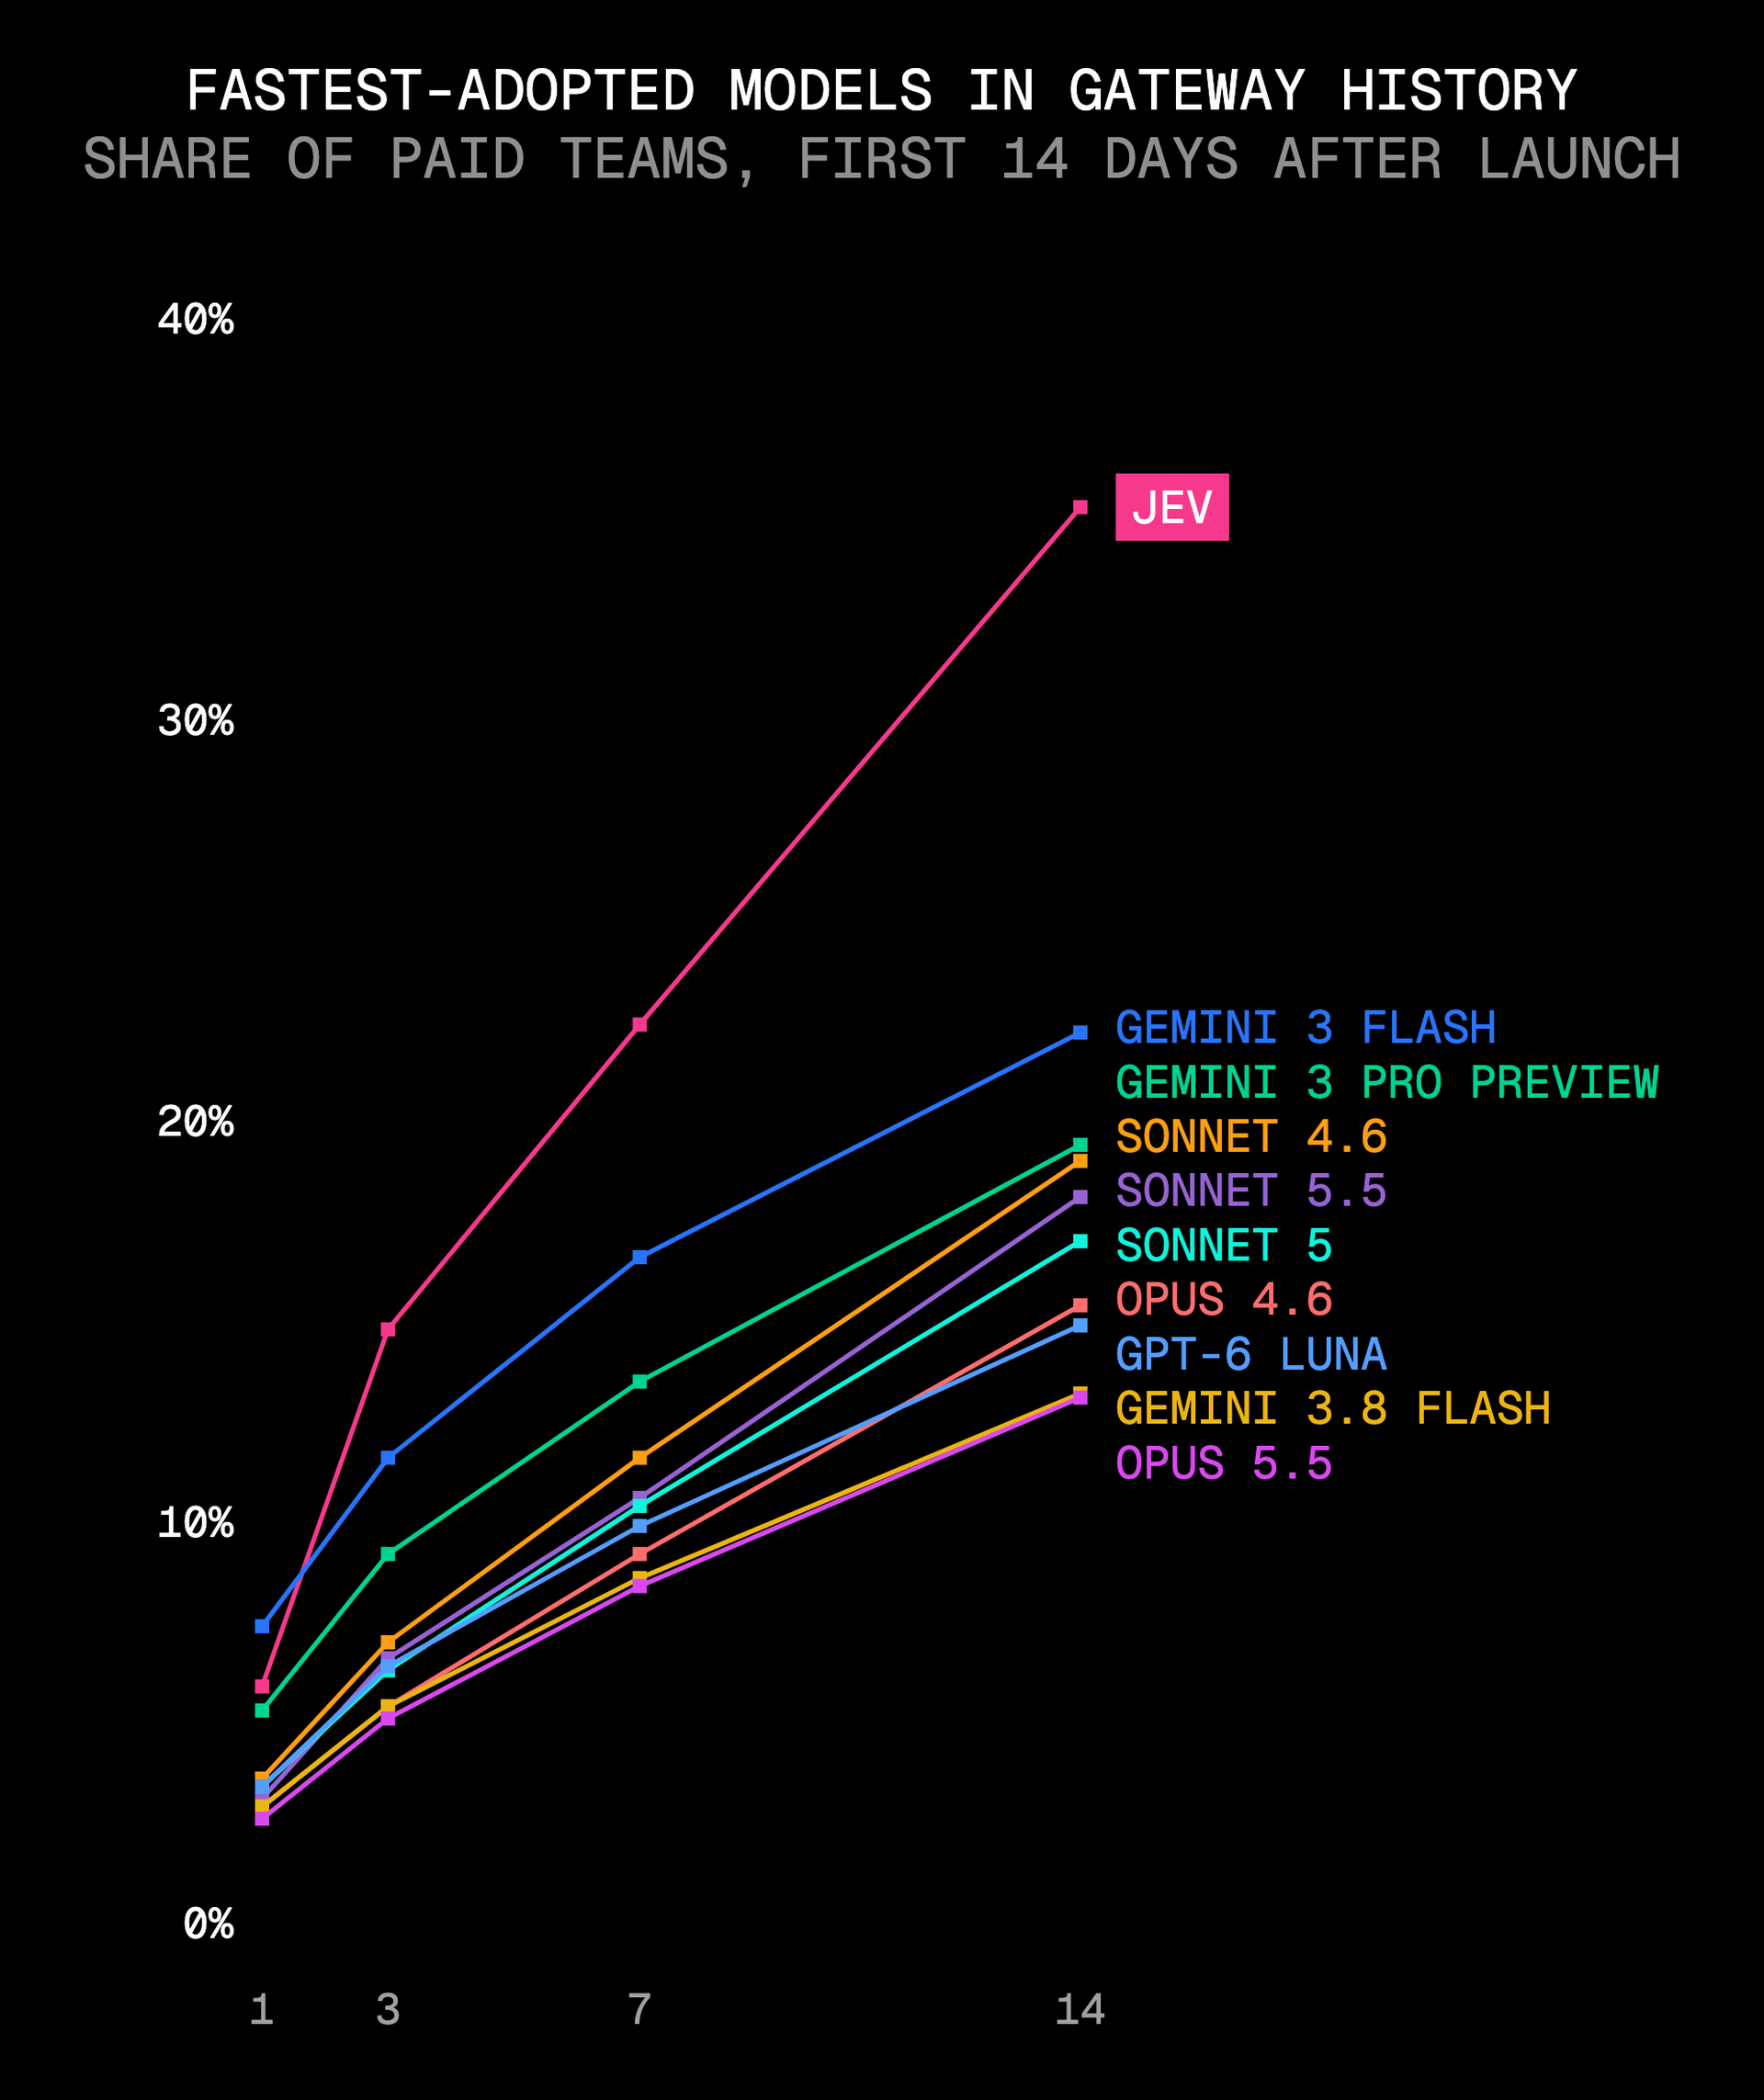
Rank | Lab | Model | Gateway launch | Reach | Reach pctl. |
|---|---|---|---|---|---|
1 | TypeSafe AI | Jev | Sep 17 | 35.3% | 99 |
2 | Anthropic | Claude Sonnet 5.5 | Sep 28 | 18.1% | 93 |
3 | OpenAI | GPT-6 Luna | Sep 22 | 14.9% | 89 |
4 | Gemini 3.8 Flash | Sep 2 | 13.2% | 87 | |
5 | Anthropic | Claude Opus 5.5 | Sep 22 | 13.1% | 86 |
6 | Z.ai | GLM-5.3-Flash | Aug 26 | 9.5% | 68 |
7 | DeepSeek | DeepSeek-V4.1-Flash | Sep 8 | 8.4% | 62 |
8 | OpenAI | GPT-6 Sol | Sep 22 | 6.9% | 51 |
9 | OpenAI | GPT-6 Astra | Sep 4 | 6.6% | 49 |
10 | Anthropic | Claude Fable 5.1 | Sep 1 | 5.8% | 38 |
Jev is a decision model: compared with typical language-model requests, each Jev request is faster, cheaper and consumes a fraction of the tokens. That profile produced 1% of September tokens, 0.15% of spend, and just 0.27% of gateway spend over its first two weeks.
Opus 5.5: the biggest money magnet
Opus 5.5 drew more than twice the spend share of any other September launch, ahead of GPT-6 Astra and DeepSeek-v4.1-Flash, with more than one in ten gateway dollars over its first two weeks. Almost nine in ten of those dollars came from teams already using Opus 5, which added spend even as the wider Opus family lost market share.
Rank | Lab | Model | Gateway launch | Spend share | Spend share pctl. |
|---|---|---|---|---|---|
1 | Anthropic | Claude Opus 5.5 | Sep 22 | 11.03% | 92 |
2 | OpenAI | GPT-6 Astra | Sep 4 | 4.86% | 89 |
3 | DeepSeek | DeepSeek V4.1 Flash | Sep 8 | 4.19% | 84 |
4 | Anthropic | Claude Sonnet 5.5 | Sep 28 | 3.21% | 80 |
5 | OpenAI | GPT-6 Sol | Sep 22 | 2.25% | 72 |
6 | Gemini 3.8 Flash | Sep 2 | 2.21% | 71 | |
7 | xAI | Grok 4.7 | Sep 21 | 2.00% | 68 |
8 | Anthropic | Claude Fable 5.1 | Sep 1 | 1.94% | 66 |
9 | OpenAI | GPT-6 Luna | Sep 22 | 0.88% | 51 |
10 | Z.ai | GLM-5.3-Flash | Aug 26 | 0.60% | 47 |
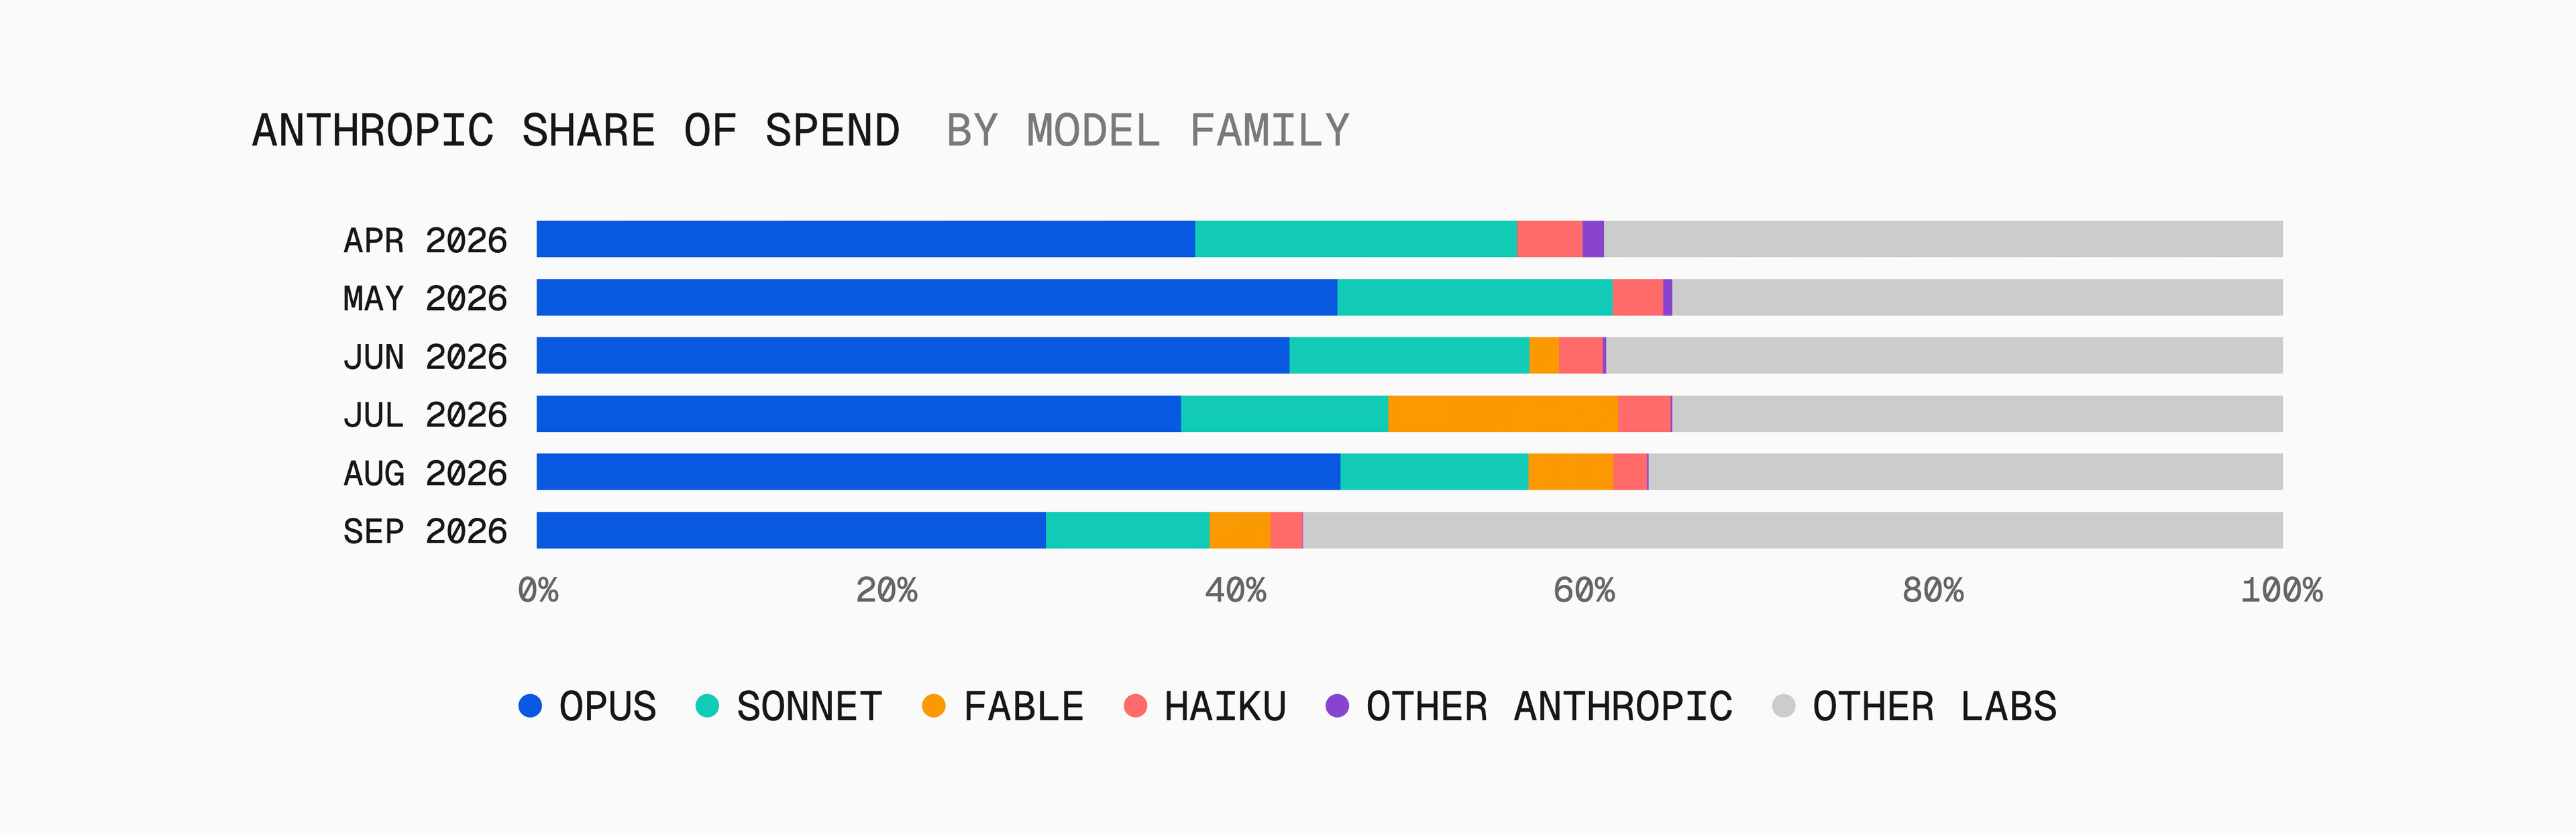
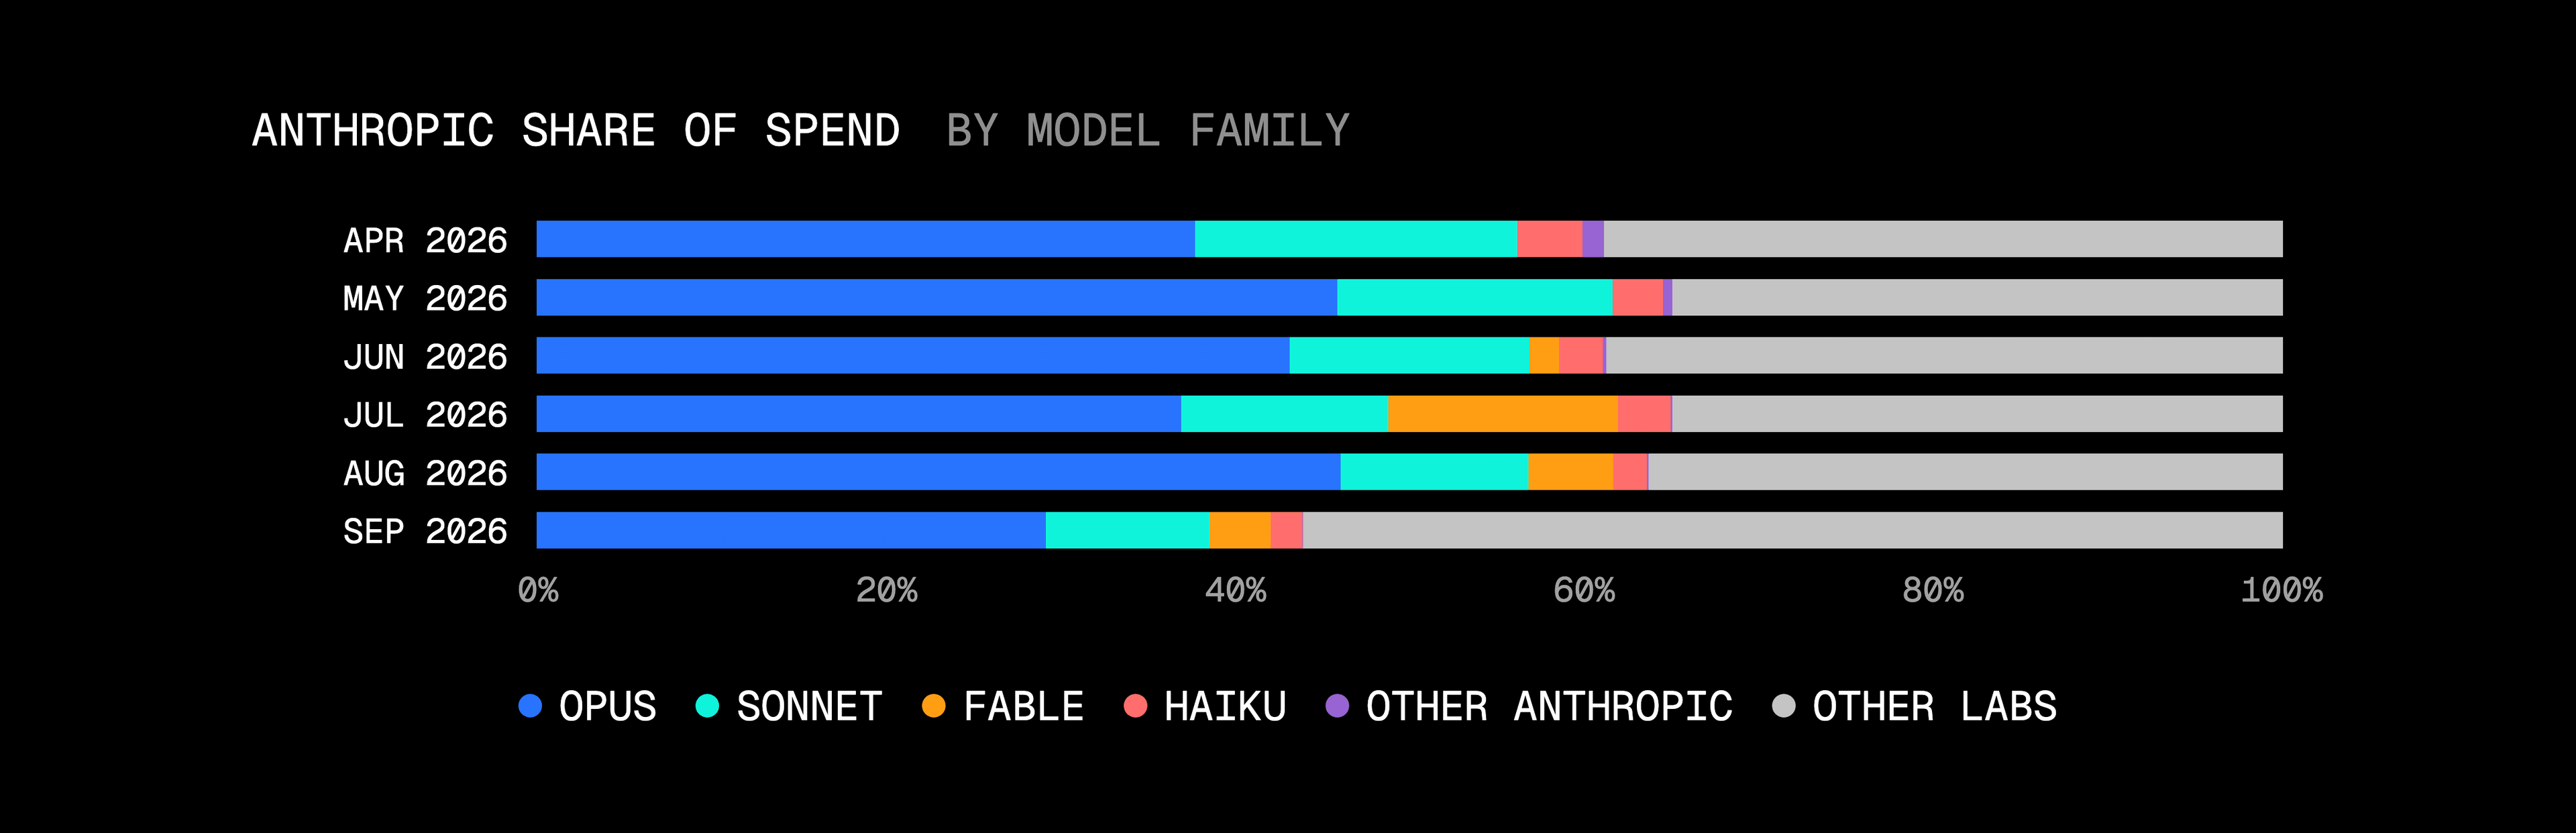
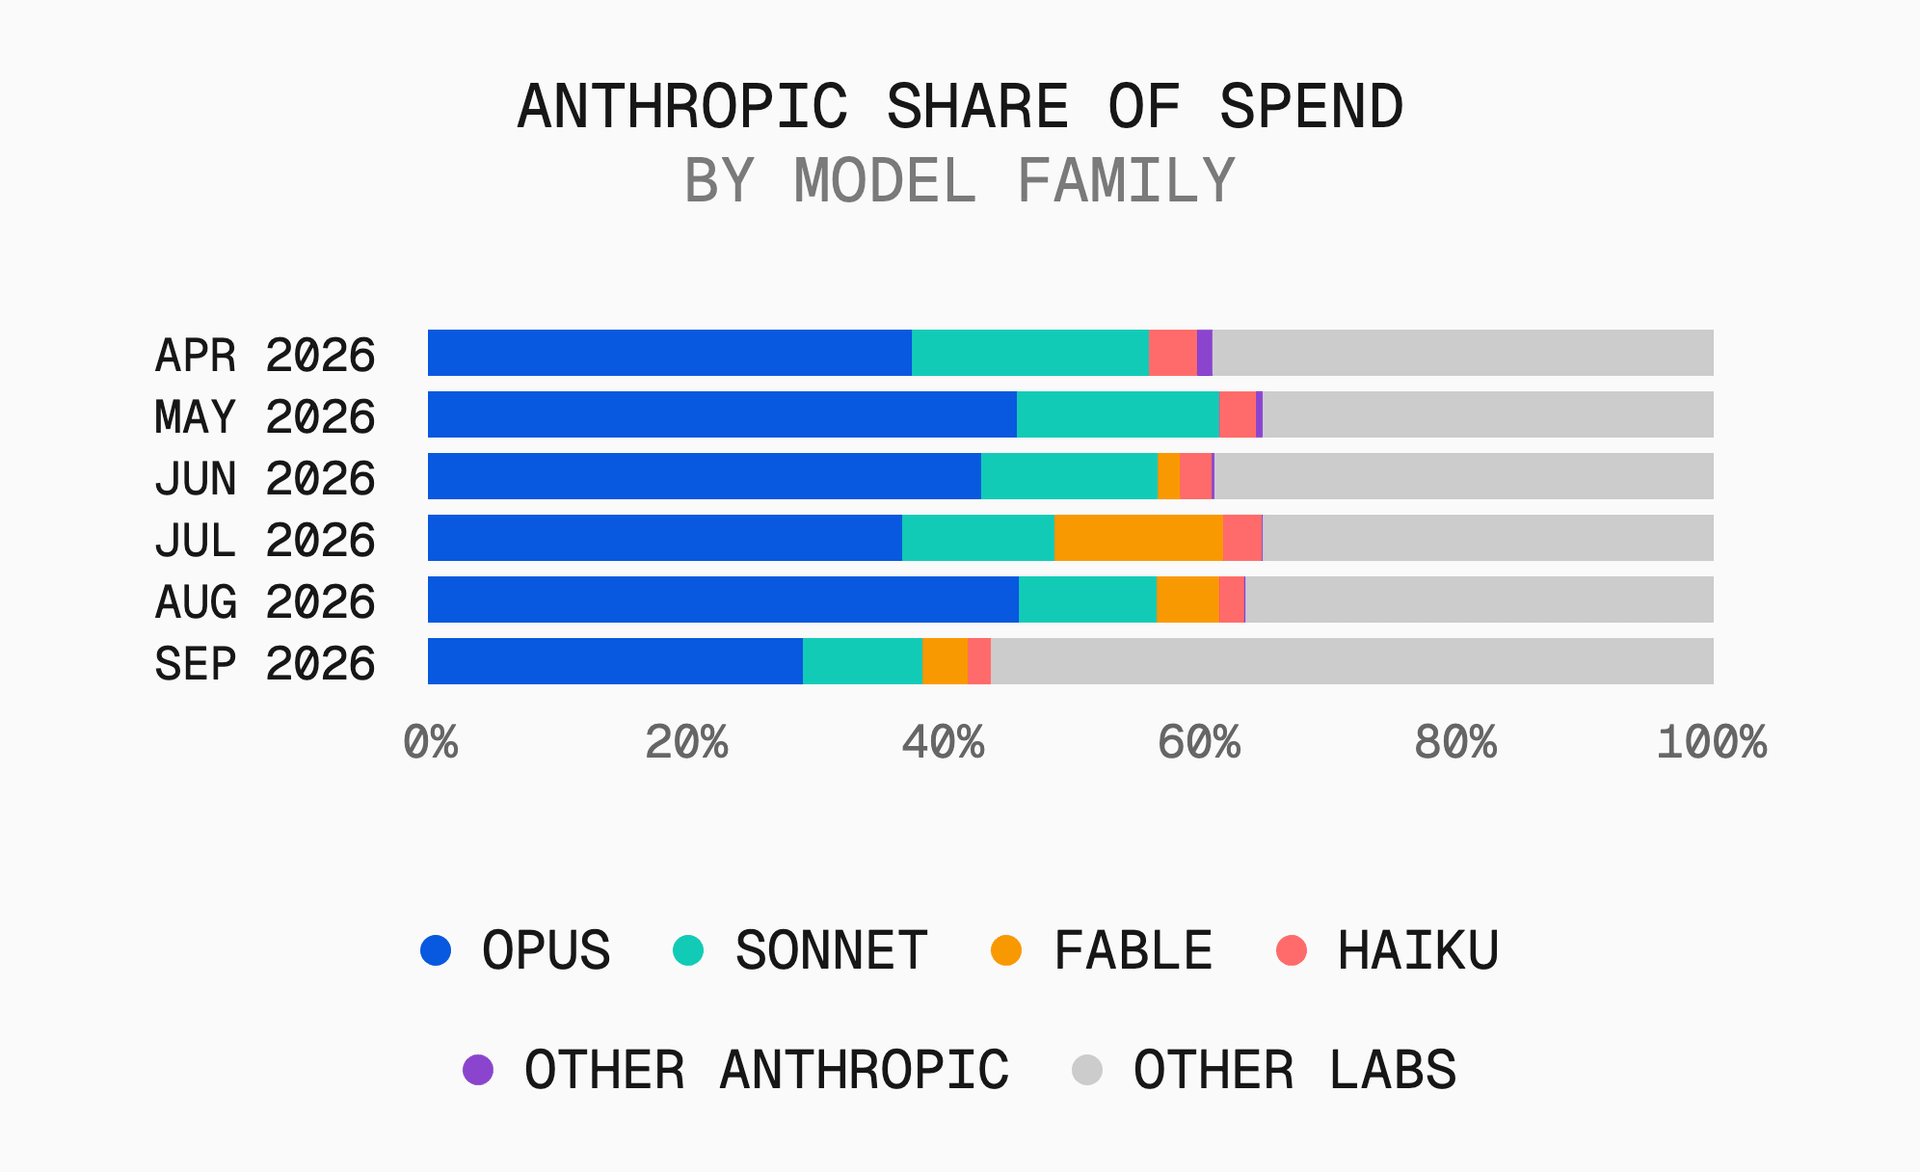
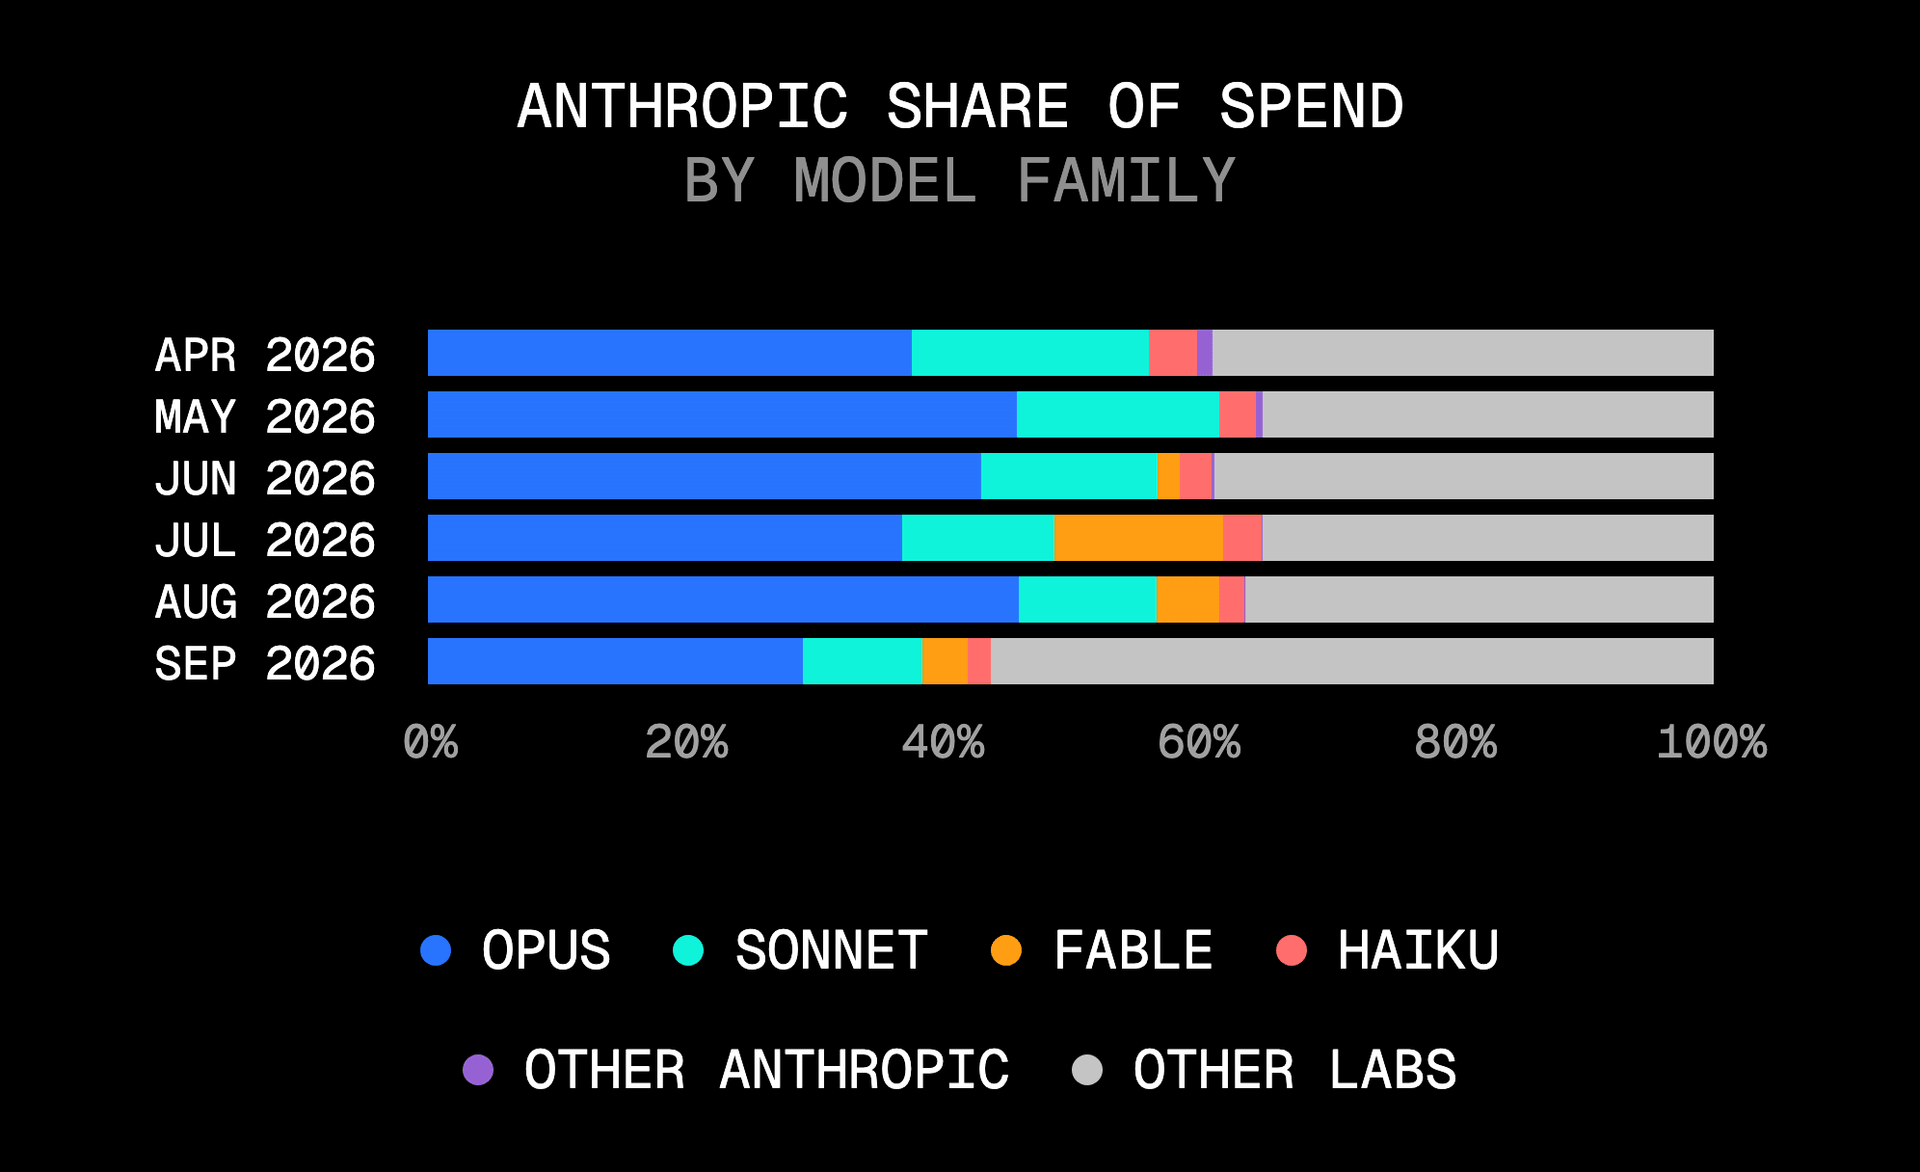
Opus across all versions fell from one in two gateway dollars in August to almost a third in September. Anthropic's overall share dropped from 63.7% to 43.9% — below half of total gateway spend for the first time, with Opus accounting for 17 of the nearly 20 points lost.
Luna's reach against Astra's budget
GPT-6 Luna reached almost three in twenty paid teams in its first two weeks, third behind Jev and Sonnet 5.5, and posted the month's highest return rate: almost two-thirds of first-week teams came back in week two. GPT-6 Astra reached fewer teams but took about one in twenty gateway dollars, against less than one in a hundred for Luna — roughly three times the reach for Luna, more than five times the spend share for Astra.
Rank | Lab | Model | Gateway launch | Retention | Retention pctl. |
|---|---|---|---|---|---|
1 | OpenAI | GPT-6 Luna | Sep 22 | 64.8% | 98 |
2 | Anthropic | Claude Sonnet 5.5 | Sep 28 | 60.5% | 90 |
3 | DeepSeek | DeepSeek-V4.1-Flash | Sep 8 | 60.3% | 89 |
4 | Gemini 3.8 Flash | Sep 2 | 60.0% | 86 | |
5 | TypeSafe AI | Jev | Sep 17 | 55.6% | 65 |
6 | Anthropic | Claude Opus 5.5 | Sep 22 | 54.9% | 62 |
7 | Z.ai | GLM-5.3-Flash | Aug 26 | 51.0% | 51 |
8 | OpenAI | GPT-6 Sol | Sep 22 | 46.1% | 50 |
9 | OpenAI | GPT-6 Astra | Sep 4 | 45.8% | 49 |
10 | Meta | Muse Spark 1.3 Contributor | Sep 2 | 45.0% | 46 |
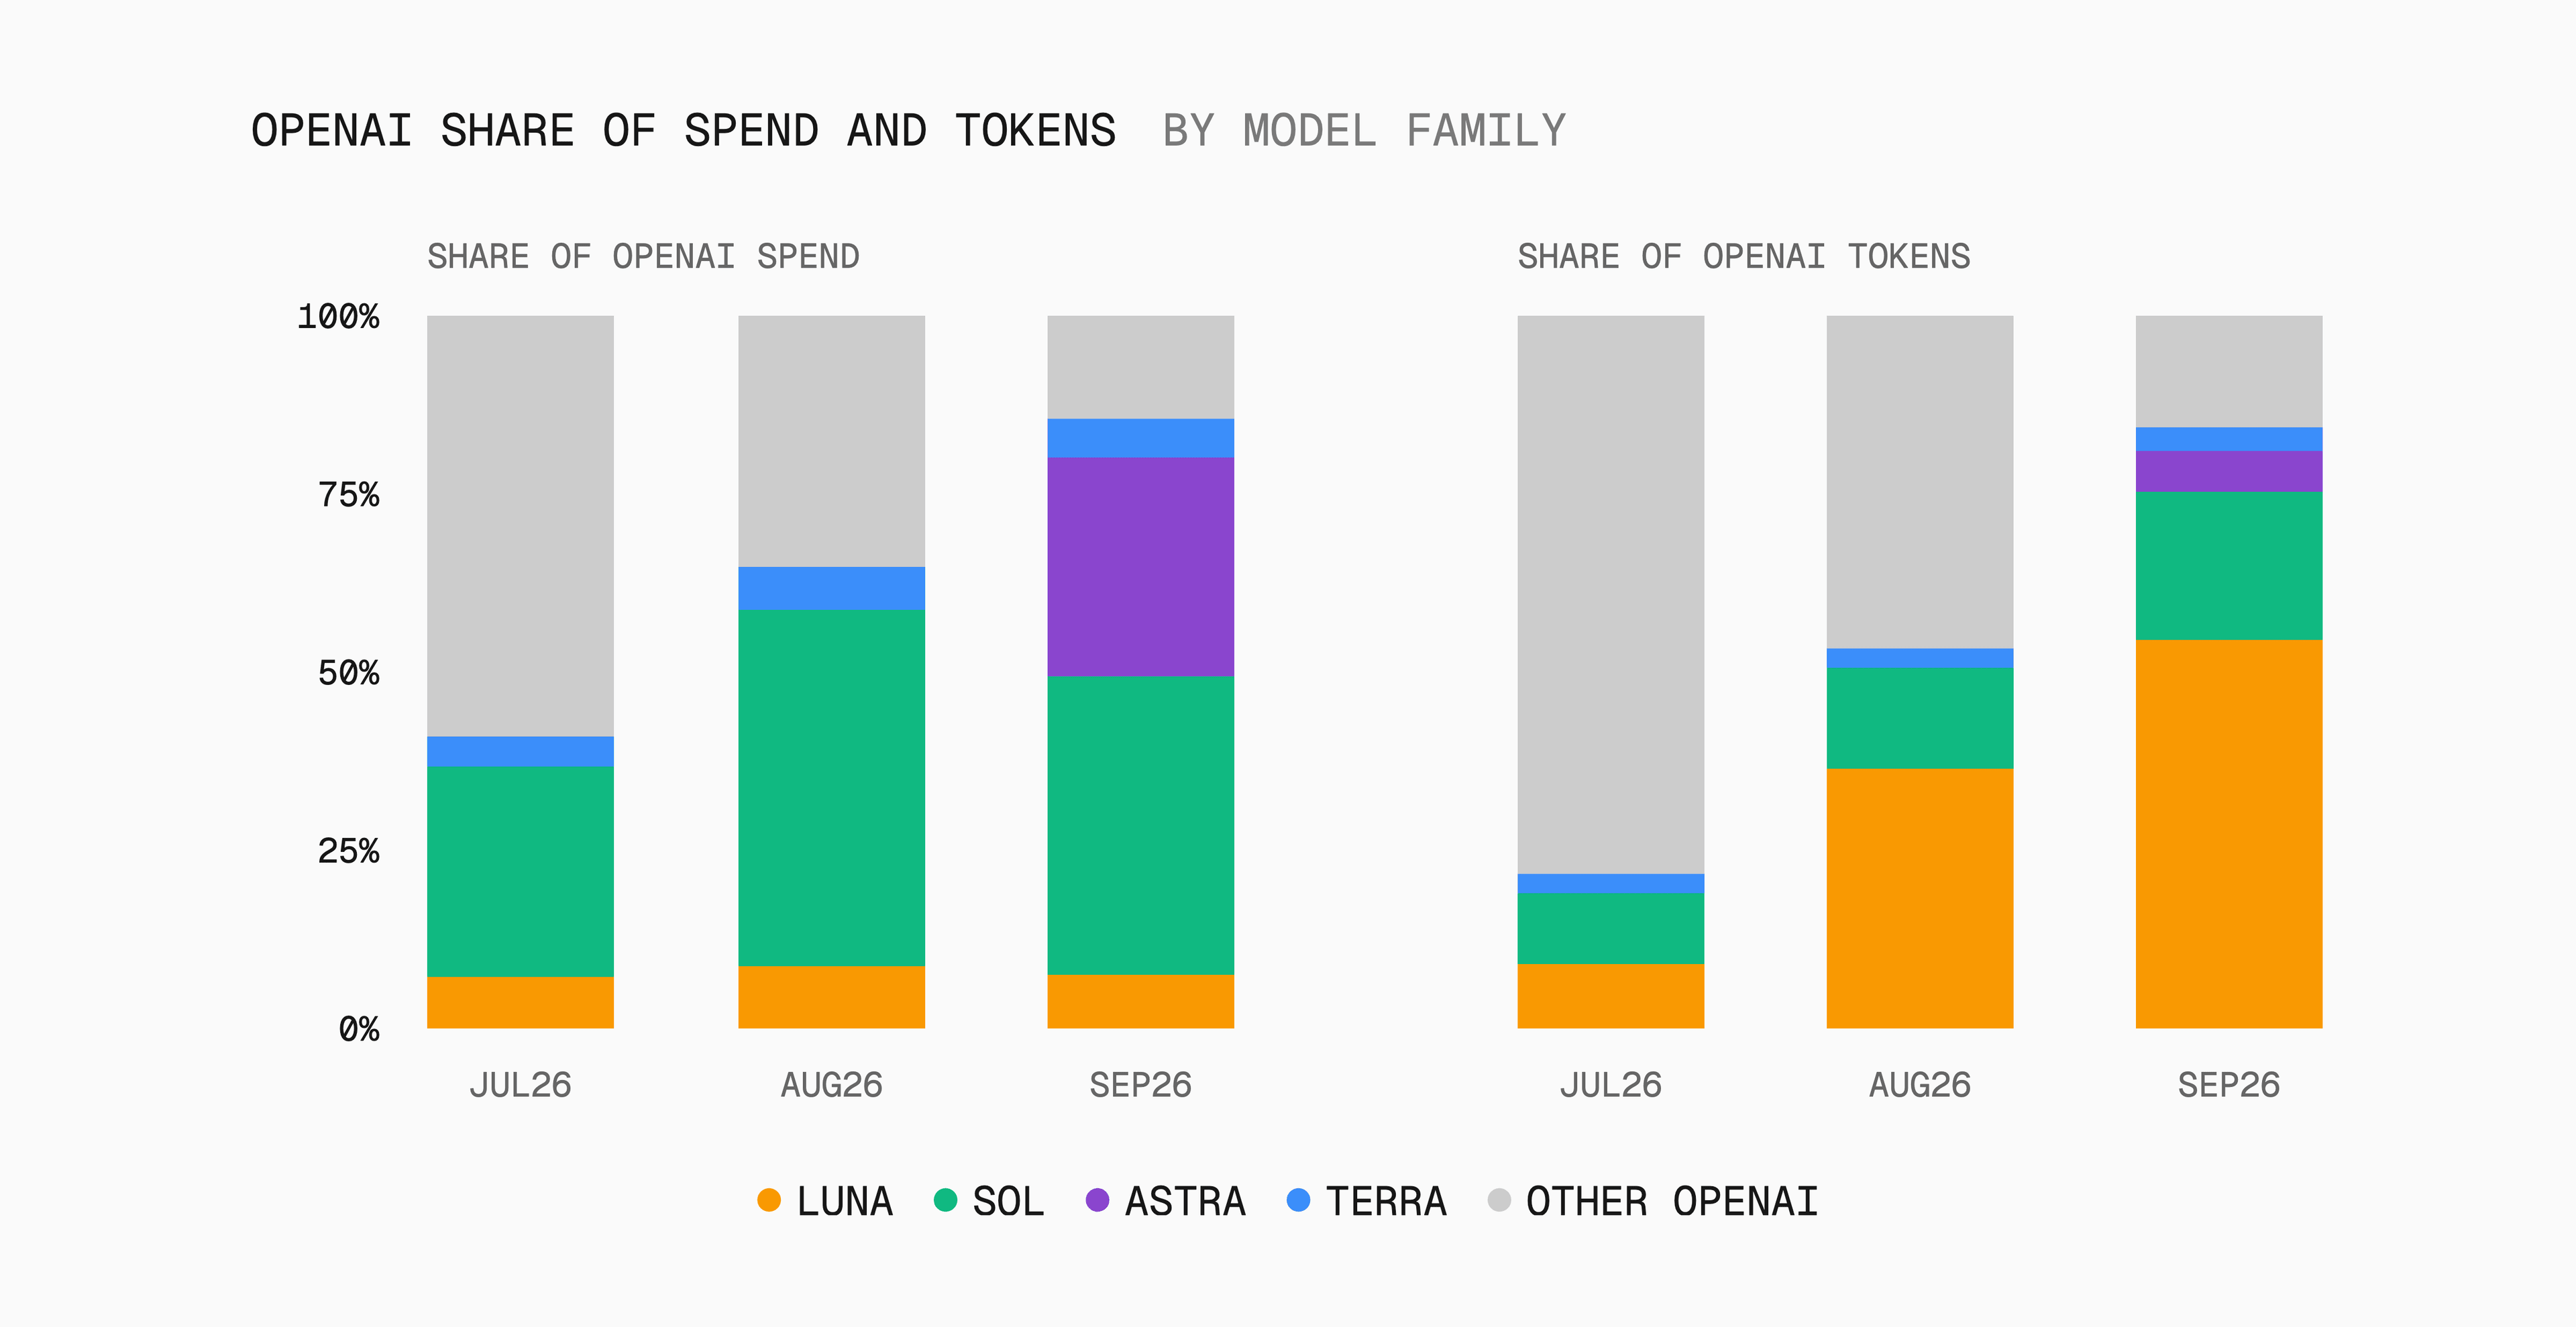
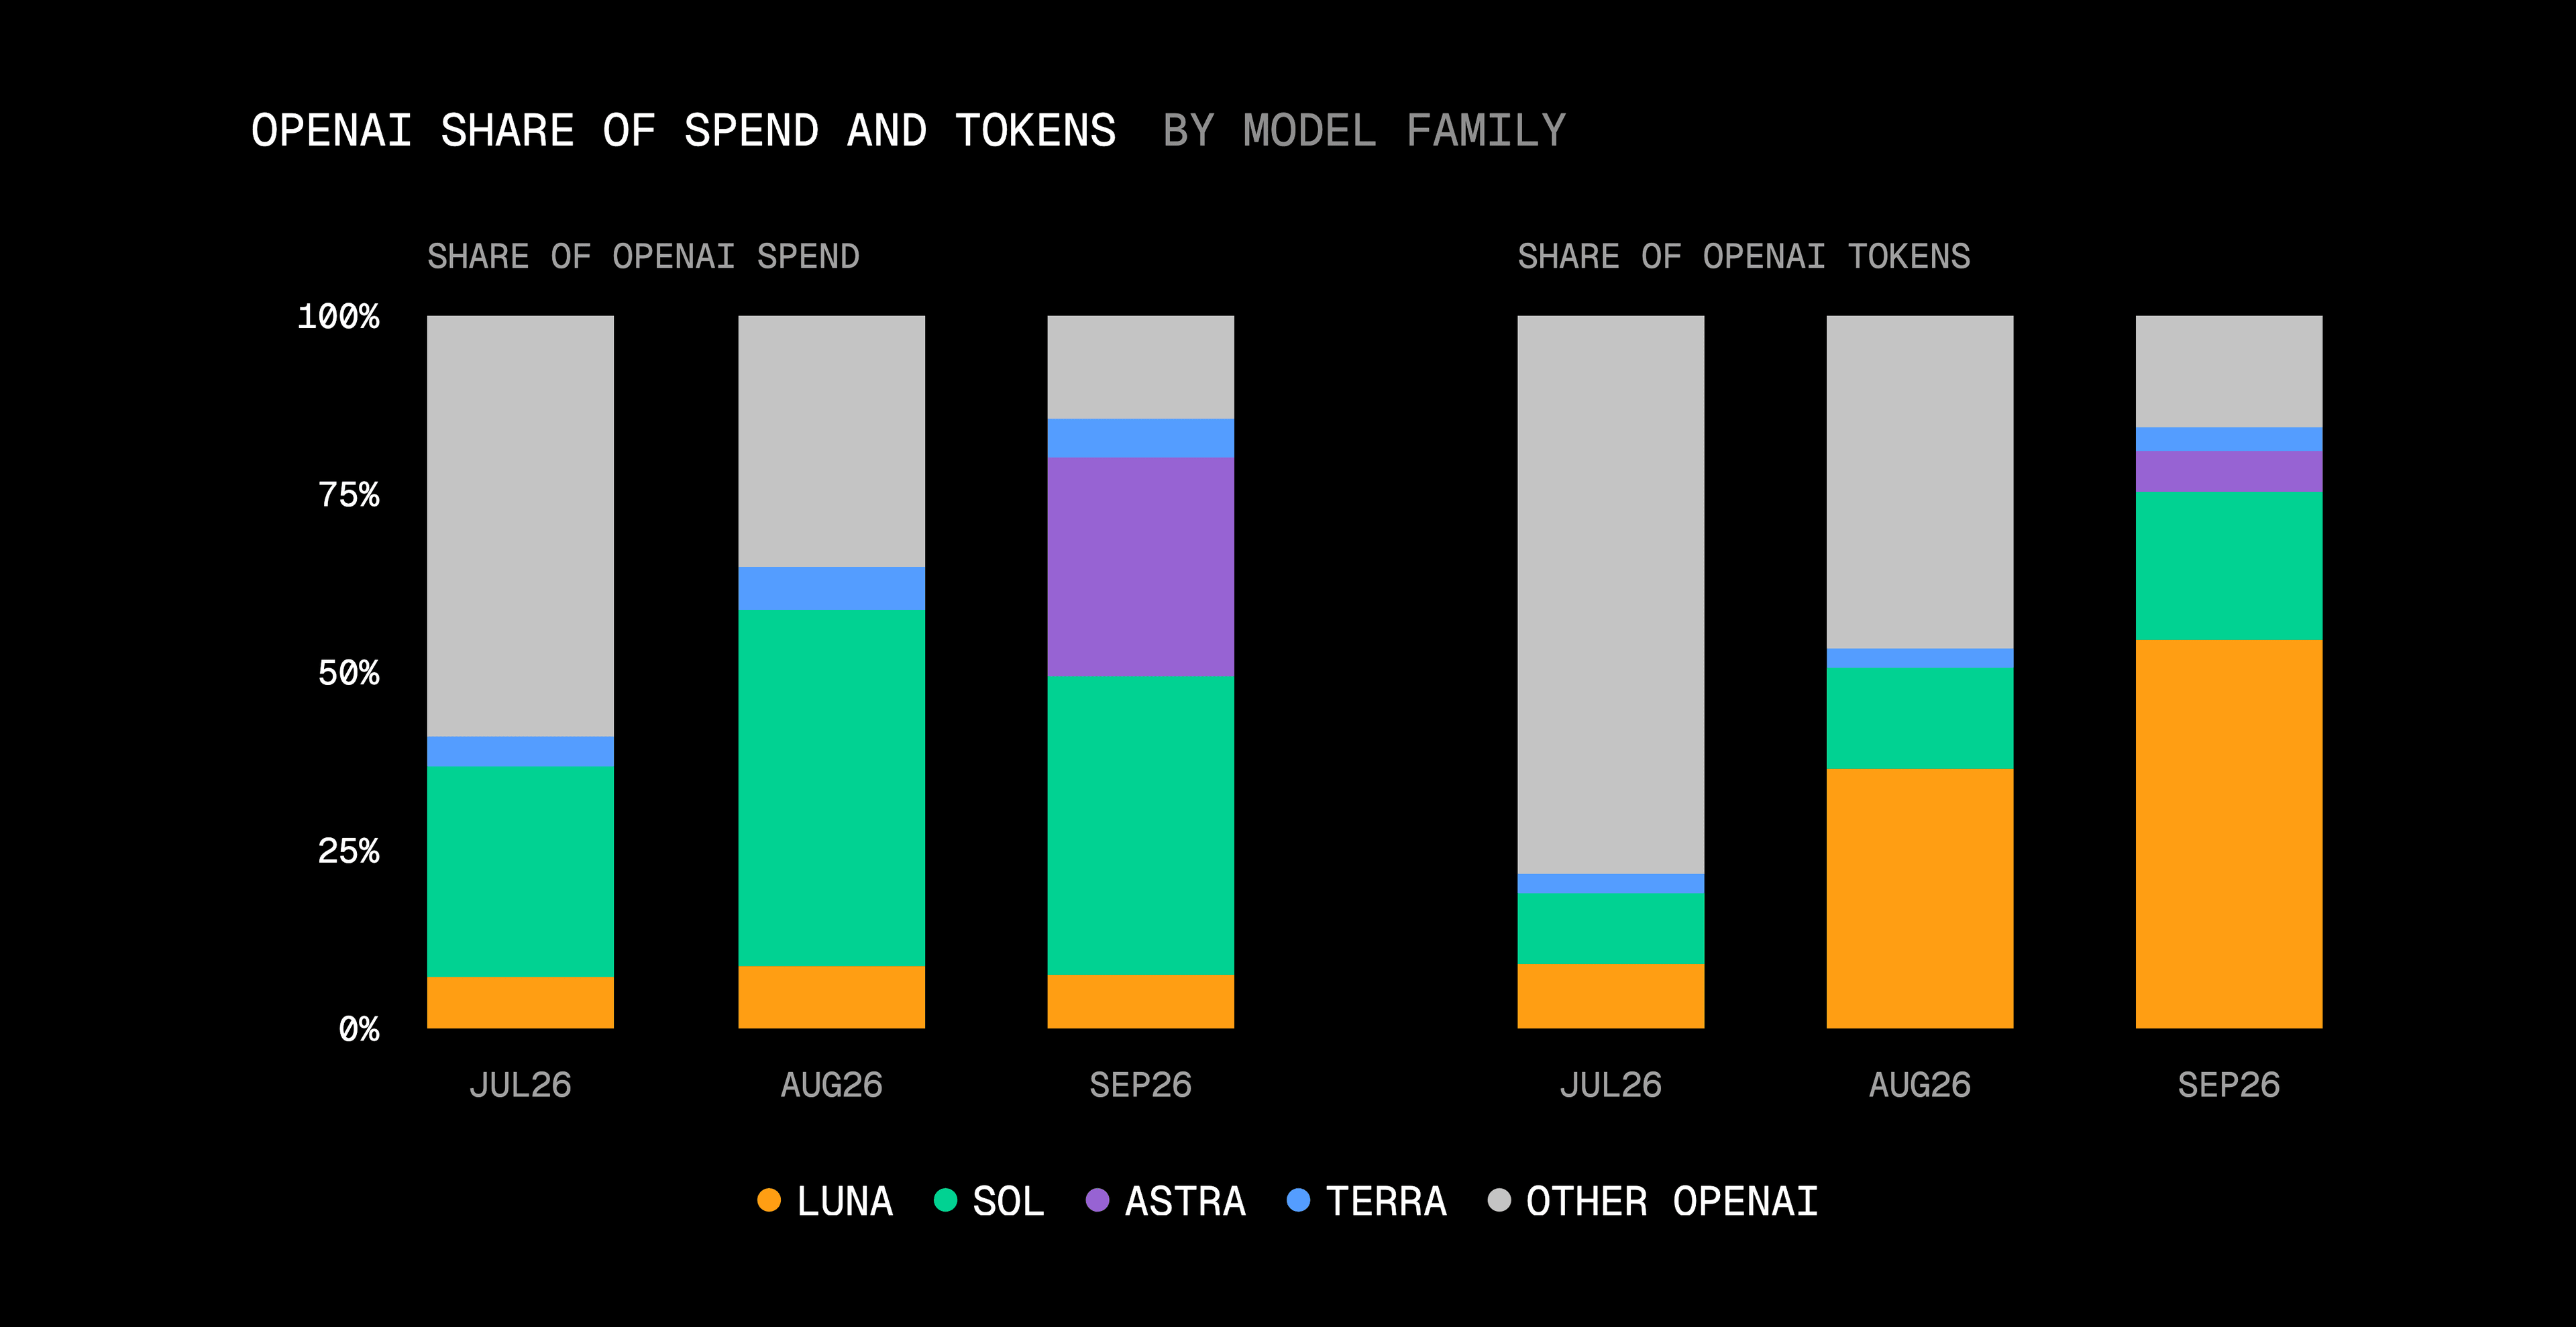
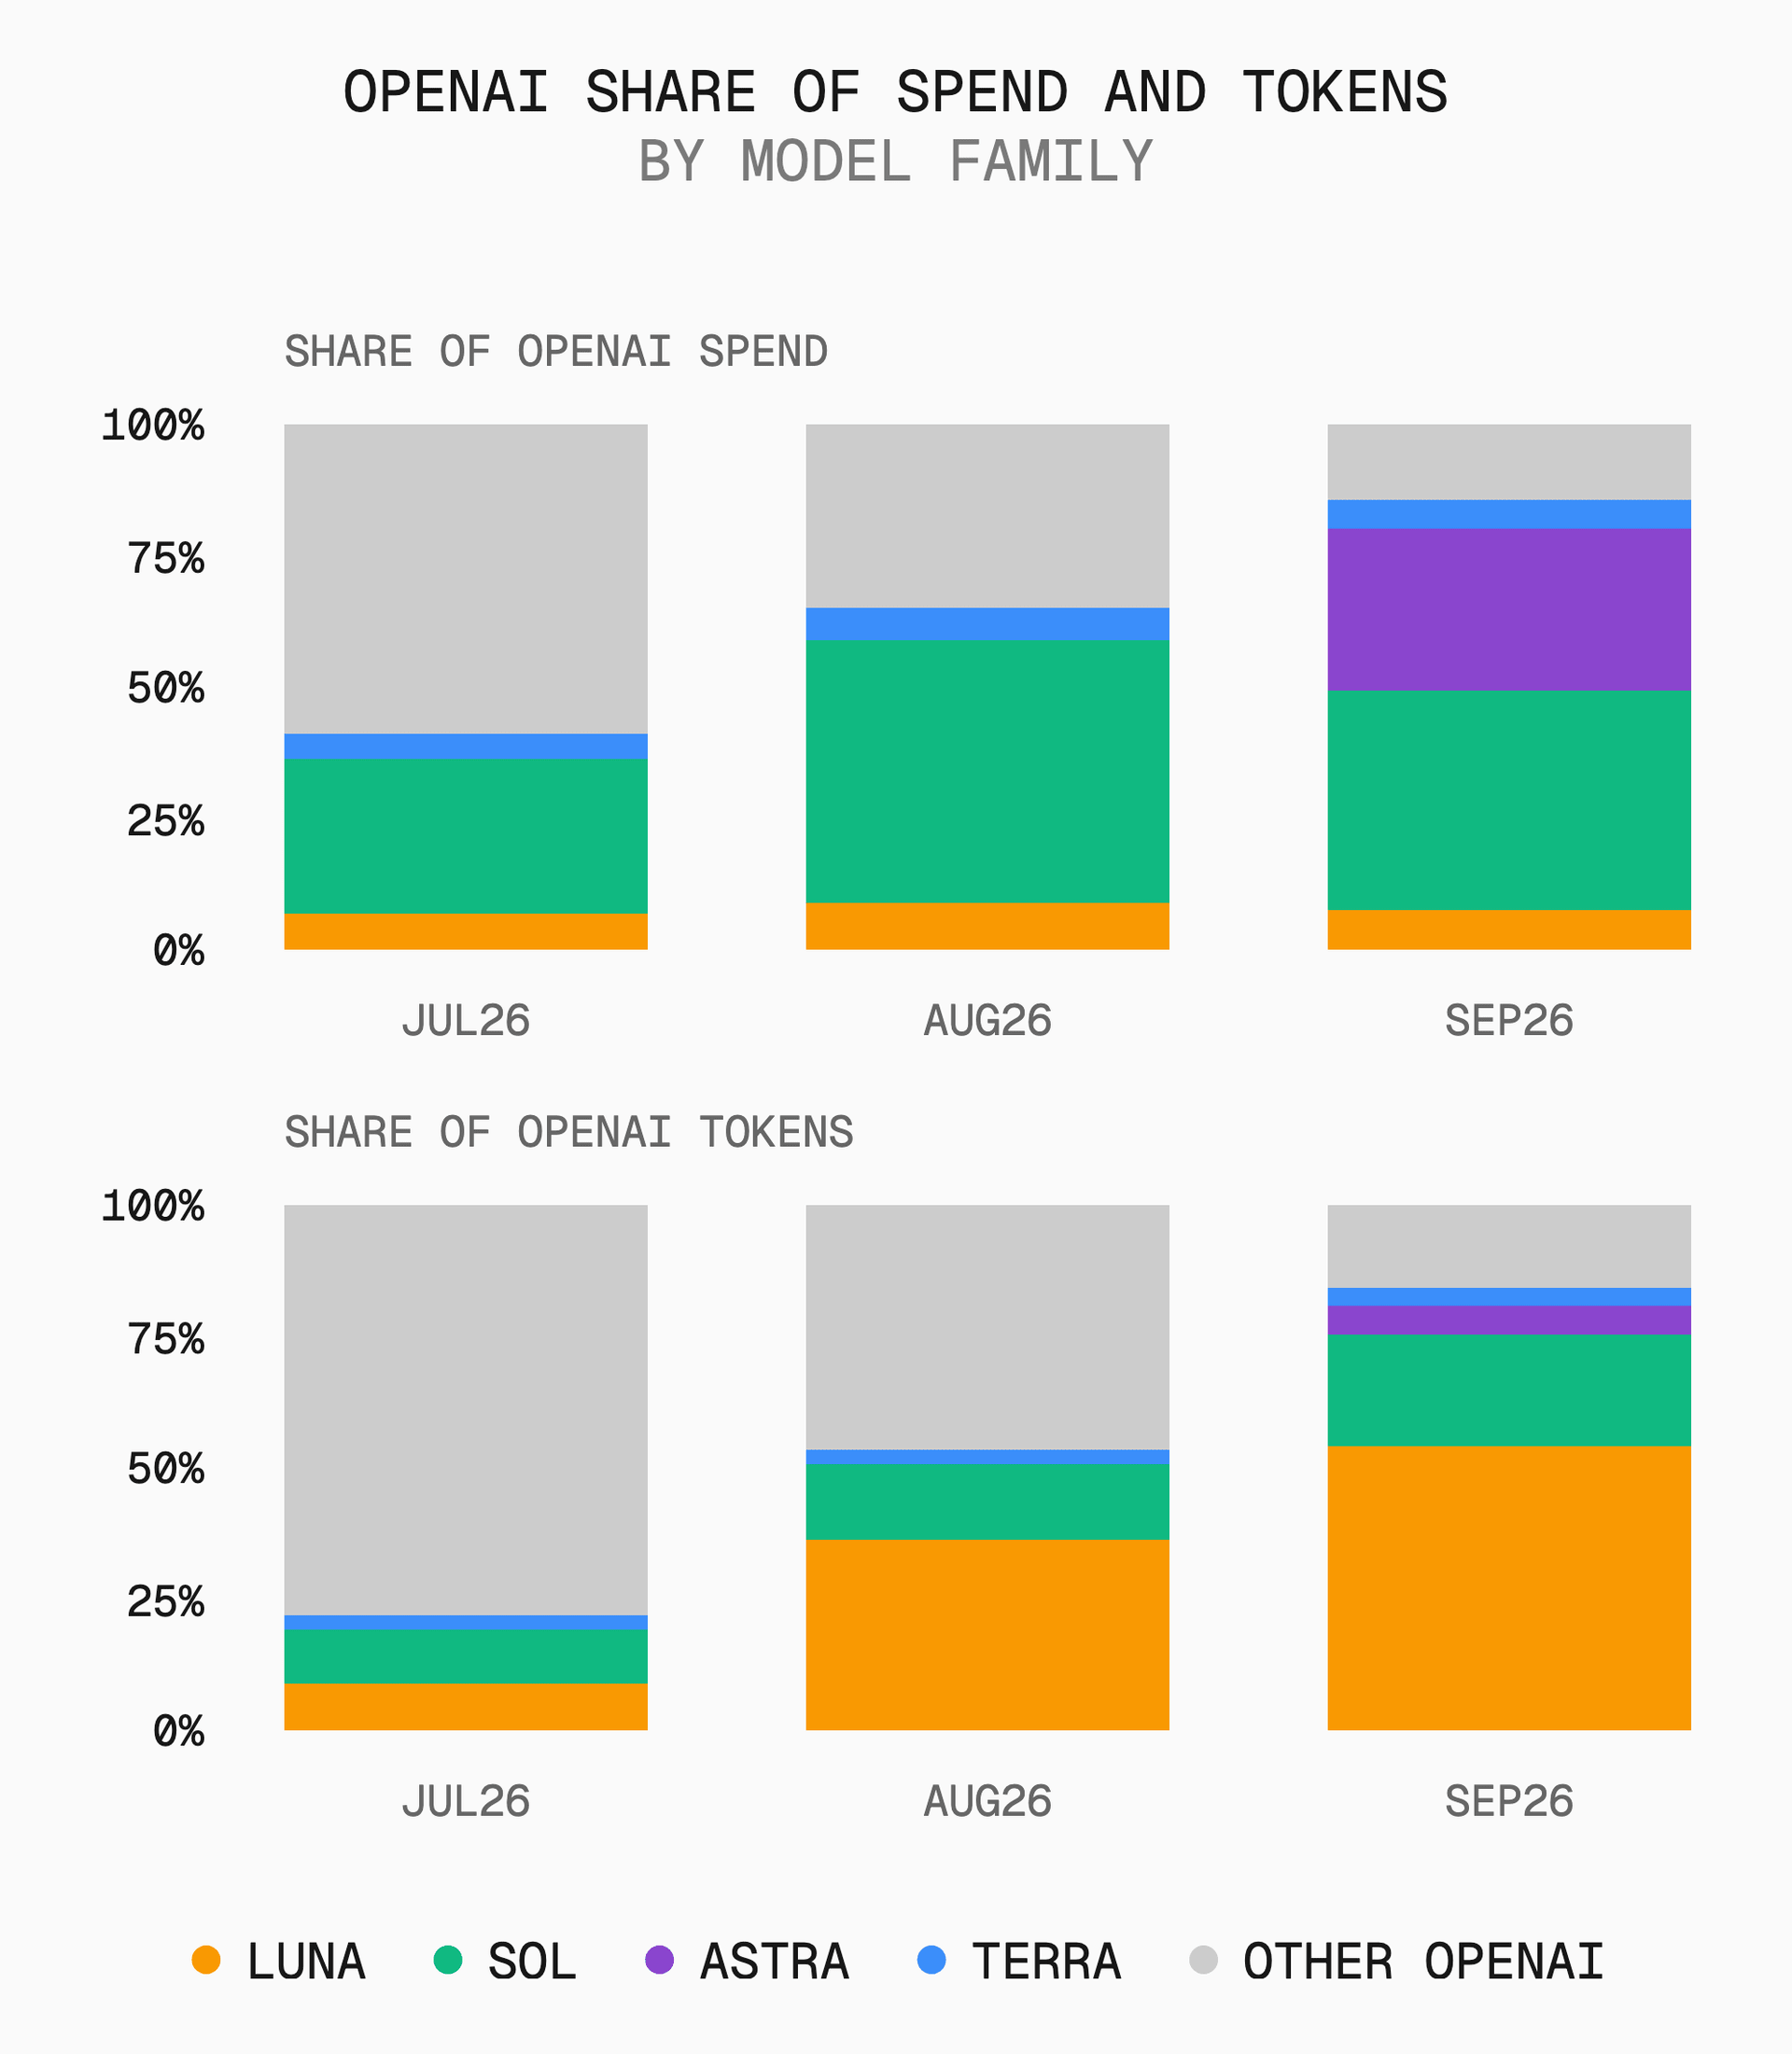
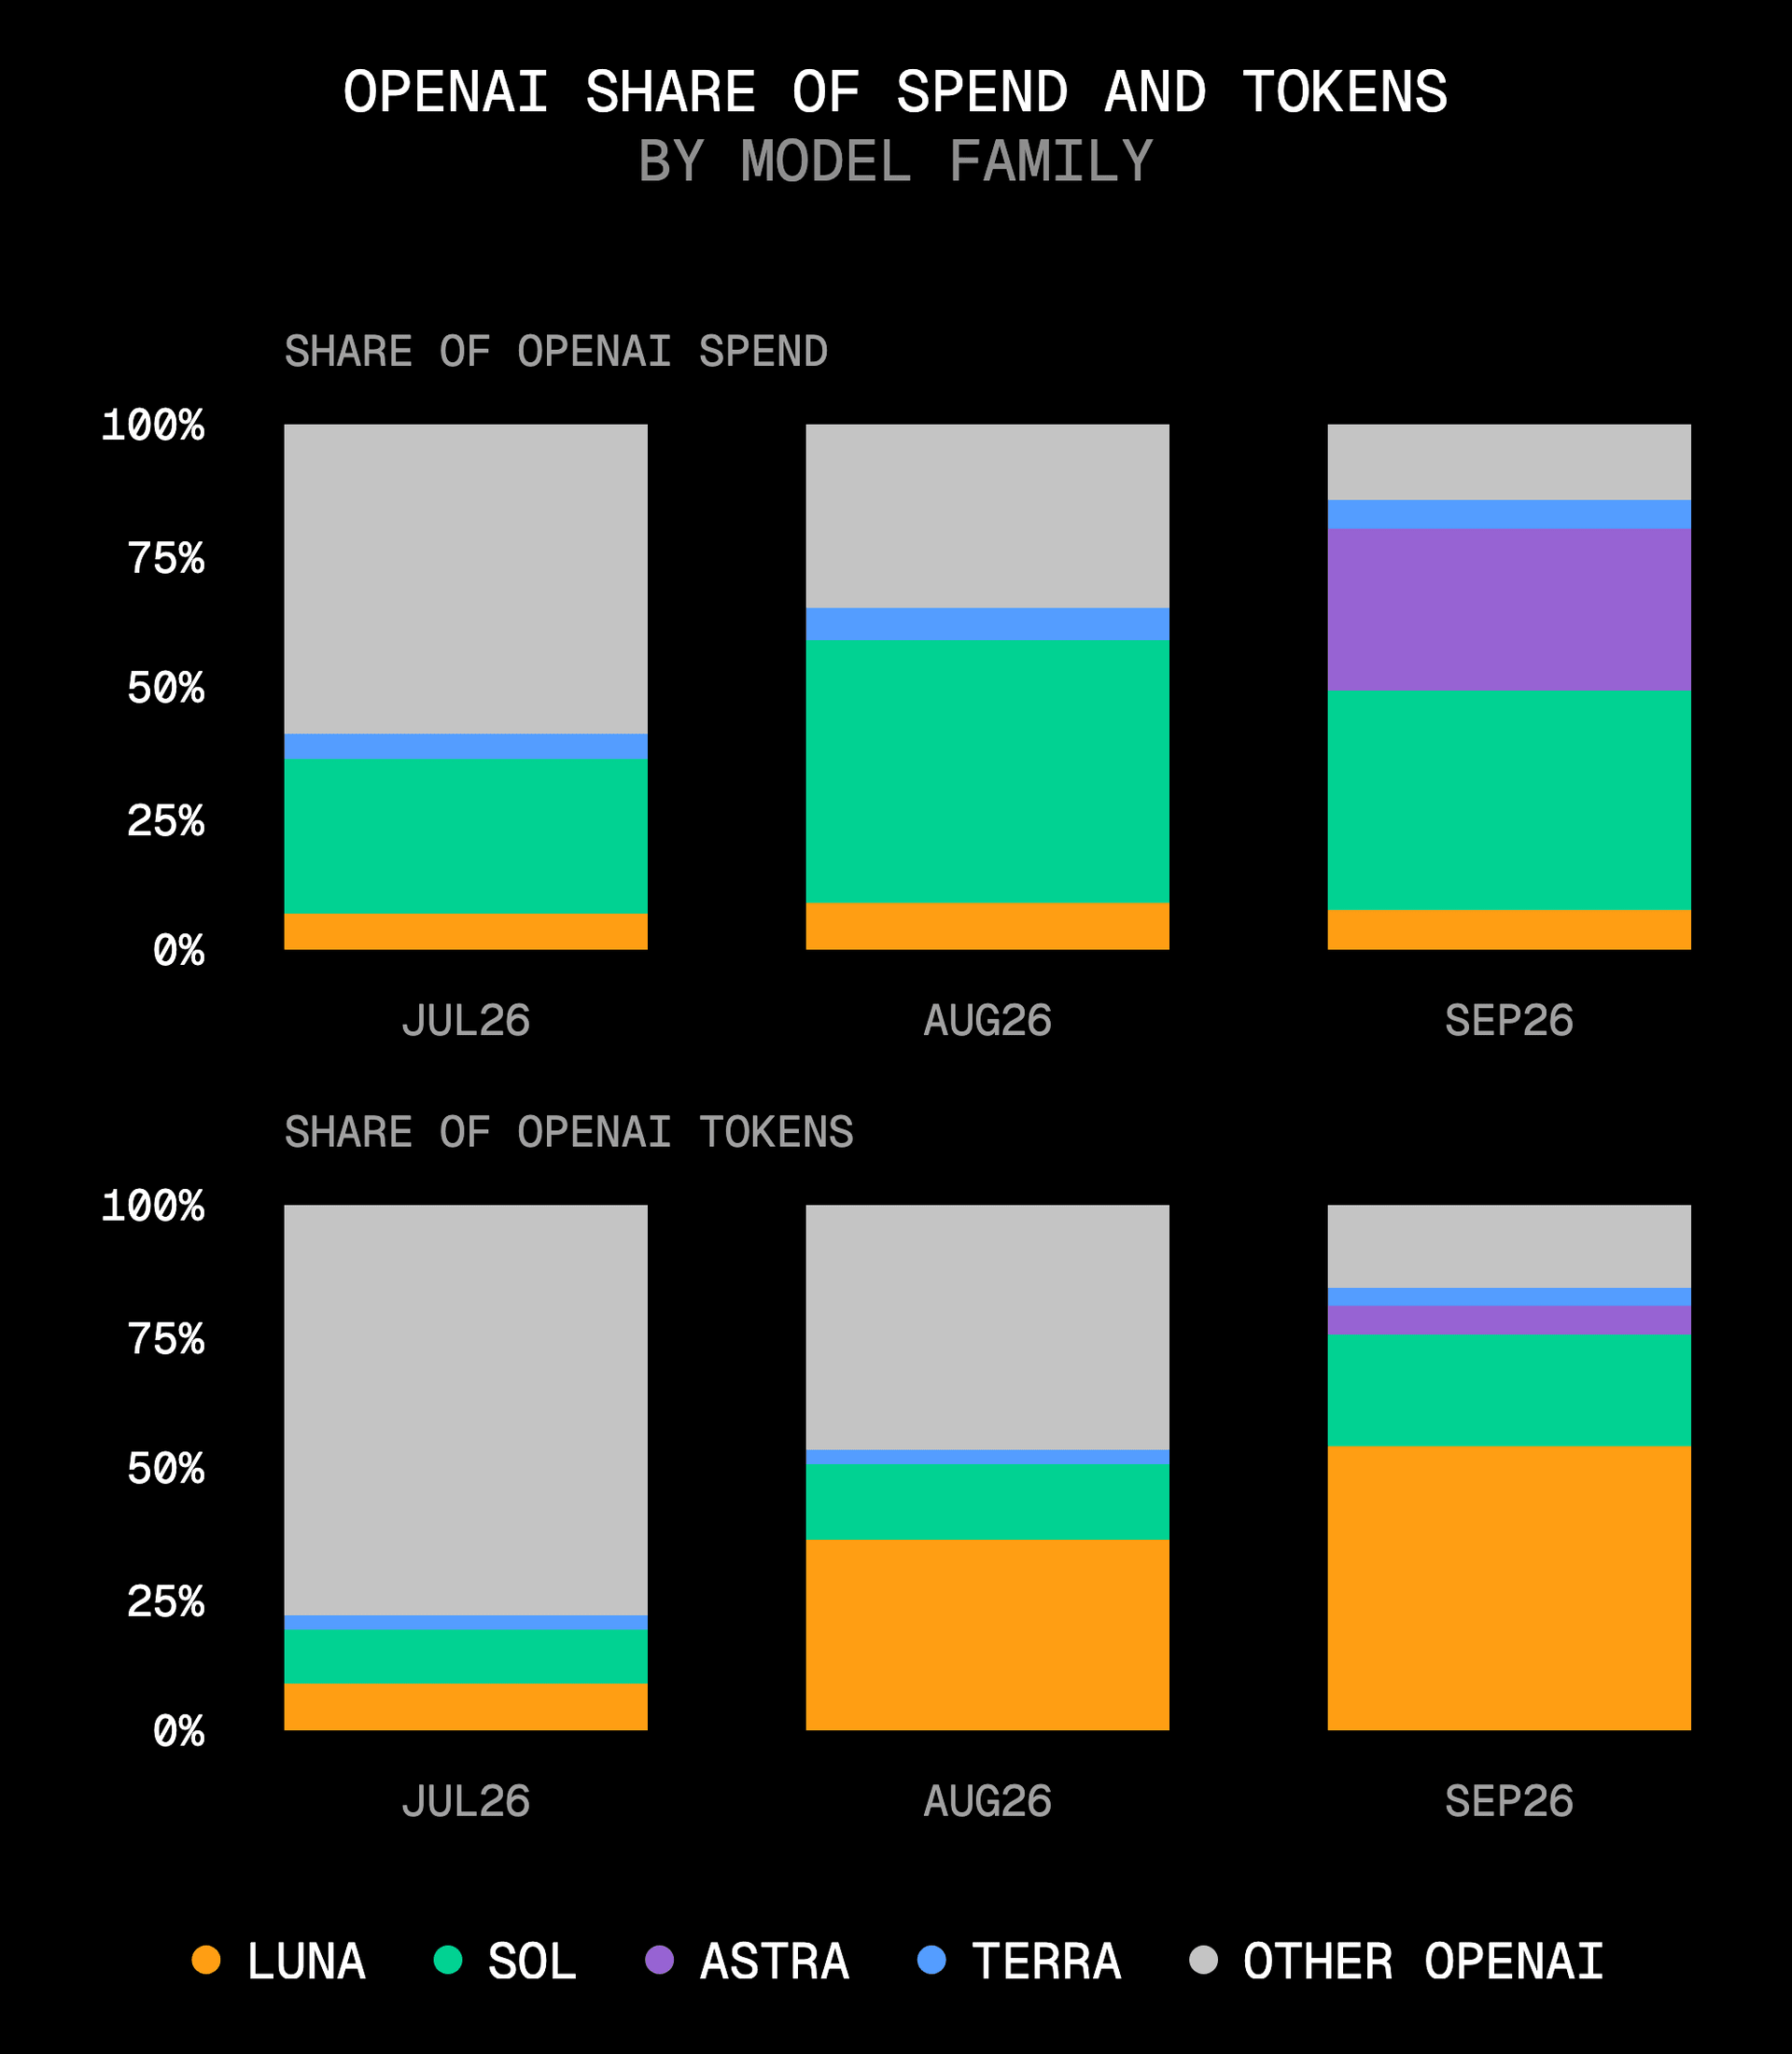
Across OpenAI's line, Luna processed more than half of its gateway tokens in September, while Sol and Astra together accounted for nearly three-quarters of the spending.
Rank | Lab | Model | Gateway launch | Reach | Reach pctl. | Spend share | Spend pctl. | Retention | Retention pctl. | Score |
|---|---|---|---|---|---|---|---|---|---|---|
1 | Anthropic | Claude Sonnet 5.5 | Sep 28 | 18.1% | 93 | 3.2% | 80 | 60.5% | 90 | 87.8 |
2 | Gemini 3.8 Flash | Sep 2 | 13.2% | 87 | 2.2% | 71 | 60.0% | 86 | 81.3 | |
3 | Anthropic | Claude Opus 5.5 | Sep 22 | 13.1% | 86 | 11.0% | 92 | 54.9% | 62 | 79.9 |
4 | OpenAI | GPT-6 Luna | Sep 22 | 14.9% | 89 | 0.9% | 51 | 64.8% | 98 | 79.4 |
5 | DeepSeek | DeepSeek-V4.1-Flash | Sep 8 | 8.4% | 62 | 4.2% | 84 | 60.3% | 89 | 78.4 |
6 | TypeSafe AI | Jev | Sep 17 | 35.3% | 99 | 0.3% | 34 | 55.6% | 65 | 65.9 |
7 | OpenAI | GPT-6 Astra | Sep 4 | 6.6% | 49 | 4.9% | 89 | 45.8% | 49 | 61.9 |
8 | OpenAI | GPT-6 Sol | Sep 22 | 6.9% | 51 | 2.3% | 72 | 46.1 | 50 | 58.0 |
9 | Z.ai | GLM-5.3-Flash | Sep 26 | 9.5% | 68 | 0.6% | 47 | 51.0% | 51 | 55.5 |
10 | Anthropic | Claude Fable 5.1 | Sep 1 | 5.8% | 38 | 1.9% | 66 | 43.4% | 40 | 48.0 |
11 | xAI | Grok 4.7 | Sep 21 | 3.6% | 31 | 2.0% | 68 | 36.2% | 25 | 41.0 |
12 | Meta | Muse Spark 1.3 Contributor | Sep 2 | 2.1% | 17 | 0.1% | 26 | 45.0% | 46 | 29.6 |
13 | Meta | Muse Spark 1.3 Contributor | Sep 2 | 1.9% | 10 | 0.1% | 11 | 33.5% | 22 | 14.2 |
14 | Alibaba | Qwen3.8-Flash | Sep 26 | 2.4% | 20 | 0.0% | 2 | 31.3% | 13 | 11.7 |
15 | Xiaomi | MiMo-V2.6-Pro | Sep 21 | 1.9% | 11 | 0.1% | 13 | 28.0% | 8 | 10.7 |
16 | Xiaomi | MiMo-V2.6-Flash | Sep 21 | 1.6% | 7 | 0.0% | 8 | 21.3% | 2 | 5.7 |
17 | Z.ai | GLM-5.3-FlashX | Sep 18 | 1.0% | 2 | 0.0% | 7 | 20.5% | 1 | 3.2 |
18 | Alibaba | Qwen3.8-Omni-Flash | Sep 18 | 0.8% | 1 | 0.0% | 1 | 23.0% | 5 | 2.2 |
Measurement notes
The report uses anonymized, aggregate traffic routed through Vercel AI Gateway through September 2026.
- Token volume includes input, output, reasoning, cached-input and cache-creation tokens.
- Spending is estimated at published list prices and may differ from actual bills; average price per token is estimated spending divided by token volume.
- Open-weight classifications follow the current AI Gateway model list, a broader definition than in earlier reports.
- Switching rates compare paid teams with at least 10 million paid tokens in both months, with "most-used" measured by paid tokens.
- Provider location means company headquarters.
- Launch metrics cover external paid teams during each model's first 14 days. Reach uses paid teams active from the start of the launch month through the data cutoff; spend share uses total paid gateway spending during the model's window; return rate is the share of first-week teams that used the model again in week two.
- Model counts cover December–September, counting each version separately; team-size thresholds use total input and output tokens over that period.
- All figures use the most recent data and protocol available; prior months may be revised as methodology is updated.
Contributors: Eric Dodds, Christie Lin.