

Interruptions Are the Hidden Cost of the Workday
When GitHub engineers set out to understand what makes a developer's day genuinely good, they collected data from volunteers across the organization over a four-month period. The result, the Good Day Project, offers a data-backed look at how focus, meetings, and reflection shape day-to-day satisfaction and output.
The clearest signal from the study: being interrupted is far more costly than most of us realize. Developers who went the day with little or no interruption had an 82% chance of reporting a good day. Among those who were interrupted for most of the day, that probability collapsed to 7%. Focus isn't just a nice-to-have for getting code written—it is the primary driver of whether a day at work feels like a win.
Meetings, similarly, operate on a sharp tipping point. Study data shows that moving from two to three meetings a day cut the likelihood of making progress toward goals from 74% down to 14%. But cutting meetings outright isn't the answer; developers who had about one meeting a day had a 99% chance of producing high-quality work. Collaboration and conversation help, it turns out—just not when they break up every hour.
SPACE and the Real Shape of Productivity
Productivity metrics that only count output, such as number of commits or pull requests, miss nearly everything that matters. The data gathered from the study supports a more holistic view driven by the SPACE framework, which stands for Satisfaction and well-being, Performance, Activity, Communication and collaboration, and Efficiency and flow.
By building statistical models that accounted for collaboration, interruptions, ambient conditions, and other work realities, the researchers found that they could meaningfully explain and predict four things: progress toward goals, high-quality work, "getting things done," and feeling good about the day. Activity counts alone couldn't do that. Notably, developers who created the most pull requests didn't necessarily have the best days—the act of creating those pull requests may itself break concentration and pull people out of deep work.
Self-Reflection as a Simple, High-Impact Tool
One of the more practical takeaways didn't require any fancy tooling. During the study, developers were prompted at the end of each workday to note their key activities, reflect on what they accomplished, and rate their day. This lightweight practice proved helpful not just for data collection but for the participants themselves.
This aligns with the study's push toward frequent check-ins: rather than waiting for weekly, monthly, or yearly reviews, developers can take two minutes at day's end to close out their work. The act of writing—in a notebook, a markdown file, or a quiz in a tool like the Good Day Project dashboard—helps developers notice patterns in what made their day better. The right choice of reflection style is personal; some prefer free-form journaling, others like a structured set of questions. The important thing is that the switch in context—from workday to evening, from "doing" to "reviewing"—happens deliberately.
Applying the Findings on Any Team
While the project is still experimental, its results suggest steps that can be taken by individuals or teams today, no new automation required.
- Actively manage interruption patterns. A solo hour of deep focus per day is far more valuable than the same hour scattered across fifteen-minute fragments. Try blocking an hour on your calendar with a clear label, notifying your team that you're unavailable during that time, and treating meetings that can be skipped—or simply batched together—as candidates for cancellation.
- Run a simple daily reflection. At the end of each day, jot down what you worked on and how it felt. Over time this can be as instructive as any analysis tool for identifying your own personal characteristics of a good day.
- Encourage use of the dashboard approach shown here. The Good Day Project's dashboard surfaces metrics such as the start and end time of the workday, count of meetings, number of code commits, and how the developer felt that day.
A Needed Complement to Delivery Metrics
The relationship between feelings and work isn't a therapeutic aside—it's a fundamental aspect of sustainable productivity. It suggests broad shifts organizations could adopt by default: not just measuring "things shipped" but asking developers directly whether they achieved what they set out to do and whether they were able to do it. As the industry continues to push on better methods for measuring and improving developer productivity, the SPACE framework offers a worthwhile multidimensional lens. The Good Day Project, with its aim to track the ebb and flow of your work as a daily habit, might bring that idea closer to everyday practice.
What the data says about good days
To find out what separates a good day from a bad one, we combined rich data collection, daily reflection prompts, and personalized charts and commentary for each participating developer. The results point to a few clear patterns: interruption and meeting load dominate how a day feels, and even lightweight self-reflection has measurable value.
Meetings and interruptions are the main levers on day quality
Days with few or no interruptions produced an 82% chance of being rated good; when interruptions spanned most of the day, that chance fell to 7%. Stress followed the same curve: developers interrupted for most of the day had a 77% chance of feeling stressed, and even moderate interruption (some of the day) raised the chance of stress from 1.6% to 36.4%.
Meetings had a similarly steep threshold. With an average of two meetings a day, the chance of feeling progress toward goals was 74%; at three meetings that dropped to 14%. At one meeting per day, developers had a 99% chance of doing quality work.
Not all meetings or interruptions are avoidable, and some interruptions are useful for rest and thinking. Still, developers in the study found that blocking calendar time and being selectively unavailable helped contain fragmentation. For anyone looking to act, the practical question is not just how much you get done, but what repeatedly breaks your focus.
Activity alone is not adequate for characterizing developers’ days. More information is needed, especially about focus and flow.
There is more to a developer’s day than their coding activity and relying solely on activity counts to express a day’s productivity can produce a weak or misleading signal. Once we chose to use the SPACE framework and gathered developers’ self reports, we pieced together a much richer view of developers’ days.
Activity — including pushes, commits, pull requests, and issues — explained just a small part of developers having a good day, or feeling like they made progress or did quality work. Also, those with the most pull requests did not report the best days.
A short daily reflection habit pays off
We expected the daily survey format might feel tedious. Instead, completion was 90% over the two-week study, and participants said afterward they would have continued for twice as long. The reason was not just the reports: developers credited the daily prompts with making them more mindful of how their day was forming.
“It forced me to think about how my day is developing instead of just letting it develop and reacting to whatever happens.”
Self-reflection is known to surface areas for improvement and increase satisfaction. Here, it delivered immediate value: most participants were eager to complete the daily questions, and some kept the habit going after the study ended. The distinction between Flowing and Disrupted days came down to fewer than three meetings on average and interruption confined to a small part of the day. Flowing days were more likely to be rated good, and the ability to make at least some progress toward goals mattered more than heroic effort.
Developers’ days can be classified two ways: Flowing and Disrupted
Using the SPACE productivity framework, we were able to classify the types of days a developer typically has. The data shows developer days can often be classified into one of two ways: Flowing and Disrupted Days.
The classifications were based on questions we asked developers about their day, and included things like stress, breaks, meetings, interruptions, if they worked with or helped others, and how much work they got done. Using cluster analysis, we found that typical developer days often fall into two categories:
Flowing Days
Disrupted Days
Less than three meetings per day
More than three meetings per day
Interruptions during a small part of the day
Interruptions during most of the day
Progress toward goals most of the day
Less progress toward goals
Doing high quality work at least some of the day
Doing high quality work only a small part of the day
Getting lots of work done at least some of the day
Getting lots of work done only a small part of the day
* The shaded cells are the most predictive items.
Tip: Making some measurable progress toward a goal is enough to tip a day toward good. Focus on protecting a little time, not on engineering a perfect day.
SPACE held up as a survey foundation
Questions built around the SPACE framework resonated with developers, and responses were normally distributed with a full range of values — an early sign of validity. Most participants said they were excited to answer the daily surveys. The post-study feedback suggested the surveys could carry a little more weight: they were neither too long nor disruptive. Developers also asked for a question about the previous night’s sleep and for a daily open-ended journaling option.
Charts that show, not just tell
Personalized reports opened with the developer’s split of good versus not-so-good days, then layered that rating on top of their activity on github.com across survey days. This first chart was the easiest for developers to understand: it let them see whether activity volume tracks day sentiment or whether other factors are at play.

You told us how each day went. On this chart, we marked each day’s response (from 1-Terrible to 5-Awesome) and matched it to your activity on Github.com. Activity isn’t everything! But this gives you a glimpse of what role your dev work plays in you having a good day.
Look at the dark line — it’s your view of how Good each day was. Does it mirror your activity? Then how much you do each day shapes your sentiment. Does the dark line stay consistent although your activity goes up and down each day? Then there are other things, beyond your total activity, that give you a good day.
Figure: Activity/Good days chart with commentary
The chart developers found most interesting overlaid meetings, interruptions, and activity with Good Days highlighted. It connected the efficiency and flow dimensions to both activity metrics and overall day feeling.
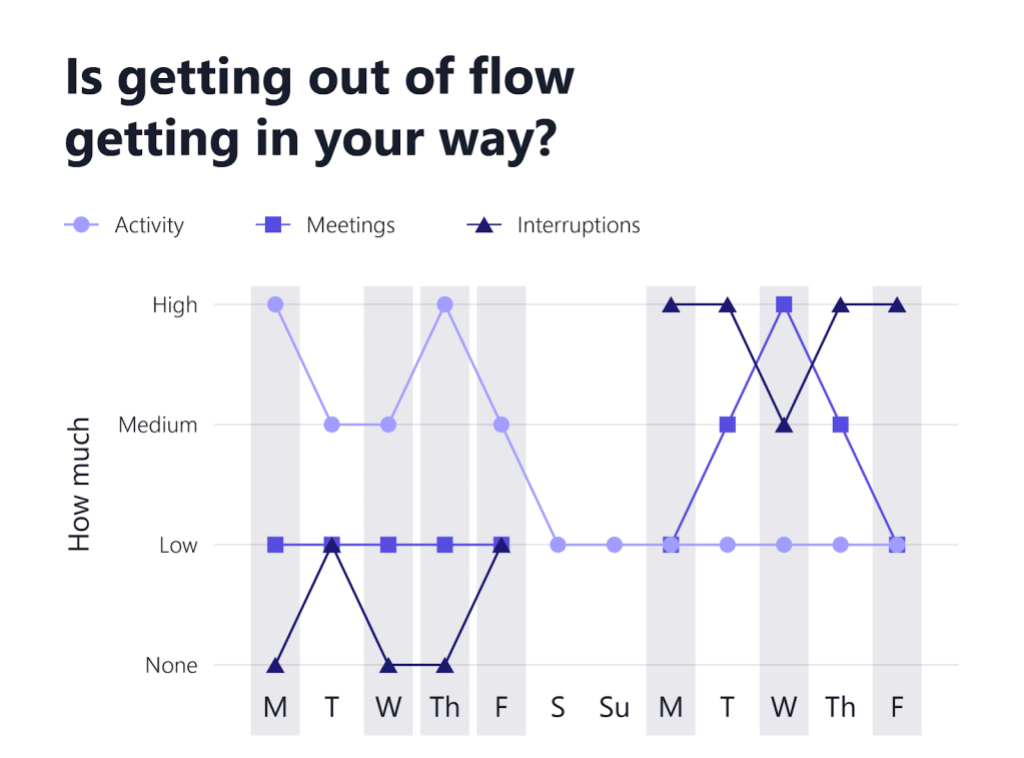
Now, here are your interruptions. When our days are fragmented by meetings and interruptions, it can make us less effective. Context switches are cognitively expensive and take time to recover from.
Here’s how interruptions and meetings relate to your dev activity. What do you notice about your Good Days?
Figure: Activity/Interruptions/Meetings and Good days overlay chart with commentary
Developers had suspected that fragmented days felt worse and were less productive; the data confirmed their intuition. The report earned its keep because it was personal. Team-level aggregates would have washed out the patterns strong— a few participants displayed almost opposite trends, so only individual-level analysis could guide them to changes that matter.
But what about me? Can the Good Day Project help make more of my days awesome?
You may be wondering if the findings from this project apply to you. While this early investigation was conducted on a small set of GitHub engineers, there are two strong signals that these findings are likely true for other developers as well:
First, our findings align with other research conducted on larger groups of developers. For example, a recent study on daily reflection and gratitude found that the act of reflection improves satisfaction, especially during the difficult circumstances of a crisis. Other studies have demonstrated that self-monitoring brings awareness, and can help developers set goals and improve over time. Interruptions can make a day feel unproductive and slow down progress or finishing up tasks. Finally, the shortcomings of only using activity to proxy developer productivity or work have been identified before: A recent study found that coding time only explained 7% variance in data about developer productivity.
Second, we conducted an additional investigation and found that the developers we studied were similar to other non-GitHub engineers: we compared the activity data for those who participated in our study with activity data for developers across paid Teams and Enterprise accounts; we chose this subset of developers because their work environment and activities was most common. The activity patterns seen among our study participants are similar to the most active development teams, defined as those in the top ⅔ of development activity (e.g., pushes and creating pull requests) and among the highest in communication and planning activity (e.g., creating issues, and commenting on pull requests). This is because Hubbers develop and communicate almost exclusively on GitHub.com, meaning their development patterns likely fall into the high range of use; other development teams likely use a suite of tools to develop and communicate about their software, so not all of their activity would be visible on the GitHub platform.
Takeaways: the format was a hit
Beyond the insights, we wanted the experience to be frictionless. On those counts the project did well:
- Prompts were quick and welcome. Survey completion held at 90%, with each response taking under two minutes. Developers rated the cadence as non-disruptive and said they’d have kept going for four weeks.
- Value came two ways. The personalized report offered concrete openings — some developers said they’d schedule harder work for their peak energy windows. Just as often, participants valued the daily reflection habit itself.
- Privacy was a non-issue. Each developer saw only their own data, and the post-study survey found no concerns about sharing. Most participants wanted the concept turned into an automated tool for daily use.
We’re continuing this work with the Office of the CTO (OCTO), which has built a proof of concept for Hubbers to collect own data through a Slack app and private repositories. Even without automation, though, the barrier to better days is low: a few questions at the end of each day and the willingness to look at your own patterns.
Survey design and what we asked
To complement the quantitative analysis, the team ran a survey to understand individual perceptions of work days. The survey was distributed within GitHub and received responses from employees across engineering, product, design, and other functions. The questions were framed around three areas: what makes a day productive, what makes it energizing, and what participants would change about a typical day if they had control over it.
Respondents were asked to reflect on their most recent full work week. For each day, they indicated whether it felt productive, energizing, neither, or both. They also provided free-text explanations of the factors that contributed to those feelings. The survey additionally captured metadata such as role, tenure, and time zone, allowing the team to compare sentiment across different groups.
The full survey instrument, including the exact question wording and response scales, is reproduced below. The team opted for a mix of Likert-scale items and open-ended prompts to balance structured comparison with the nuance of personal narrative.
| Question | Scale |
|---|---|
| What is your GitHub handle? This is how we will link all your responses and find your system data. | n/a |
| How was your work day? | Terrible Bad OK Good Awesome |
| I worked with other people | None of the day A little of the day Some of the day Much of the day Most or all of the day |
| I helped other people | None of the day A little of the day Some of the day Much of the day Most or all of the day |
| My work was interrupted | None of the day A little of the day Some of the day Much of the day Most or all of the day |
| I made progress toward my goals | None of the day A little of the day Some of the day Much of the day Most or all of the day |
| I did high-quality work | None of the day A little of the day Some of the day Much of the day Most or all of the day |
| I did a lot of work | None of the day A little of the day Some of the day Much of the day Most or all of the day |
| Which best describes how you feel about your work day? | Tense or nervous Stressed or upset Sad or Depressed Bored Calm or Relaxed Serene or Content Happy or Elated Excited or Alert |
| My day was stressful | None of the day A little of the day Some of the day Much of the day Most or all of the day |
| I took breaks today | None of the day A little of the day Some of the day Much of the day Most or all of the day |
| How many meetings did you have today? | 0 1 2 3-4 5 or more |
| Today, I felt most productive: | In the morning (9:00 – 11:00) Mid-day (11:00 – 13:00) In the early afternoon (13:00 – 15:00) In the late afternoon (15:00 – 17:00) Outside typical work hours Equally throughout the day |
| Today, I felt least productive: | In the morning (9:00 – 11:00) Mid-day (11:00 – 13:00) In the early afternoon (13:00 – 15:00) In the late afternoon (15:00 – 17:00) Outside typical work hours Equally throughout the day |
The survey results were intended not as a definitive measure of well-being, but as a qualitative lens through which to interpret the telemetry data. In practice, the survey responses helped validate several of the patterns observed in the calendar and chat logs, particularly around the role of meeting load and uninterrupted focus time.


