

A New View of Cross-Border Collaboration
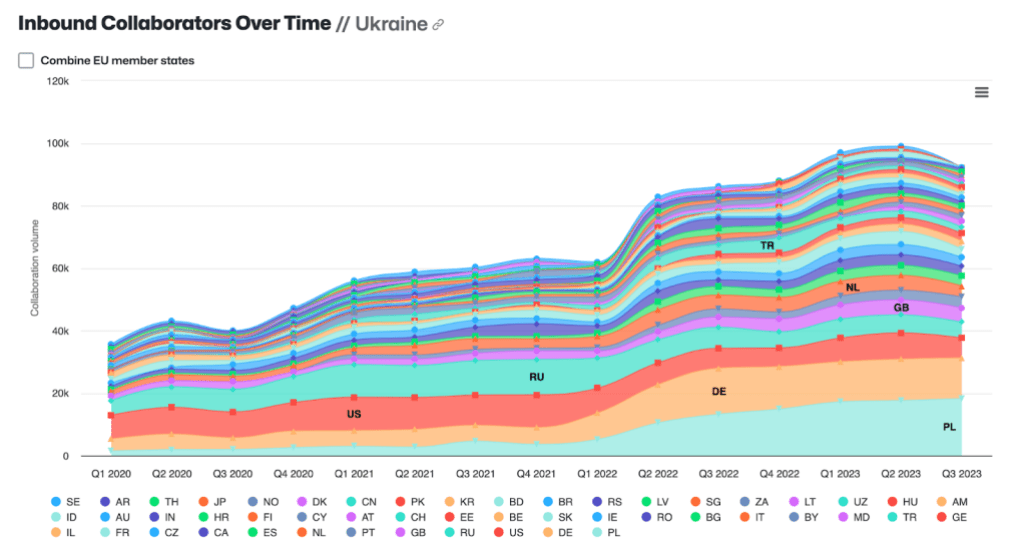
The GitHub Innovation Graph now offers a fresh way to examine how software developers around the world work together. The Q3 2023 data release introduces stacked area charts for the economy collaborators metric, which tracks Git pushes and pull requests sent by developers in one economy to repositories owned by developers or organizations in another. This visualization makes it easier to spot trends in cross-border collaboration over time.
The new charts are particularly revealing when set against major world events. Inbound collaboration with Ukraine—meaning developers in other economies contributing to Ukrainian-owned repositories—showed a clear spike in Q1 2022, coinciding with a wave of international support following the Russian invasion. Notably, this increase did not fade after the initial surge; it continued to rise through subsequent quarters, suggesting durable engagement rather than a momentary reaction.
Language and License Shifts in Q3 2023
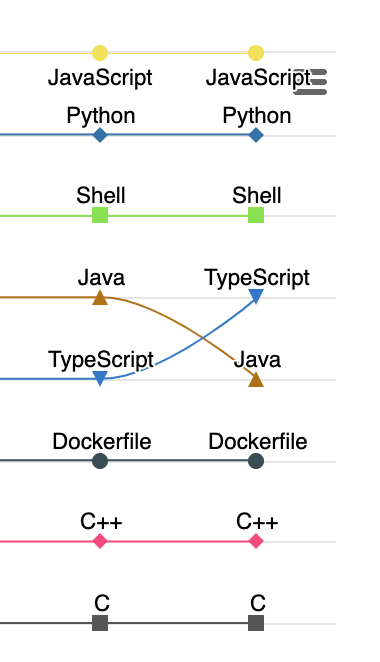
The latest quarterly figures also capture significant shifts in the broader open source ecosystem. TypeScript overtook Java for the first time to become the third most popular language across OSS projects on GitHub, a milestone that occurred in Q3 2023.
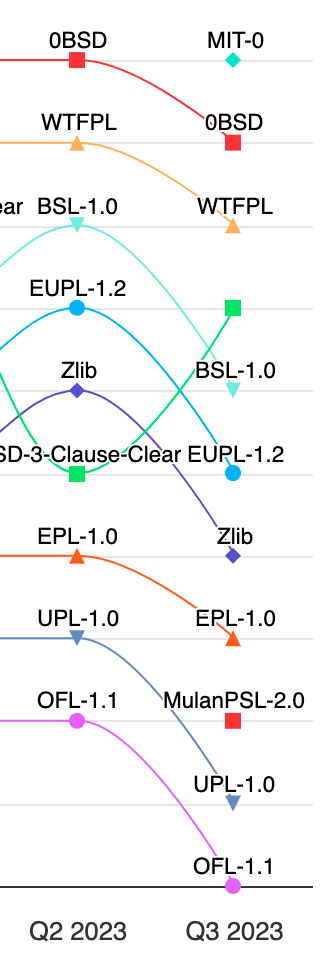
The same quarter saw two new entries in the top licenses chart. The MIT-0 license, which drops the notice-preservation requirement of the standard MIT license, appeared for the first time; AWS pioneered its use for example code. The Mulan license also made its debut. This permissive license, similar to Apache-2.0, is notable as the first OSI-approved open source license written in both Chinese and English, reflecting the growing influence of the Chinese developer community.
The full dataset for Q3 2023, along with the interactive visualizations, is available on the GitHub Innovation Graph site. The project team welcomes feedback and suggestions via the issues page.


