

Why Your Abstraction Kills the Error Message
Imagine you have a simple assertion that you run with Node directly:
const add = (a, b) => a + b

if (add(1, 2) !== 4) {
	throw new Error('Expected 3 to be 4')
}
That fails with a standard stack trace. The message is understandable, but writing the same test with Jest gives you much more:
test('sums numbers', () => {
	expect(add(1, 2)).toBe(4)
})
The failure output includes a codeframe, showing you the exact line of the failing assertion:
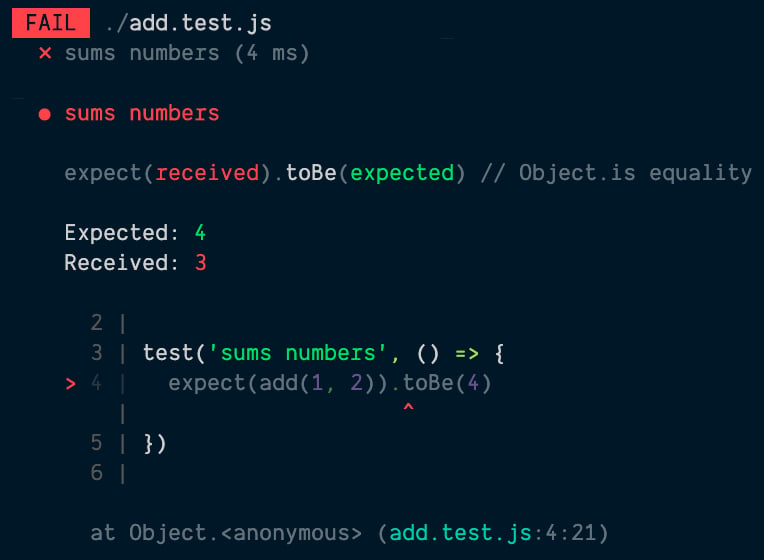
That's helpful. Now consider extracting that assertion into a reusable function so multiple tests can use it:
const add = (a, b) => a + b

function assertAdd(inputs, output) {
	expect(add(...inputs)).toBe(output)
}

test('sums numbers', () => {
	assertAdd([1, 2], 4)
})
Run a test that calls this abstraction and the error output collapses:
FAIL  ./add.test.js
  ✕ sums numbers (3 ms)

  ● sums numbers

    expect(received).toBe(expected) // Object.is equality

    Expected: 4
    Received: 3

      2 |
      3 | function assertAdd(inputs, output) {
    > 4 |   expect(add(...inputs)).toBe(output)
        |                          ^
      5 | }
      6 |
      7 | test('sums numbers', () => {

      at assertAdd (add.test.js:4:26)
      at Object.<anonymous> (add.test.js:8:3)
The codeframe is no longer pointing at the test code. It's showing the internals of assertAdd, which is useless when you have many tests calling it. You get a line in the stack trace identifying the caller, but the visual context is gone. You want the error to point at the actual call site, not the abstraction internals.
How Jest Builds the Codeframe
Jest's expect library does the work of producing that helpful output. The error.stack property already contains the full, colored message plus the stack trace. But Jest's message formatting filters out the internal noise—the frames from the test runner and framework itself—and then takes the first remaining line to build a codeframe.
To make your abstraction produce the same quality of output, you need to ensure that the first relevant line in the stack trace is the one you want displayed. The approach is to remove the frames that belong to your utility function and everything above it.
One way is to filter the stack trace manually:
function assertAdd(inputs, output) {
	try {
		expect(add(...inputs)).toBe(output)
	} catch (error) {
		error.stack = error.stack
			// error.stack is a string, so let's split it into lines
			.split('\n')
			// filter out the line that includes assertAdd (you could make this more robust by using your test utils filename instead).
			.filter((line) => !line.includes('assertAdd'))
			// join the lines back up into a single (multiline) string
			.join('\n')
		throw error
	}
}
That works, but it only removes the assertAdd frame. If your utility is itself built on other utility functions, those frames would also need filtering. A cleaner solution uses a Node.js built-in.
Using Error.captureStackTrace
Node's Error.captureStackTrace is designed for exactly this case:
function assertAdd(inputs, output) {
	try {
		expect(add(...inputs)).toBe(output)
	} catch (error) {
		Error.captureStackTrace(error, assertAdd)
		throw error
	}
}
The second argument is the constructorOpt — the function where the stack trace should stop. All frames above it, including that function, are omitted.
Putting it together in the full abstraction:
const add = (a, b) => a + b

function assertAdd(inputs, output) {
	try {
		expect(add(...inputs)).toBe(output)
	} catch (error) {
		Error.captureStackTrace(error, assertAdd)
		throw error
	}
}

test('sums numbers', () => {
	assertAdd([1, 2], 4)
})
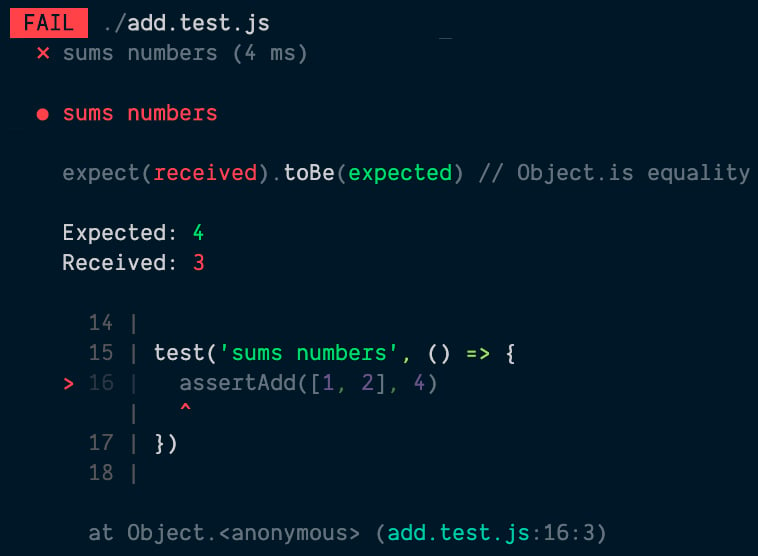
Now the failure output is meaningful again:
FAIL  ./add.test.js
  ✕ sums numbers (3 ms)

  ● sums numbers

    expect(received).toBe(expected) // Object.is equality

    Expected: 4
    Received: 3

      11 |
      12 | test('sums numbers', () => {
    > 13 |   assertAdd([1, 2], 4)
         |   ^
      14 | })
      15 |

      at Object.<anonymous> (add.test.js:13:3)
Visually, the codeframe points at the actual test assertion:
When This Matters
Jest automatically skips codeframes for lines coming from node_modules, so if you publish utilities to npm, you likely don't need this trick. It's primarily useful for testing abstractions you maintain within your own testbase — the ones that grow organically at scale.
That said, manipulating stack traces isn't limited to local test code. DOM Testing Library uses the same technique in its waitFor utility to ensure failures from asynchronous helpers have clean, useful stack traces:
● waitFor works

  TestingLibraryElementError: Unable to find an element with the text: /nothing matches this/. This could be because the text is broken up by multiple elements. In this case, you can provide a function for your text matcher to make your matcher more flexible.

    <body />

      2 |
      3 | test('waitFor has a nice stack trace', async () => {
    > 4 |   await waitFor(() => {
        |         ^
      5 |     screen.getByText(/nothing matches this/)
      6 |   })
      7 | })

      at waitForWrapper (node_modules/@testing-library/dom/dist/wait-for.js:94:27)
      at Object.<anonymous> (add.test.js:4:9)
Async stack traces are often noisy and unhelpful by default, which makes intentional stack trace manipulation a worthwhile tool to have in your bag regardless of where you use it.


