
Startup Time Was Creeping Up—and Nobody Noticed
For a long time, Dropbox’s Android team tracked startup by measuring the gap between the user tapping the app icon and the app becoming fully interactive. That sounds straightforward, but the team’s monitoring charts only displayed a two-week window. Over that span, startup time looked stable—just a few milliseconds of normal fluctuation. But looking at a longer view, from December 2019 to April 2020, revealed the real story: startup time had been climbing steadily for months as features piled up, hidden by the short-range charts.
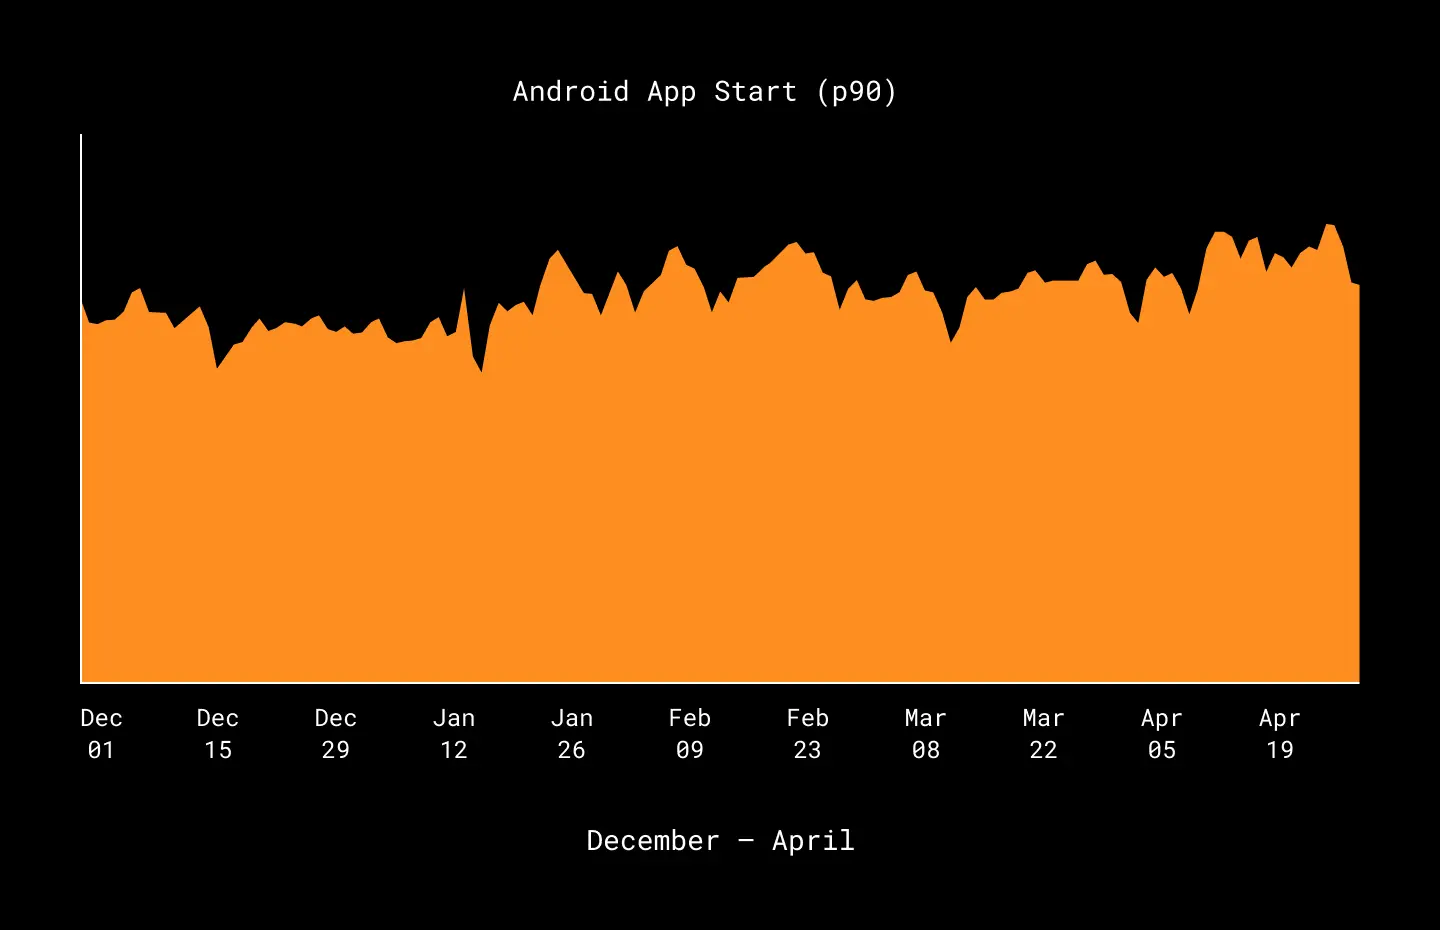
That accidental discovery prompted a deeper investigation into what was actually happening during initialization, and a commitment to broader, more cohesive monitoring going forward.
Instrumenting the Startup Path
App startup is more difficult to measure than something like a single API call because it involves many sequential steps on the device before the UI is ready. The team identified three main phases in the initialization code:
- Running migrations
- Loading application services
- Loading initial users
Initial attempts used Android Studio’s profiling tools on test phones, but that approach couldn’t produce statistically meaningful results for an app with over a billion installs spanning hardware from old Nexus 5s to current Pixel devices. Instead, the team instrumented production code with scenario-based logging to measure each step individually.
perfMonitor.startScenario(AppColdLaunchScenario.INSTANCE)
perfMonitor.startRecordStep(RunMigrationsStep.INSTANCE)

// perform migrations step wrok

perfMonitor.startRecordStep(LoadAppServicesStep.INSTANCE)

// load application services step

perfMonitor.startRecordStep(LoadInitialUsers.INSTANCE)

// perform initial user loading step

perfMonitor.stopScenario(AppColdLaunchScenario.INSTANCE)
Finding the Real Offenders
The new measurements, introduced in May, pinpointed three primary causes of the startup slowdown.
Firebase Performance Library
Firebase Performance provides useful low-level metrics and method-level profiling. But it came at a hidden cost: the team discovered that the entire Firebase suite took seven times longer to initialize with the Performance tool enabled. Since the team wasn’t actually using the fine-grained profiling features it offers, they removed the library reference entirely, prioritizing fast startup over individual method data.
Expensive Migrations
Several internal migrations—for feature flags, databases, and similar—were running on every launch. Some of these turned out to be unnecessary at startup, and at least one was so outdated it could be removed from the app altogether. The poor performance was easy to miss on fast development hardware, but the code degraded significantly on older devices and OS versions.
Repeated User Parsing
In the legacy portion of the app, user contact metadata is stored as JSON blobs. The code for reading and converting those blobs into Java objects was being invoked multiple times by different legacy features—each time paying the cost of JSON parsing. The immediate fix was caching the parsed user objects during initialization. A more permanent solution, the team notes, would be migrating to Room database objects and converting those to business entities as the monolith is broken down.
Results and New Habits
Dropping Firebase Performance, eliminating unnecessary migrations, and caching user loading together produced a 30% improvement in app launch performance. The team also built dashboards to keep the slower long-term trend visible and prevent similar regressions from sneaking in again.
Two practices came out of this work:
- Measure third-party library impact before adoption. Any new library must now show its effect on startup time, build time, and APK size before it can be added.
- Cache expensive work by default. Even when it complicates the code slightly, caching is worth the maintenance burden compared with the cost of repeating heavy computations at launch.
With better performance analytics in place, the team says it can now make larger architectural investments, like deprecating legacy C++ code, with more confidence. The new dashboards track the most critical parts of the app to help ensure startup stays fast for users on all devices.


