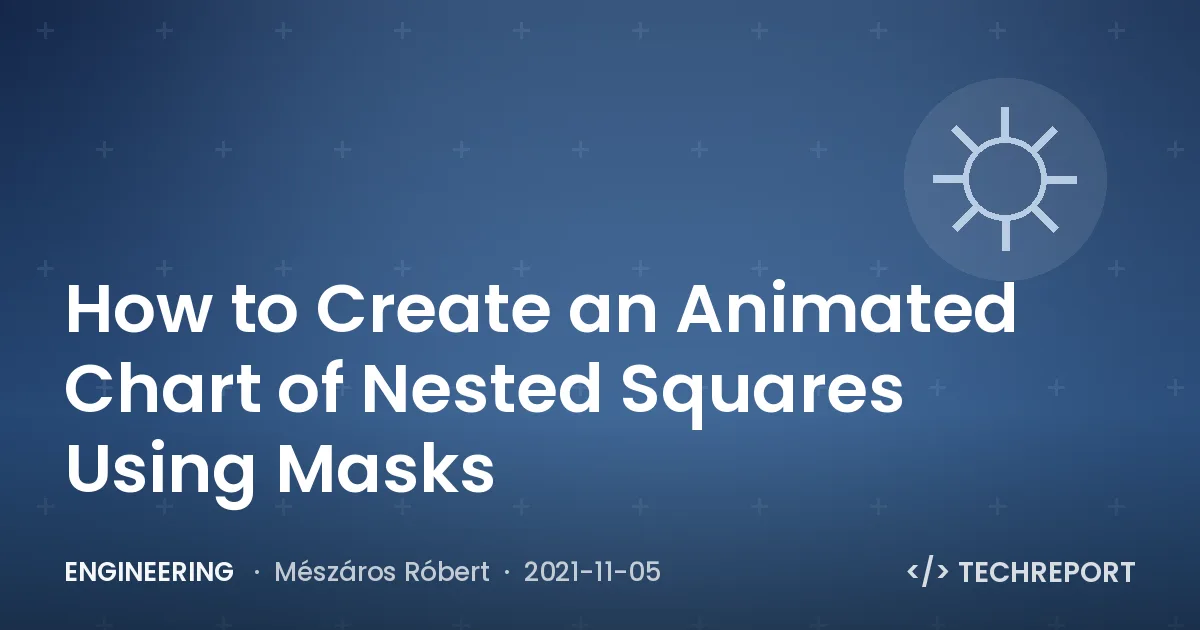
Nested squares — stacked rectangles in decreasing sizes whose bottom-left corners coincide at a single point — are an unnamed but useful chart form for comparing relative magnitudes. Drawing them statically is easy: stack SVG <rect> elements, or even divs, from largest to smallest. Interactivity complicates matters, because hovering one shape should dim and push the others aside.

Building the squares
The irregular L-shaped pieces are made from plain rectangles combined with SVG masks. Using masks avoids the mess of constructing the same shapes with <path> data.
<svg viewBox="0 0 320 320" width="320" height="320">
  <path d="M320 0H0V56H264V320H320V0Z" fill="#264653"/>
</svg>
Sizing rectangles from data
Start from a data set and derive an SVG with one rectangle per value, with the largest value mapping onto the full chart dimensions.
type DataSetEntry = {
  label: string;
  value: number;
};

type DataSet = DataSetEntry[];

const rawDataSet: DataSet = [
  { label: 'Bad', value: 1231 },
  { label: 'Beginning', value: 6321 },
  { label: 'Developing', value: 10028 },
  { label: 'Accomplished', value: 12123 },
  { label: 'Exemplary', value: 2120 }
];
<svg viewBox="0 0 320 320" width="320" height="320">
<rect width="320" height="320" y="0" fill="..."></rect>
<rect width="264" height="264" y="56" fill="..."></rect>
<rect width="167" height="167" y="153" fill="..."></rect>
<rect width="56" height="56" y="264" fill="..."></rect>
<rect width="32" height="32" y="288" fill="..."></rect>
</svg>Get the maximum with Math.max(); with this small data set it is visibly 12123.
const dataSetHighestValue: number = Math.max(
  ...rawDataSet.map((entry: DataSetEntry) => entry.value)
);
The chart dimensions are set arbitrarily to 320. Because the rectangles are squares, width and height are equal, so the largest value must map to 320. The general problem is scaling a number from one range ([0, 12123]) to another ([0, 320]).
const remapValue = (
  value: number,
  fromMin: number,
  fromMax: number,
  toMin: number,
  toMax: number
): number => {
  return ((value - fromMin) / (fromMax - fromMin)) * (toMax - toMin) + toMin;
};

remapValue(1231, 0, 12123, 0, 320); // 32
remapValue(6321, 0, 12123, 0, 320); // 167
remapValue(12123, 0, 12123, 0, 320); // 320
Since all values are mapped onto the same range, wrap the scaling logic in a helper rather than passing minimums and maximums each time.
const valueRemapper = (
  fromMin: number,
  fromMax: number,
  toMin: number,
  toMax: number
) => {
  return (value: number): number => {
    return remapValue(value, fromMin, fromMax, toMin, toMax);
  };
};

const remapDataSetValueToSvgDimension = valueRemapper(
  0,
  dataSetHighestValue,
  0,
  svgDimension
);
remapDataSetValueToSvgDimension(1231); // 32
remapDataSetValueToSvgDimension(6321); // 167
remapDataSetValueToSvgDimension(12123); // 320Inserting the SVG elements
Create the <svg> and its five <rect> children with createElementNS, setAttribute and appendChild. Note that it must be createElementNS and not createElement: HTML and SVG live under different namespace URIs, and createElement assumes the HTML namespace, so an SVG helper keeps the verbosity out of the main code.
document.createElementNS('http://www.w3.org/2000/svg', 'svg') as SVGSVGElement;const createSvgNSElement = (element: string): SVGElement => {
return document.createElementNS('http://www.w3.org/2000/svg', element);
};Order matters when appending, since there is no explicit z-index: the largest rectangle must come first and the smallest last. Sorting the data before the loop takes care of that.
const data = rawDataSet.sort(
  (a: DataSetEntry, b: DataSetEntry) => b.value - a.value
);

data.forEach((d: DataSetEntry, index: number) => {
  const rect: SVGRectElement = createSvgNSElement('rect') as SVGRectElement;
  const rectDimension: number = remapDataSetValueToSvgDimension(d.value);

  rect.setAttribute('width', `${rectDimension}`);
  rect.setAttribute('height', `${rectDimension}`);
  rect.setAttribute('y', `${svgDimension - rectDimension}`);

  svg.appendChild(rect);
});
The SVG coordinate system begins at the top-left, [0, 0], so the x attribute can be left at its default of 0 and only y is set. To make all rectangles appear to originate from a shared bottom-left point, each one is pushed down by the difference between the chart dimension and its own size.
Turning squares into cutout shapes
The target shapes resemble a seven, or an L rotated 180 degrees. Viewed as missing pieces rather than solid pieces, each shape is the full square minus a smaller square cut from one corner.

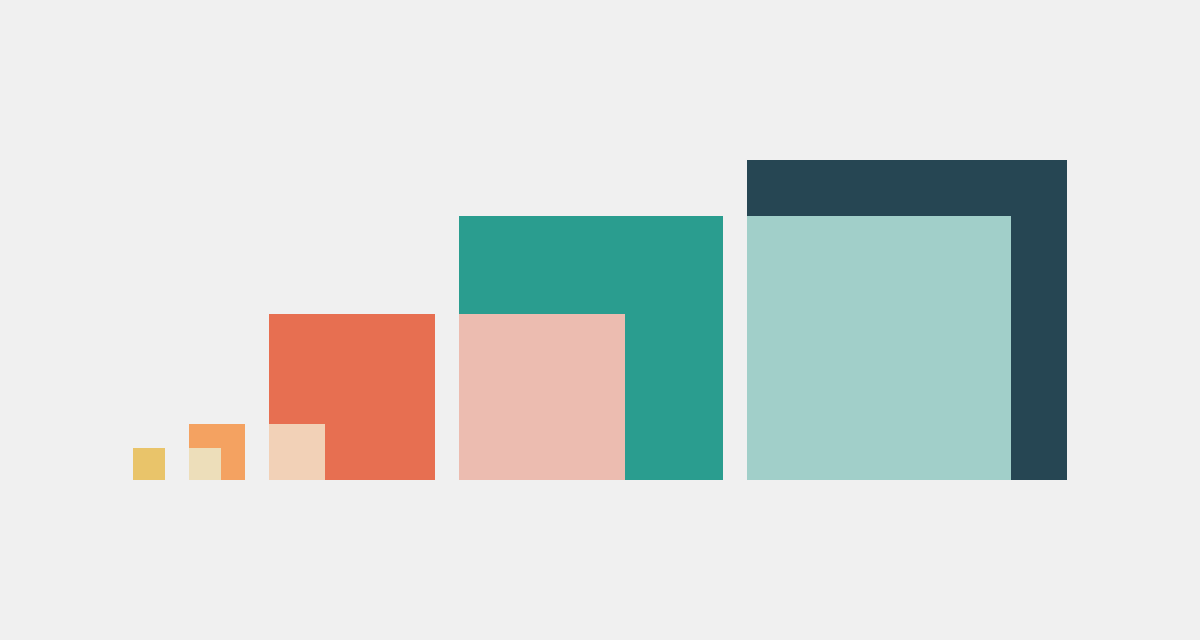
Those cutouts are the same rectangles already computed for the other values; the goal is to hide them instead of drawing them.
How masks behave
A mask is defined inline in its <svg>, given a unique id, and then referenced by the mask attribute on the element it applies to. The shapes inside the <mask> tag define the mask (there are inlining-free alternatives, but this is the simplest). The element inside the mask needs a fill, and the fill value fully determines the outcome.
<svg>
  <mask id="...">
    <!-- ... -->
  </mask>
</svg>
<svg>
<mask id="myCleverlyNamedMask">
<!-- ... -->
</mask>
<rect mask="url(#myCleverlyNamedMask)"></rect>
</svg>Applying the previous, smaller rectangle as a mask over the largest element is the first experiment:
<svg viewBox="0 0 320 320" width="320" height="320">
  <mask id="theMask">
    <rect width="264" height="264" y="56" fill=""></rect>
  </mask>
  <rect width="320" height="320" y="0" fill="#264653" mask="url(#theMask)"></rect>
</svg>- White fill: the large rectangle is cropped to the exact dimensions of the masking rectangle — not the goal.
- Black fill: nothing visible remains (shown with dashed outlines for reference). Areas filled black become invisible;
whiteandblackare how mask visibility is controlled. - Gray fill: a partially transparent result, since a value between white and black produces neither fully opaque nor fully hidden output — useful to keep in mind for future work.


Two rules follow from this: the element inside <mask> governs the size of the masked area, and its contents can be rendered visible, invisible or transparent. A mask may also contain as many child elements as needed, which is the trick the chart relies on: two stacked <rect> elements with opposite fills.
<svg viewBox="0 0 320 320" width="320" height="320">
  <mask id="maskW320">
    <rect width="320" height="320" y="0" fill="???"></rect>
    <rect width="264" height="264" y="56" fill="???"></rect>
  </mask>
  <rect width="320" height="320" y="0" fill="#264653" mask="url(#maskW320)"></rect>
</svg>
With the mask spanning the dimension of the largest element, a black square on the bottom means everything under that area disappears while the smaller white rectangle remains.
<mask id="maskW320">
  <rect width="320" height="320" y="0" fill="black"></rect>
  <rect width="264" height="264" y="56" fill="white"></rect>
</mask>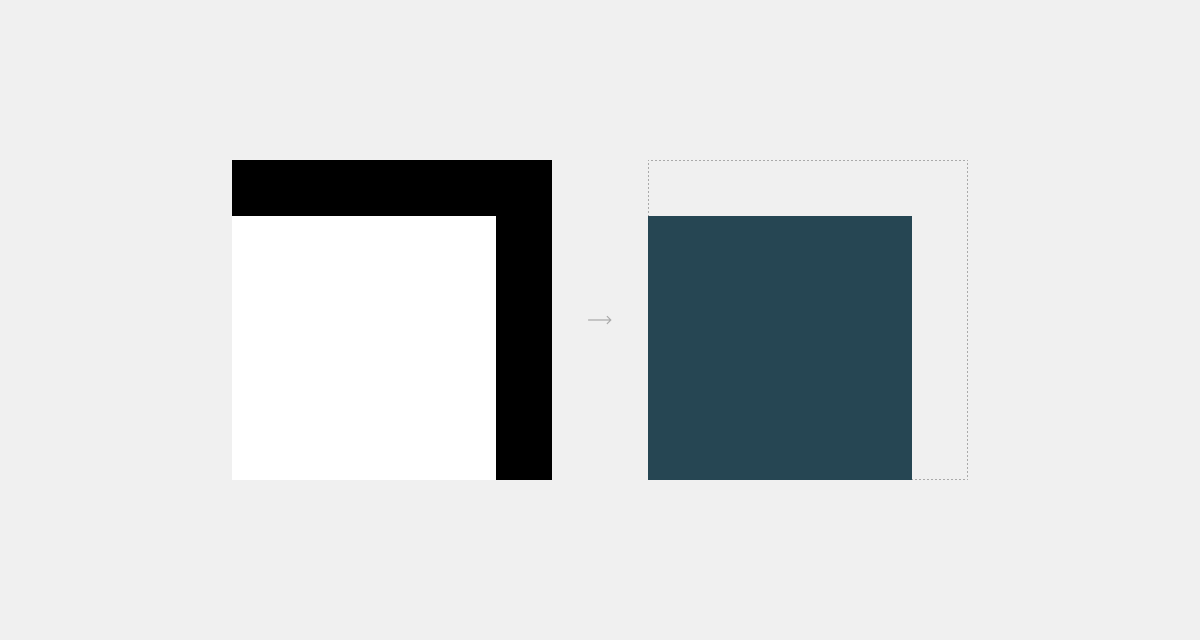
Swapping the order puts black on top, closer on the z-axis.
<mask id="maskW320">
  <rect width="320" height="320" y="0" fill="white"></rect>
  <rect width="264" height="264" y="56" fill="black"></rect>
</mask>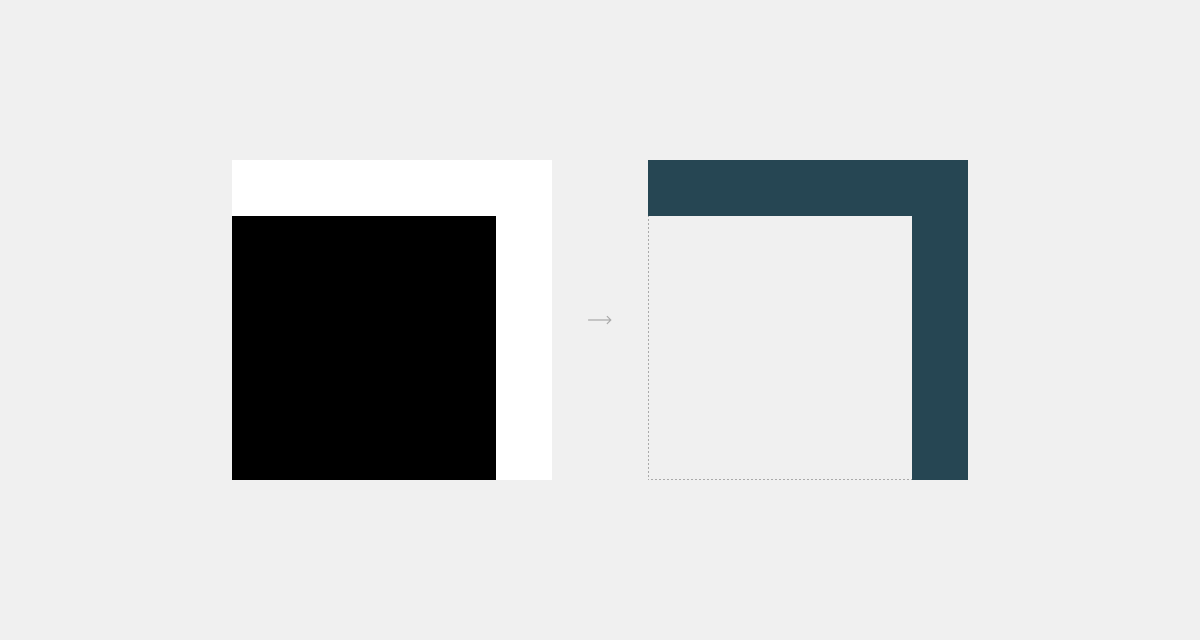
This produces the intended result: everything under the largest white-filled rectangle stays visible, but the smaller black rectangle sits above it and masks that region away.
Generating the masks programmatically
Mask generation mirrors the rectangle creation, using a second loop that builds each mask and its two rect children. The difference is that the rects are appended to the mask instead of the SVG.
data.forEach((d: DataSetEntry, index: number) => {
  const mask: SVGMaskElement = createSvgNSElement('mask') as SVGMaskElement;

  const rectDimension: number = remapDataSetValueToSvgDimension(d.value);
  const rect: SVGRectElement = createSvgNSElement('rect') as SVGRectElement;

  rect.setAttribute('width', `${rectDimension}`);
  // ...setting the rest of the attributes...

  mask.setAttribute('id', `maskW${rectDimension.toFixed()}`);

  mask.appendChild(rect);

  // ...creating and setting the attributes for the smaller rectangle...

  svg.appendChild(mask);
});

data.forEach((d: DataSetEntry, index: number) => {
    // ...our code to generate the colored rectangles...
});
The index could serve as the mask id, though a more readable naming scheme is preferable.
mask.setAttribute('id', `maskW${rectDimension.toFixed()}`); // maskW320, masW240, ...The smaller rectangle's value is already at hand, because the data was sorted from highest to lowest: the next element in the loop is exactly the rectangle to reference, addressed by its index.
// ...previous part where we created the mask and the rectangle...

const smallerRectIndex = index + 1;

// there's no next one when we are on the smallest
if (data[smallerRectIndex] !== undefined) {
  const smallerRectDimension: number = remapDataSetValueToSvgDimension(
    data[smallerRectIndex].value
  );
  const smallerRect: SVGRectElement = createSvgNSElement(
    'rect'
  ) as SVGRectElement;

  // ...setting the rectangle attributes...

  mask.appendChild(smallerRect);
}

svg.appendChild(mask);
Finally, the colored rectangle created in the original loop receives a mask attribute matching that naming format.
rect.setAttribute('mask', `url(#maskW${rectDimension.toFixed()})`); // maskW320, maskW240, ...The finished chart consists of nested squares that also come apart on hover, achieved entirely by using the <mask> element to carve out the corner of each square.