

Q2 2023 Data Now Live
The GitHub Innovation Graph has been updated with Q2 2023 data. The quarterly release covers eight metrics of public software development activity on GitHub: Git pushes, repositories, developers, organizations, programming languages, licenses, topics, and economic collaborators. The full dataset is available for exploration on the Innovation Graph site.
Chart Color Updates
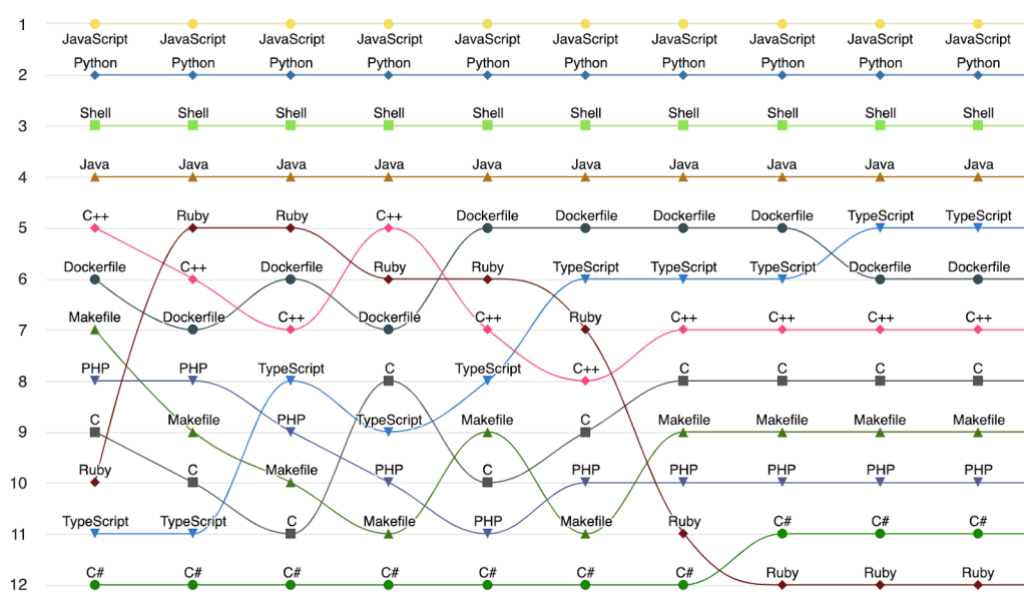
Programming language rankings now use a color scheme consistent with the github-linguist/linguist repository. This aligns the Innovation Graph charts with the language statistics section found on GitHub repositories, so the colors should be immediately recognizable to frequent GitHub users.
Clearer Chart Titles
Chart titles now include the name of the economy for better context. For instance, the chart showing the number of developers in Germany is now labeled "Developers // Germany" rather than just "Developers."

Users who spot issues or have suggestions for improvements can open an Issue or start a Discussion in the official repository.
GitHub data also powers other major projects, including the annual Octoverse report, plus the Global Innovation Index and the Network Readiness Index, both of which use GitHub activity as a component metric in their development assessments.


