What FID measures and why it matters
A user's first impression of a site isn't limited to how quickly it paints pixels. Equally important is whether the page responds when the user tries to interact with it. First Input Delay (FID) captures that experience: the time from when a user first clicks a link, taps a button, or operates a JavaScript-powered control until the browser can begin processing the corresponding event handlers.
Target values
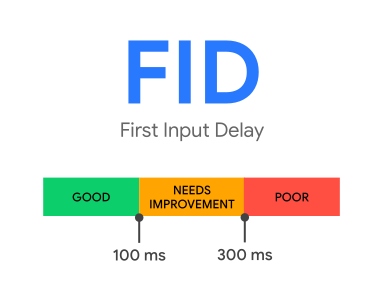
Sites should aim for a First Input Delay of 100 milliseconds or less. The recommended measurement threshold is the 75th percentile of page loads, segmented separately for mobile and desktop.
Why input delays happen
Input latency occurs when the browser's main thread is occupied and cannot respond to the user. A common cause during page load is the browser parsing and executing a large JavaScript file. While that work is in progress, the browser cannot run event listeners, because the code being loaded might instruct it to do something else.
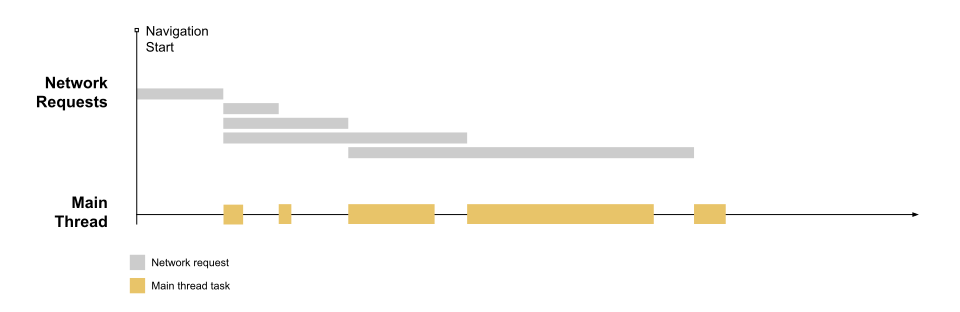
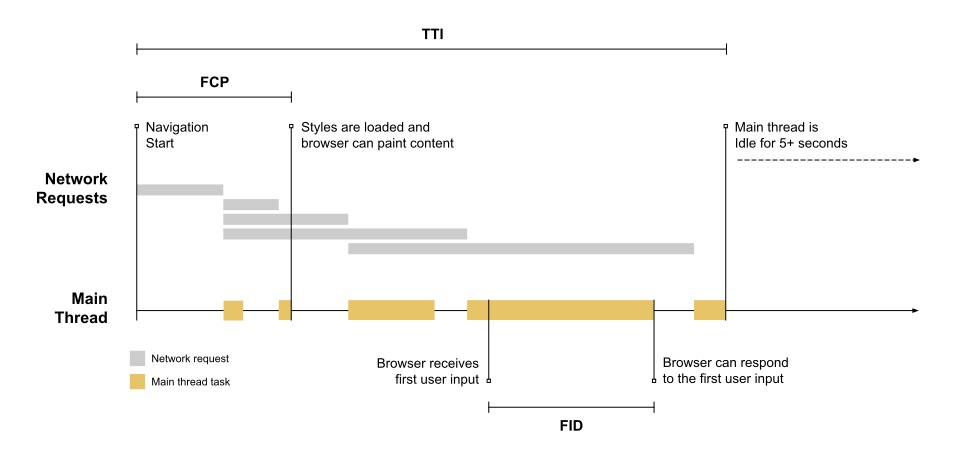
The load timeline below shows network requests for resources (typically CSS and JS files) followed by main-thread processing once those resources finish downloading. The beige-colored task blocks indicate periods when the main thread is busy.
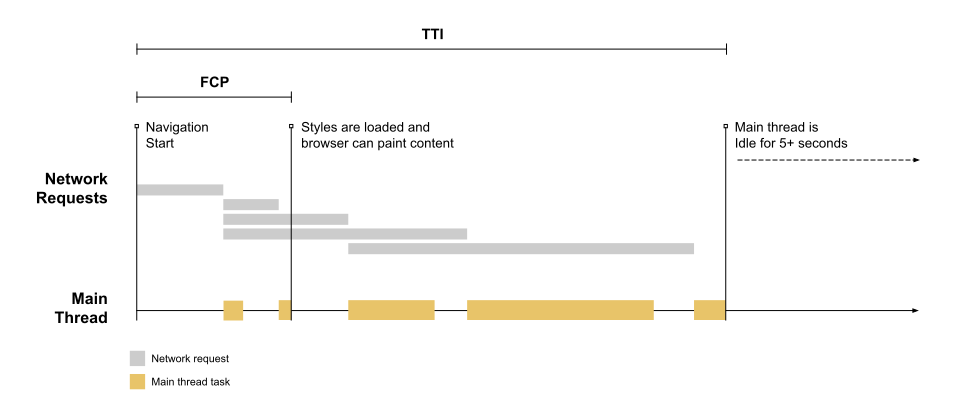
The largest FID values typically occur between First Contentful Paint (FCP) and Time to Interactive (TTI), because the page has rendered some content but is not yet reliably interactive.
If a user attempts to interact near the start of a long task, the input must wait until the task completes. That waiting time is the FID value for that user.
FID applies even without event listeners
FID measures the delta between when an input event is received and when the main thread is next idle, regardless of whether an event listener is registered. Many interactions do not require a listener but still need an idle main thread to respond. Text fields, checkboxes, radio buttons (<input>, <textarea>), select dropdowns (<select>), and links (<a>) all wait for in-progress tasks to complete before responding.
Why only the first input
Focusing on the first input is recommended for three reasons. It forms the user's first impression of responsiveness, which strongly shapes their overall view of site quality. The most significant interactivity issues on the web today occur during page load, so improving first interactions delivers the greatest impact. And the remedies for high FID—code splitting, loading less JavaScript upfront—differ from solutions for slow interactions after load, so separating the metrics allows for more specific guidance.
Which inputs count
FID considers only discrete actions: clicks, taps, and key presses. Continuous interactions such as scrolling and zooming are excluded because they have different performance characteristics and browsers often run them on a separate thread. FID maps to the responsiveness (R) in the RAIL performance model, while scrolling and zooming relate to animation (A) and should be evaluated separately.
Users who never interact
Not every visit includes an interaction, and not all interactions are relevant to FID. Some first inputs occur when the main thread is busy for an extended period; others happen when it is idle. As a result, some users have no FID value, some have low values, and some have high ones. Reporting on FID therefore requires attention to the distribution rather than a single aggregate.
Why only the delay
FID measures only the delay in event processing, not the total event handling duration or the time to update the UI afterward. Including those phases would create an incentive to wrap event logic in asynchronous callbacks via setTimeout() or requestAnimationFrame(), improving the metric while making the experience slower. Developers who need the full event lifecycle can use the Event Timing API.
Measuring FID
FID can only be measured in the field, since it requires a real user to interact with the page. Available tools include the Chrome User Experience Report, PageSpeed Insights, the Search Console Core Web Vitals report, and the web-vitals JavaScript library.
Measuring FID in JavaScript
The Event Timing API provides the underlying data. The following example creates a PerformanceObserver that listens for first-input entries and logs them:
new PerformanceObserver((entryList) => {
  for (const entry of entryList.getEntries()) {
    const delay = entry.processingStart - entry.startTime;
    console.log('FID candidate:', delay, entry);
  }
}).observe({type: 'first-input', buffered: true});
The entry's delay value is the delta between startTime and processingStart. However, not every first-input entry is valid for FID. Several discrepancies exist between the API and the metric:
- Entries for pages loaded in a background tab should be ignored.
- Entries where the page was backgrounded before the first input should be ignored; inputs count only when the page was in the foreground throughout.
- The API does not report entries when the page is restored from the back/forward cache, but FID should still be measured because users experience those restores as distinct visits.
- The API does not report inputs within iframes, though the metric counts them as part of the page experience. Sub-frames can report their
first-inputentries to the parent frame for aggregation.
Reporting on FID data
Given the expected variance in FID values, reports should examine the distribution and emphasize higher percentiles. While the shared Core Web Vitals threshold uses the 75th percentile, FID reporting should focus on the 95th–99th percentiles, which capture the worst first experiences and highlight the areas needing the most improvement. This applies even when reports are segmented by device: the relevant desktop value is the 95th–99th percentile of desktop users, and the mobile value is the 95th–99th percentile of mobile users.
Improving FID
Techniques for optimizing FID are covered in a dedicated guide on improving the metric.
Keeping Track of Metric Changes
Metric definitions and their underlying measurement APIs are not static. Bugs are occasionally found and fixed in the code that captures these signals, and the definitions themselves may be refined over time. These adjustments can surface as unexpected improvements or regressions in your internal dashboards and reports.
To help you understand these fluctuations, a Changelog documents all updates to the implementation or definition of these metrics. Reviewing this log is the best way to trace why a specific number may have shifted after a Chromium update.
If you have direct feedback on the metrics themselves, you can submit it through the web-vitals-feedback Google group.


