
Four Years of GitHub Innovation Graph Data Reveals Developer Seasonal Cycles
The GitHub Innovation Graph has reached a milestone: with the Q4 2023 data release, it now covers four complete years of quarterly metrics across eight dimensions—Git pushes, repositories, developers, organizations, programming languages, licenses, topics, and economy collaborators. Alongside this expanded dataset, GitHub has made several updates in response to community feedback received since the graph's initial launch.
Seasonal Patterns in Developer Activity
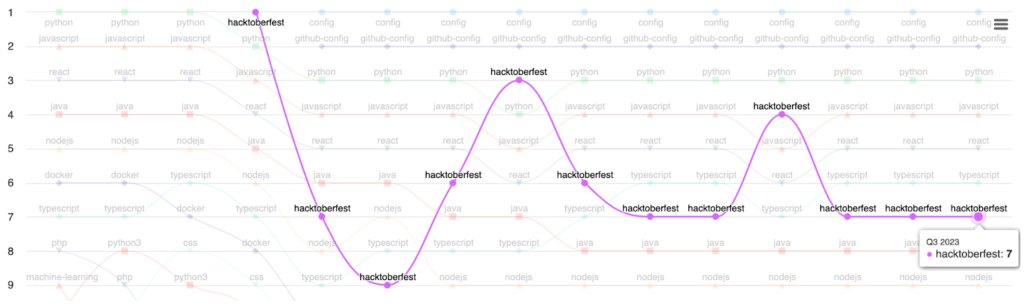
The longer time series illuminates recurring rhythms in developer behavior. The hacktoberfest topic has long demonstrated clear seasonal variation in global topic rankings:
Rank of topics globally
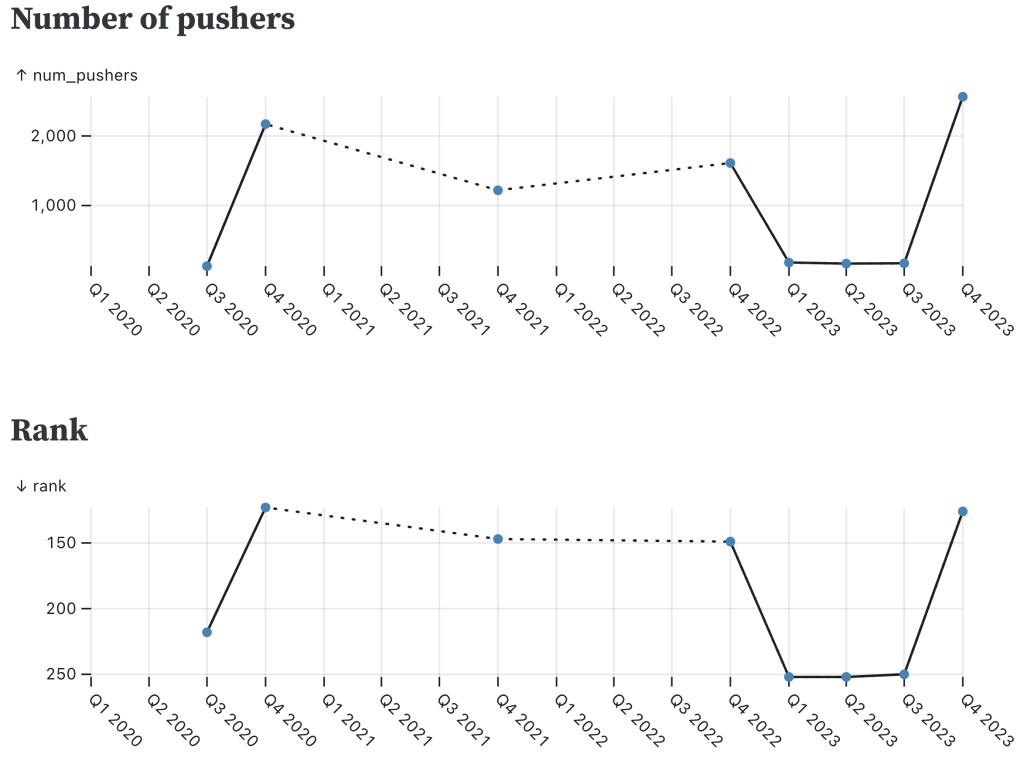
Another cyclical activity with a lower overall profile is Advent of Code, the annual December programming challenge founded by Eric Wastl. Its lower ranking means it doesn't appear in the site's summary charts, so this seasonality only becomes obvious when examining the underlying dataset files directly:
Pushers and rank for the “advent-of-code” topic
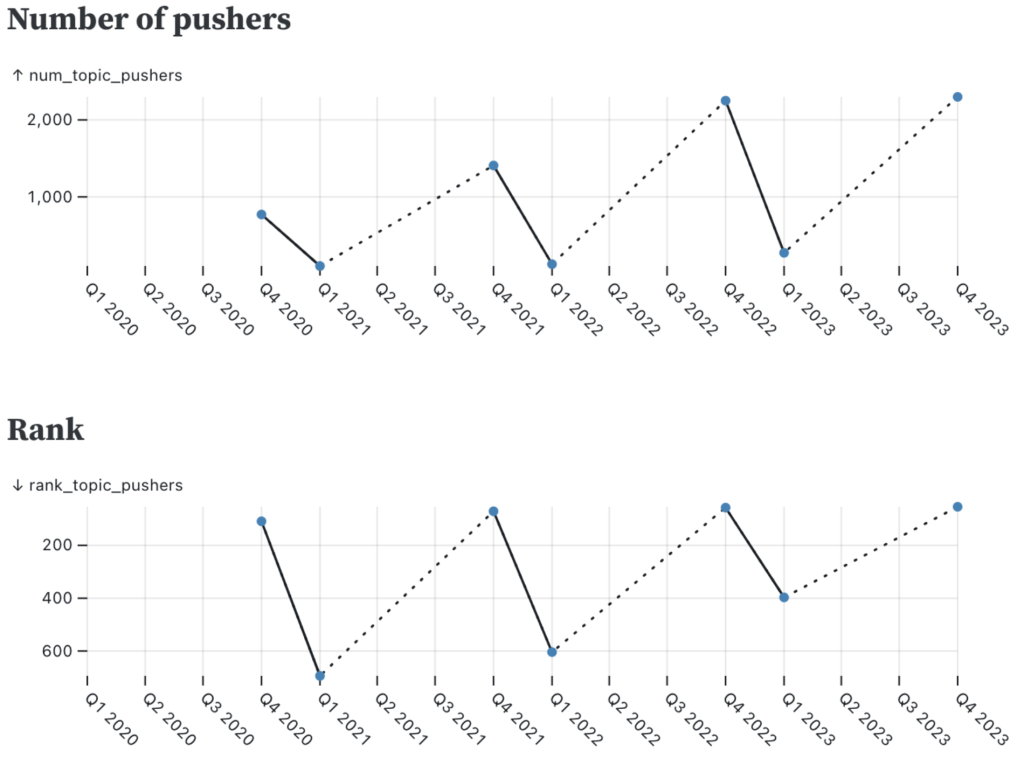
Dotted lines indicate where there are gaps between quarterly data points due to the activity not meeting our minimum threshold for reporting.
The event, which runs from December 1 through December 25, often serves as an opportunity for developers to experiment with less familiar languages—sometimes encouraged by developer advocate programs. This trend appears in the programming languages dataset, with several languages showing notable December spikes, including COBOL (a language that has drawn attention amid concerns about legacy systems maintenance), Julia, ABAP, Elm, Erlang, Processing, Brainf*ck, and LOLCODE:
Pushers and rank for the COBOL programming language

Pushers and rank for the Julia programming language
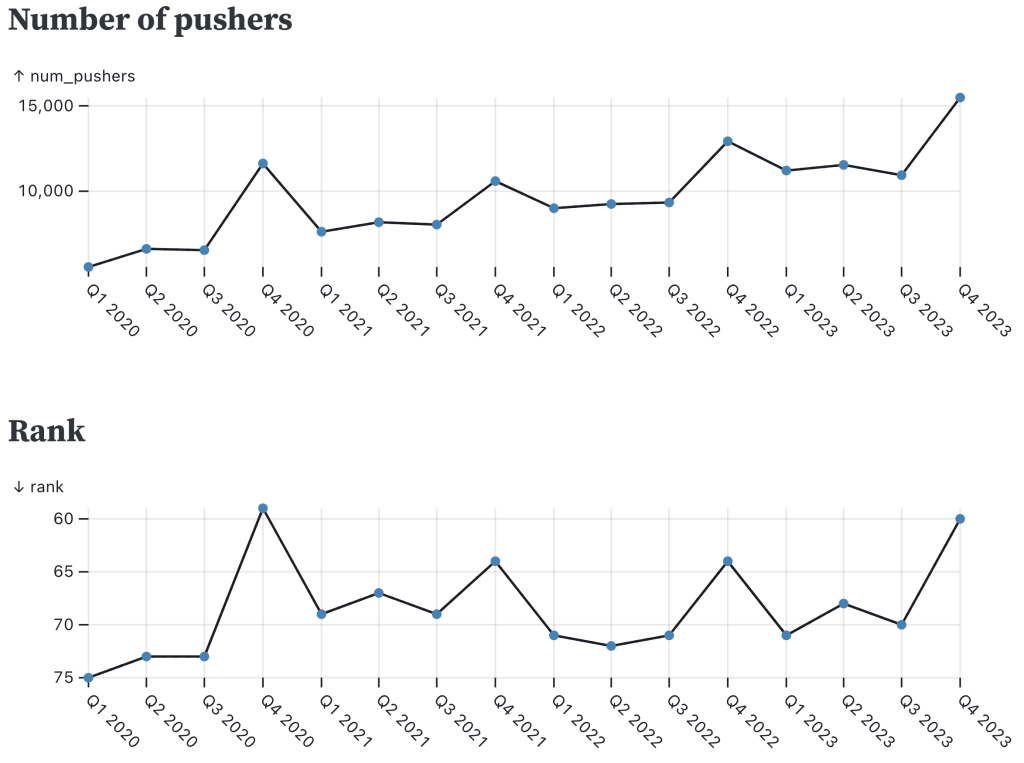
Pushers and rank for the ABAP programming language

Pushers and rank for the Elm programming language
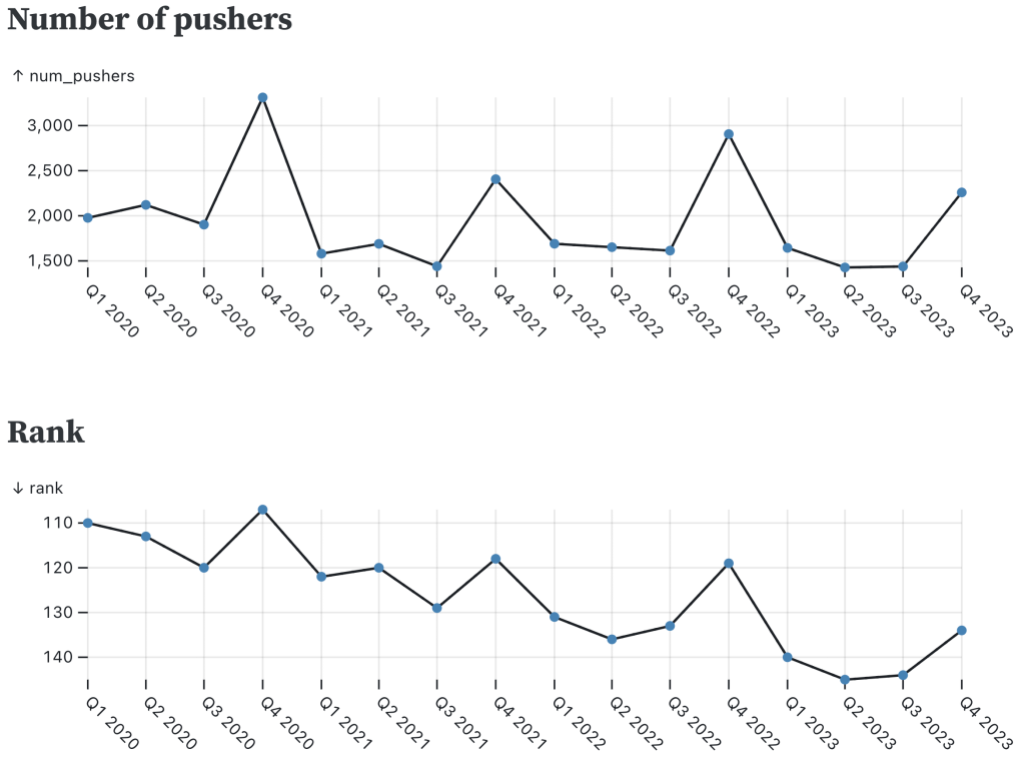
Pushers and rank for the Erlang programming language
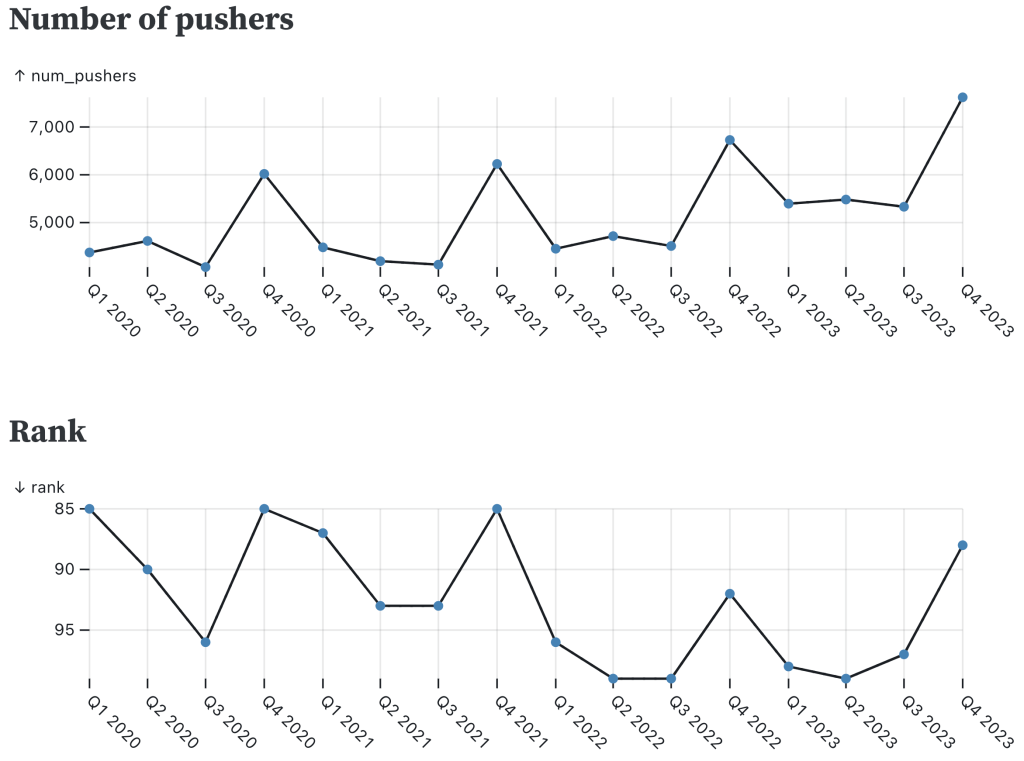
Pushers and rank for the Processing programming language
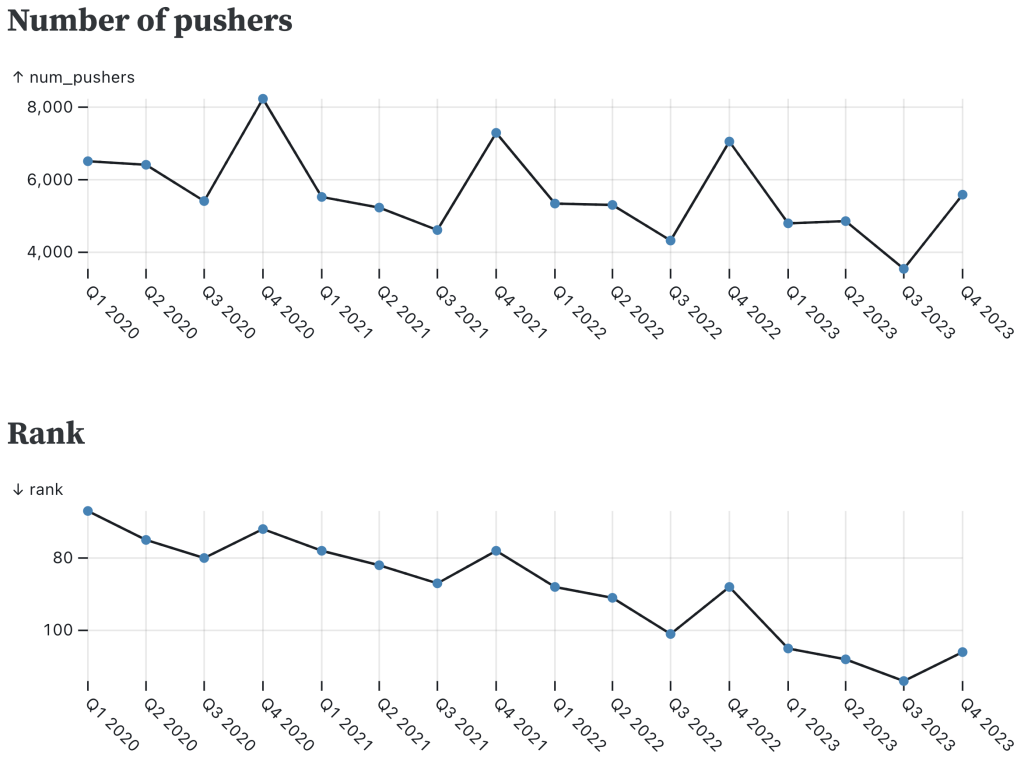
Pushers and rank for the Brainf*ck programming language
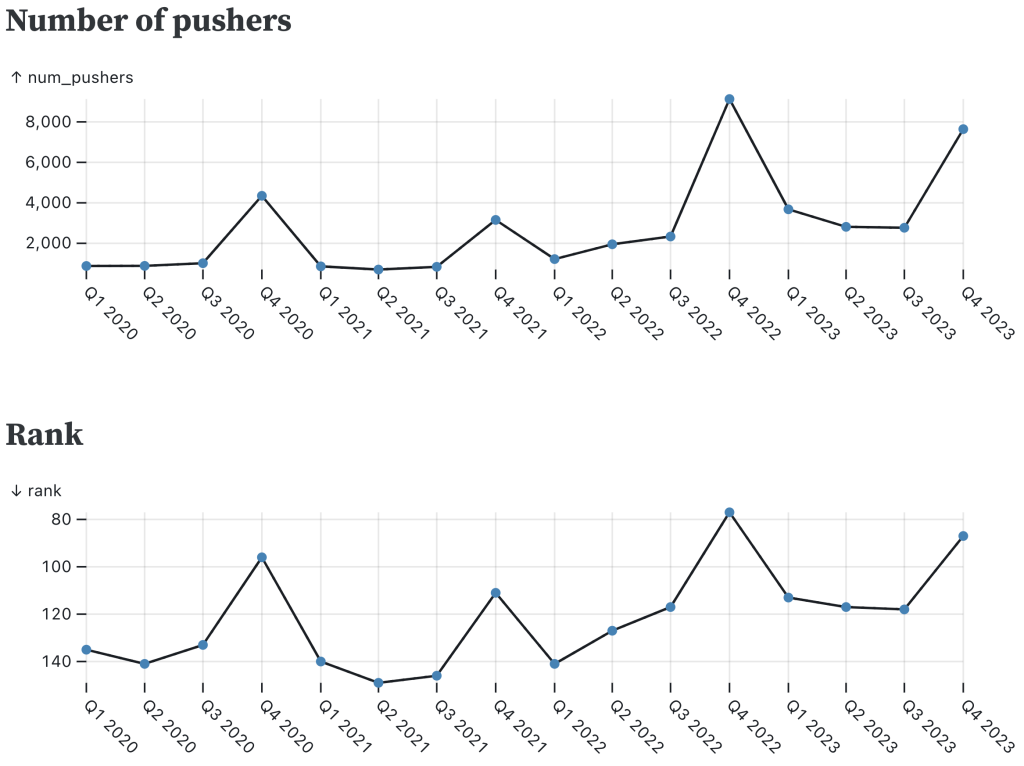
Pushers and rank for LOLCODE programming language
Dotted lines indicate where there are gaps between quarterly data points due to the activity not meeting our minimum threshold for reporting.
Cycles don't always persist, however. The documentation topic shows a notable break in its historical pattern:
Global ranking of the “documentation” topic
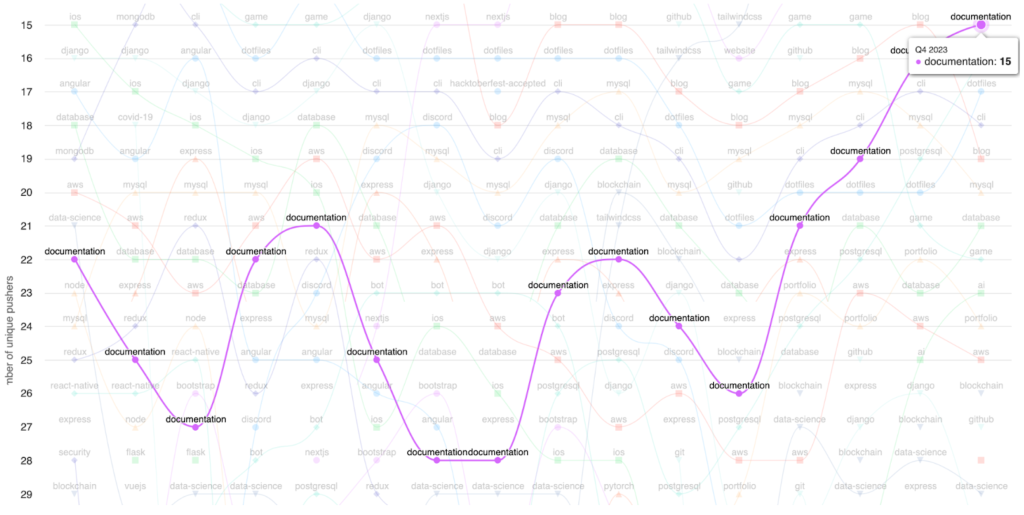
From Q1 2020 through Q4 2022, documentation activity followed a seasonal curve, possibly linked to Google Season of Docs, which has supported open source documentation efforts since at least 2019. But the usual cyclical decline didn't occur in 2023. The timing aligns with the release of chat-based generative AI tools—ChatGPT in November 2022, followed by similar products like GitHub Copilot Chat in March 2023. It's plausible these tools are reducing friction around documentation writing, encouraging more consistent and widespread updates to project docs.
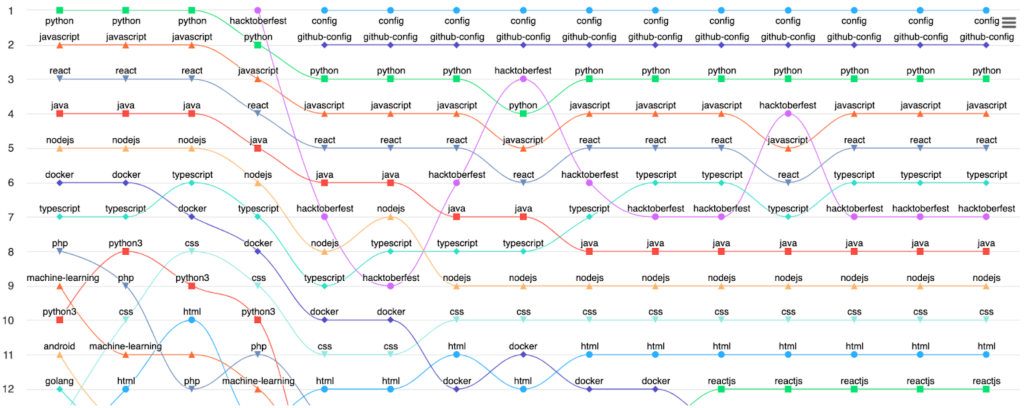
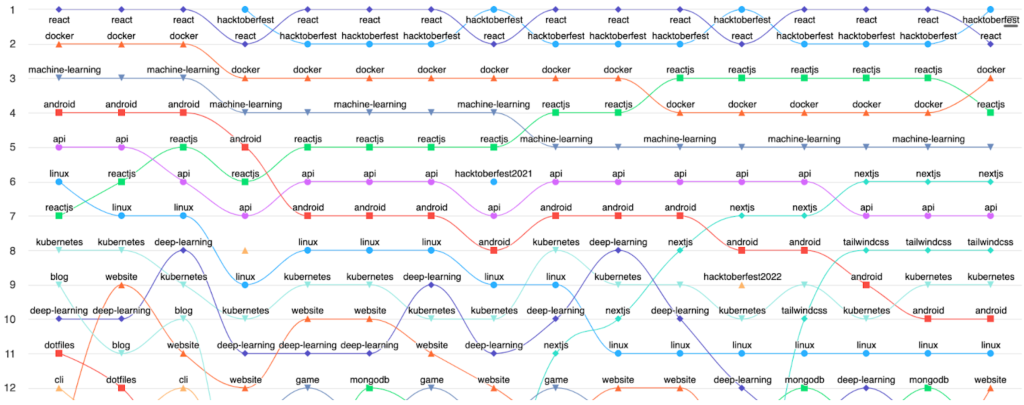
Topic Charts Exclude Programming Languages and Profile Config Topics
The Topics bump charts—available on the global metrics page and individual economy pages—now exclude programming languages and topics related to GitHub profile README configuration (config and github-config). Programming language topics were indirectly duplicated in these charts, given the existence of dedicated Programming Languages bump charts. Their presence consumed so much visual space that other topic movements—like the advent-of-code topic's seasonality—were difficult to notice. Profile README configuration topics, meanwhile, were likely of interest primarily to the GitHub teams responsible for that feature.
Before:
After:
License Chart Label Clarification
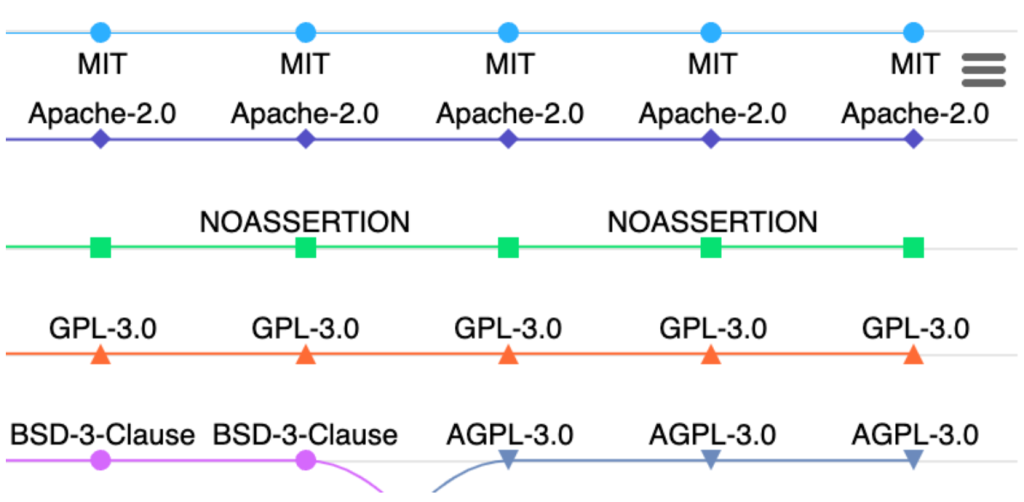
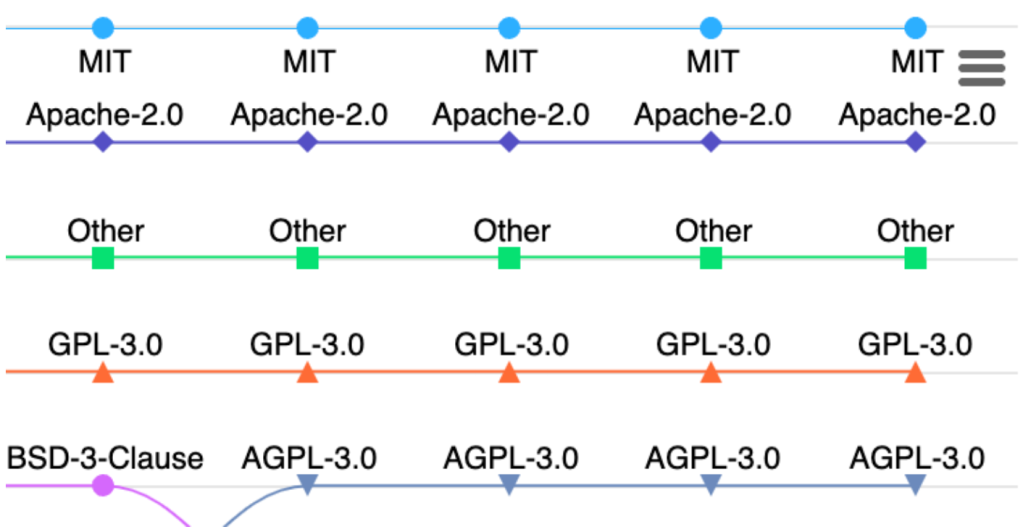
Following community feedback about the confusing NOASSERTION classification, the Licenses bump charts now display "Other" instead of that term.
Before:
After:
Metric Definitions Clarified for Counts
Explanatory notes have been added to the repositories, developers, and organizations metrics to clarify that these counts include inactive entities—they are not limited to, for instance, users who were active during a given quarter.
With four years of data now available across the dataset files, there's ample material for further analysis. Developers can explore the data using a Jupyter Notebook via GitHub Codespaces, Microsoft 365 Copilot in Excel, or any of the open source data analysis tools available.


