
Finding and fixing layout shifts
Layout shifts occur when a visible element changes its position or size after the page has rendered. Identifying them requires understanding what moves, when it moves, and which element caused the movement. This guide covers the debugging tools available and a practical approach for tracing shifts back to their root causes.
Tools for measuring layout instability
All layout shift tooling ultimately relies on the Layout Instability API, the browser's mechanism for measuring and reporting these events. The API's flexibility makes it a powerful debugging instrument, while higher-level tools such as DevTools present its data in a more digestible form.
Using the Layout Instability API
The same code snippet used to measure Cumulative Layout Shift (CLS) can log detailed information about each shift. The script below reports layout shifts to the console, giving you visibility into when, where, and how shifts occurred:
let cls = 0;
new PerformanceObserver((entryList) => {
  for (const entry of entryList.getEntries()) {
    if (!entry.hadRecentInput) {
      cls += entry.value;
      console.log('Current CLS value:', cls, entry);
    }
  }
}).observe({type: 'layout-shift', buffered: true});
When running this script, a few considerations apply:
- The
buffered: trueoption instructs thePerformanceObserverto check the browser's performance entry buffer for entries created before the observer was initialized. Consequently, the observer reports shifts that happened both before and after initialization. An initial burst of entries can simply reflect this backlog rather than a sudden onset of shifts. - The
PerformanceObserverwaits for the main thread to be idle before reporting shifts. Depending on thread activity, there may be a slight delay between a shift and its console log. - The script filters out shifts occurring within 500 ms of user input, since those don't count toward CLS.
Shift data is exposed through two interfaces: LayoutShift for individual shift events and LayoutShiftAttribution for the movements of individual elements within a shift.
Reading LayoutShift entries
Each layout shift event is represented by a LayoutShift entry. Its most useful properties for debugging are:
| Property | Description |
|---|---|
sources |
The sources property lists the DOM elements that moved during the layout shift. This array can contain up to five sources. In the event that there are more than five elements impacted by the layout shift, the five largest (as measured by impact on layout stability) sources of layout shift are reported. This information is reported using the LayoutShiftAttribution interface (explained in more detail below). |
value |
The value property reports the layout shift score for a particular layout shift. |
hadRecentInput |
The hadRecentInput property indicates whether a layout shift occurred within 500 milliseconds of user input. |
startTime |
The startTime property indicates when a layout shift occurred. startTime is indicated in milliseconds and is measured relative to the time that the page load was initiated. |
duration |
The duration property will always be set to 0. This property is inherited from the PerformanceEntry interface (the LayoutShift interface extends the PerformanceEntry interface). However, the concept of duration does not apply to layout shift events, so it is set to 0. For information on the PerformanceEntry interface, refer to the spec. |
For example, an entry indicating a shift score of 0.175 might correspond to three DOM elements changing position simultaneously:
duration: 0
entryType: "layout-shift"
hadRecentInput: false
lastInputTime: 0
name: ""
sources: (3) [LayoutShiftAttribution, LayoutShiftAttribution, LayoutShiftAttribution]
startTime: 11317.934999999125
value: 0.17508567530168798
Reading LayoutShiftAttribution entries
When a shift involves multiple elements, the sources property contains a separate LayoutShiftAttribution entry for each one. These entries describe the node that moved, along with its previous and current rectangles:
// ...
  "sources": [
    {
      "node": "div#banner",
      "previousRect": {
        "x": 311,
        "y": 76,
        "width": 4,
        "height": 18,
        "top": 76,
        "right": 315,
        "bottom": 94,
        "left": 311
      },
      "currentRect": {
        "x": 311,
        "y": 246,
        "width": 4,
        "height": 18,
        "top": 246,
        "right": 315,
        "bottom": 264,
        "left": 311
      }
    }
  ]
The previousRect and currentRect properties report the size and position of the node. The x and y coordinates describe the top-left corner; width and height give the dimensions. The top, right, bottom, and left values are the edge coordinates, so top equals y and bottom equals y + height.
If all properties of previousRect are zero, the element shifted into view. If all properties of currentRect are zero, it shifted out of view.
A key point when interpreting this output: the elements listed as sources are the ones that moved, but they are not necessarily the root cause. The source elements may be only indirectly related to the underlying instability. A shift reported with one source (element B) could have been set off by a size change on element A. Another shift might list elements A and B as sources because element A's position change pushed B down. In a third case, moving element B directly shifts it. A fourth case shows that an element changing size does not always produce a layout shift if nothing else moves.
A live demo of how DOM changes are reported by the Layout Instability API helps illustrate these patterns.
DevTools debugging features
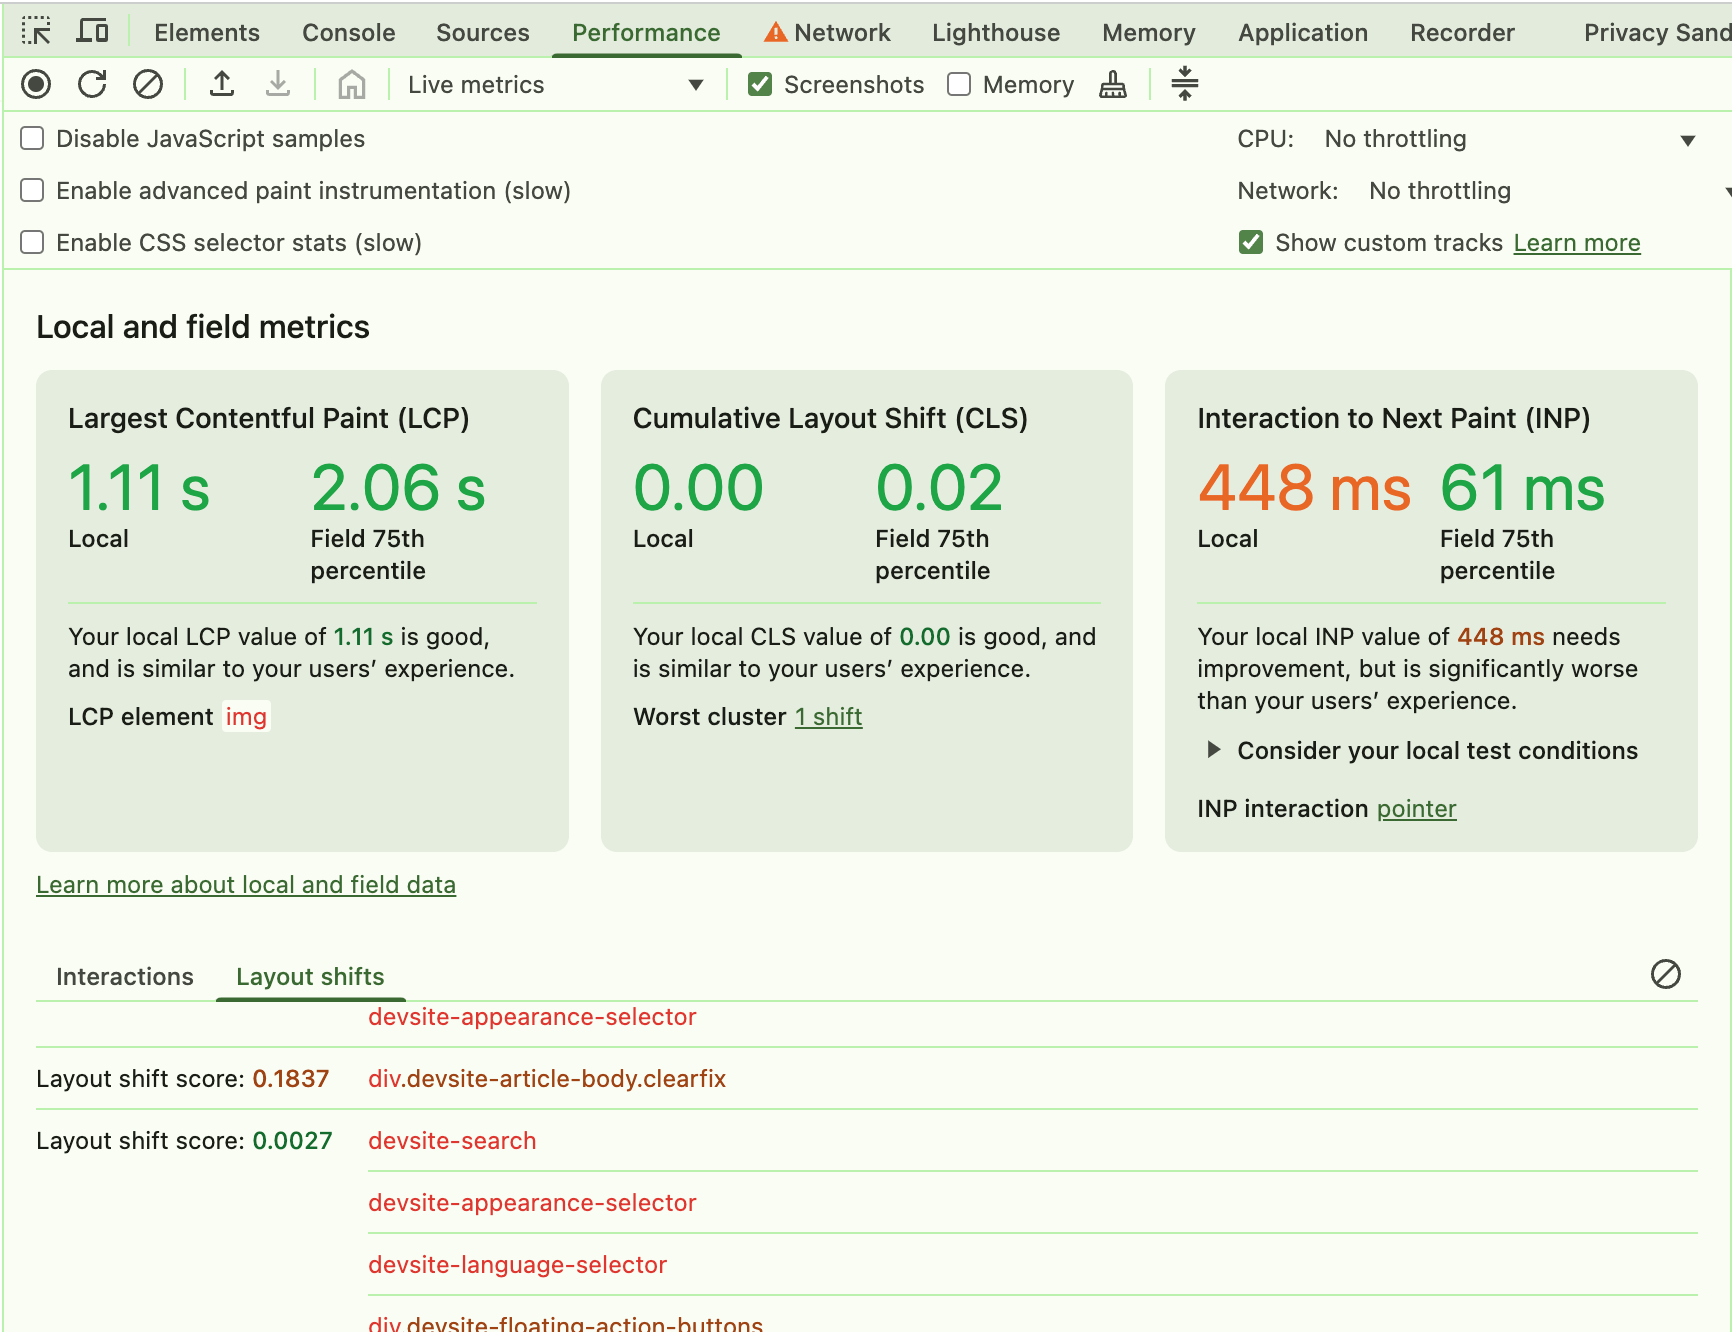
The live metrics view in the Performance panel lets you interact with a page and monitor its CLS score in real time, helping you spot which interactions cause large shifts:
Once you can reliably reproduce a shift, record a performance trace for more detail:
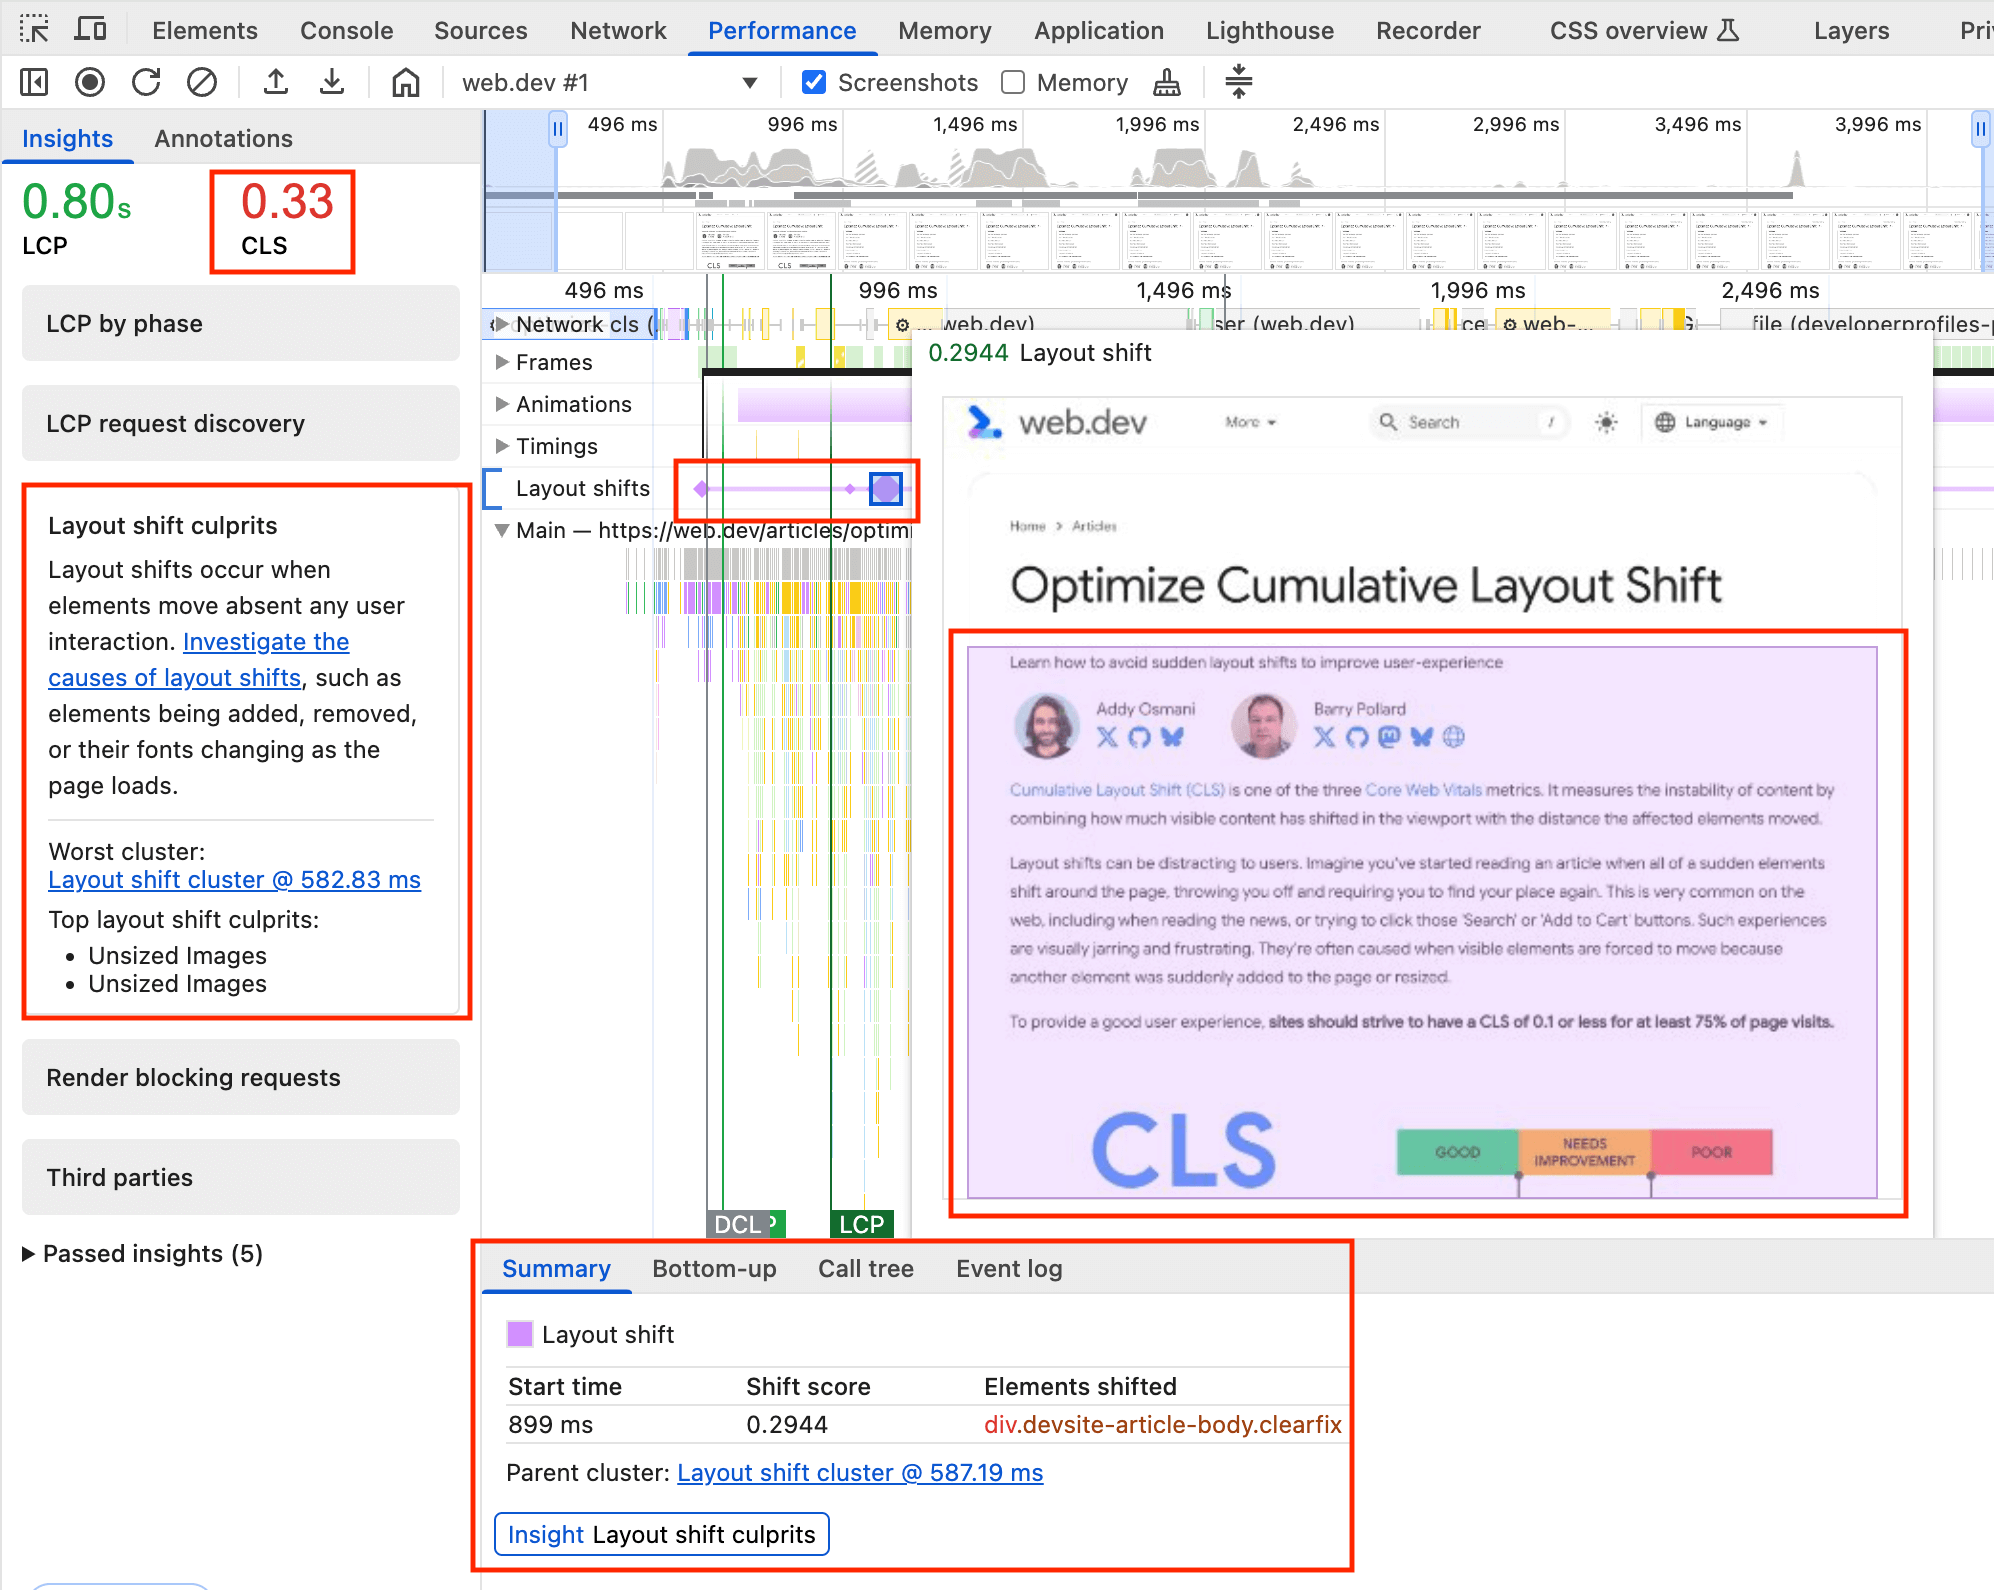
Layout Shift clusters. Clicking the diamonds shows an animation of the shift and details in the Summary panel.
Shifts appear in the Layout shifts track. Purple lines group shifts into clusters, with diamonds marking individual shifts. The diamond's size is proportional to the shift's magnitude, letting you quickly find the worst offenders. Clicking a shift shows an animation of the movement and highlights the shifted elements in purple.
The Summary view for a Layout Shift record includes the start time, shift score, and the elements that moved. For load-time shifts, which are easy to replicate with a reload profile, this view is especially useful. It also links to the Layout shift culprits insight in the Insights panel, which shows the total CLS and possible causes.
For a quick visual scan, enable Settings > More Tools > Rendering > Layout Shift Regions, then refresh the page. Areas that shift will flash purple briefly, giving you an at-a-glance sense of where and when instability occurs.
Tracing shifts to their source
To identify the element causing a shift, start with the insight that layout shifts come from one of four events:
- Changes to the position of a DOM element
- Changes to the dimensions of a DOM element
- Insertion or removal of a DOM element
- Animations that trigger layout
The DOM element immediately preceding the shifted element is the most likely culprit. Investigate whether its position or dimensions changed, whether an element was inserted or removed before the one that moved, or whether the shifted element's own position was explicitly changed. If the immediate predecessor is blameless, work backward through nearby elements.
The direction and distance of a shift offer clues. A large downward shift often signals a DOM insertion above. A tiny 1–2 px shift frequently points to conflicting CSS rules or a web font loading and applying after render.
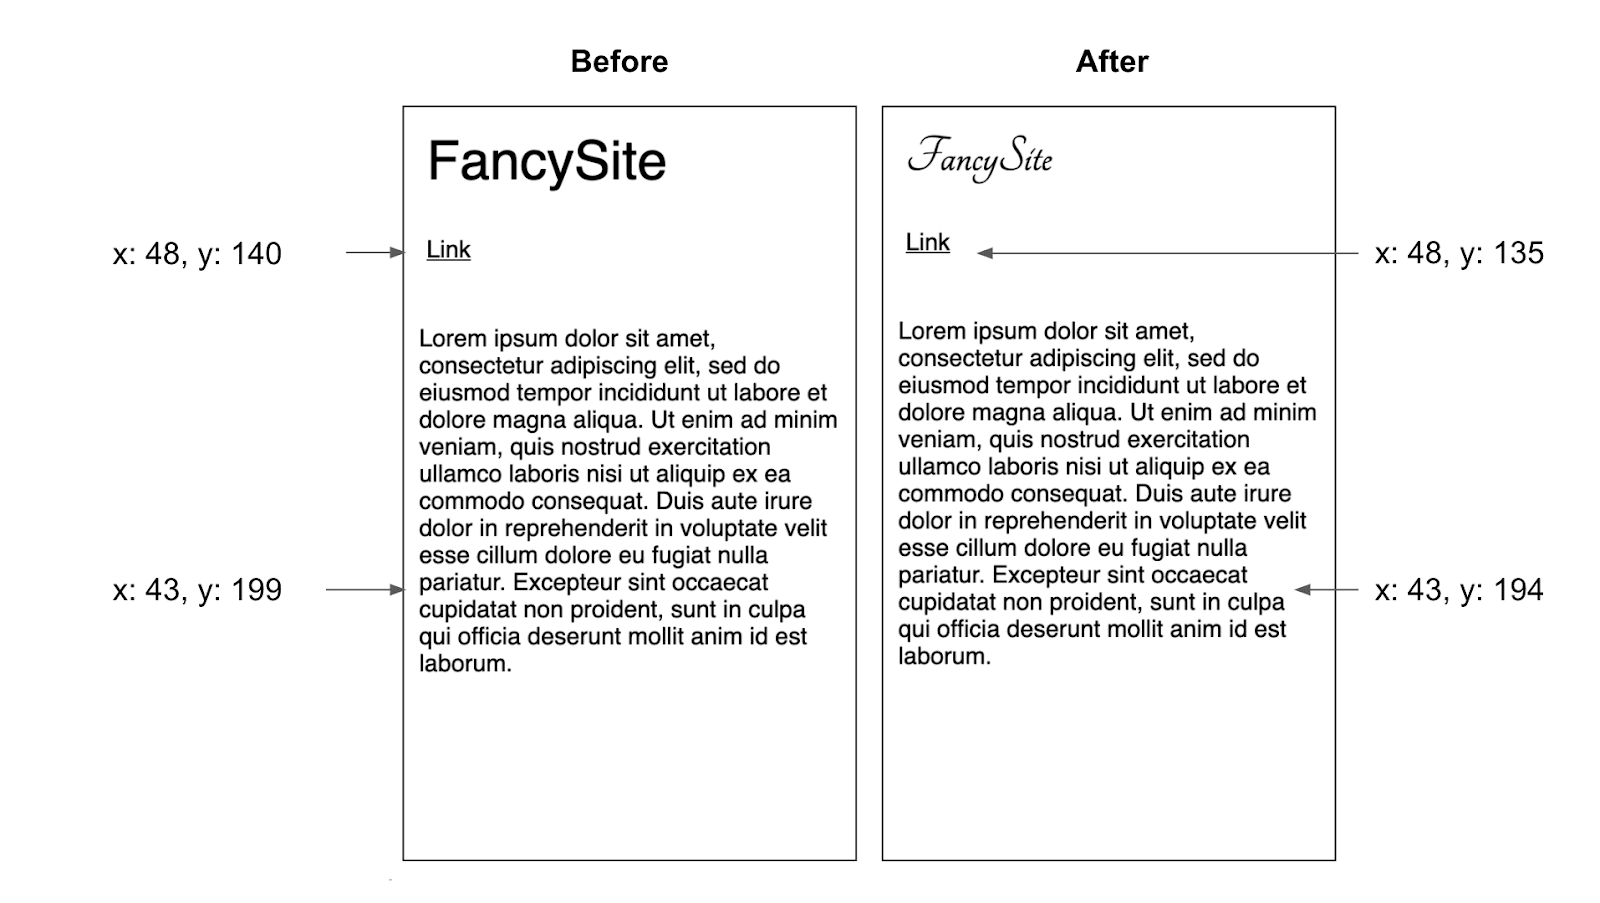
In practice, these common behaviors cause the bulk of layout shift events:
Element position changes
When an element's position shifts without another element moving it, the cause is usually a stylesheet that loads late or overwrites existing styles, or an animation or transition effect altering its position.
Element dimension changes
Size-related shifts commonly trace back to:
- Stylesheets that load late or override declared styles.
- Images and iframes lacking
widthandheightattributes that load after their slot has rendered. - Text blocks that swap fonts after text is painted, changing line metrics.
Element insertion or removal
These shifts are typically caused by content arriving after the initial render:
- Ads and third-party embeds.
- Banners, alerts, and modals.
- UX patterns like infinite scroll that inject content above existing items.
Layout-triggering animations
Animating elements by incrementing properties like top or left forces layout on every frame. Using CSS transform avoids this, as discussed in the guide to high-performance CSS animations.
Reproducing unpredictable shifts
A shift you cannot reproduce cannot be fixed. Spend 5–10 minutes actively interacting with your site while the Layout Instability API script logs to the console. For stubborn issues, vary the device and connection speed. A slower connection makes shifts more visible and easier to diagnose.
When you need to step through a specific shift, a debugger statement can pause execution at the right moment:
new PerformanceObserver((entryList) => {
  for (const entry of entryList.getEntries()) {
    if (!entry.hadRecentInput) {
      cls += entry.value;
      debugger;
      console.log('Current CLS value:', cls, entry);
    }
  }
}).observe({type: 'layout-shift', buffered: true});
Lighthouse can supplement this process, but note that it only sees shifts that occur during initial page load and can only offer suggestions for a subset of causes, such as images without explicit dimensions.


