
Debugging canvas work with the Canvas Profiler
Anyone who has spent time debugging code that draws to a <canvas> element knows how opaque that process can be. Whether you're working with a 2D or WebGL context, canvas work typically boils down to a long sequence of calls that are hard to trace once something goes wrong:
function draw() {

  context.clearRect(0, 0, 258, 258);
  context.fillStyle = "#EEEEEE";
  context.beginPath();
  context.arc(129, 129, 127, 0, 6.28, true);
  context.closePath();
  context.fill();

  // … and on and on
}
To make this easier, Chrome DevTools offers a Canvas Profiler that lets you capture and step through the exact instructions sent to a canvas context. It works with both 2D and WebGL contexts, so you can inspect draw calls regardless of which API your application uses.
Enabling the profiler
The Canvas Profiler is an experimental feature, so you need to enable it before it appears in DevTools. Start by navigating to about:flags in Chrome and turning on "Enable Developer Tools experiments":

Next, open DevTools and select the cog  in the lower right corner. Go to Experiments and enable Canvas inspection:
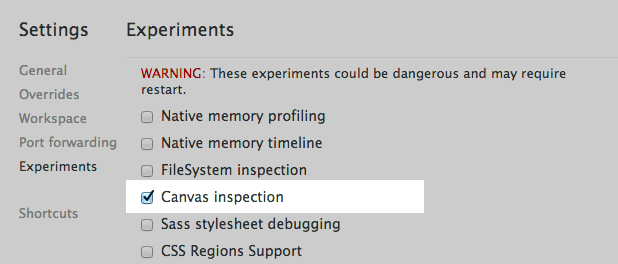
You'll need to close and reopen DevTools for the change to take effect; Alt+R or Option+R provides a quick shortcut. When DevTools reopens, the Profiles section will include a new Canvas Profiler option. It starts disabled. Once your page contains a canvas you want to debug, press Enable and the page will reload, ready to capture <canvas> calls:
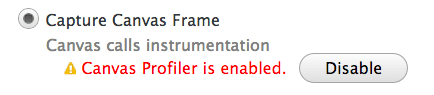
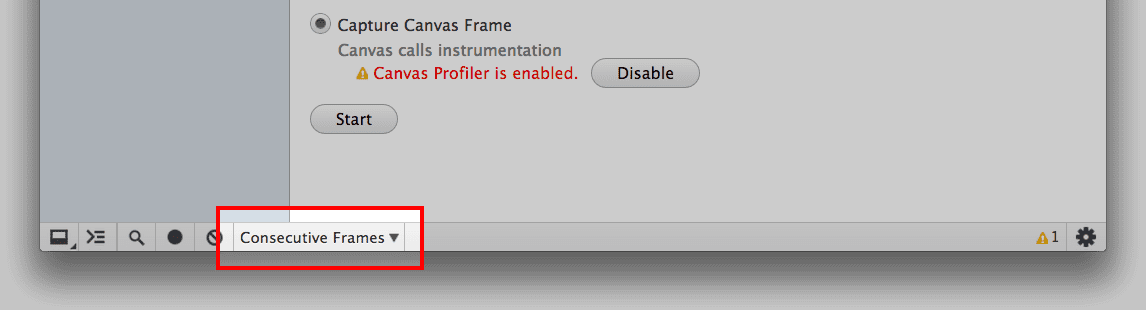
You are then asked to choose between capturing a single frame or consecutive frames—a frame being the same unit you would see in the DevTools Timeline. Single frame records calls until the current frame ends and then stops. Consecutive frames captures every frame from all <canvas> elements until you stop it. The right choice depends on your usage: for an ongoing animation, a single frame is usually sufficient; for a brief animation triggered by a user event, consecutive frames will give you more context.
Capturing and stepping through frames
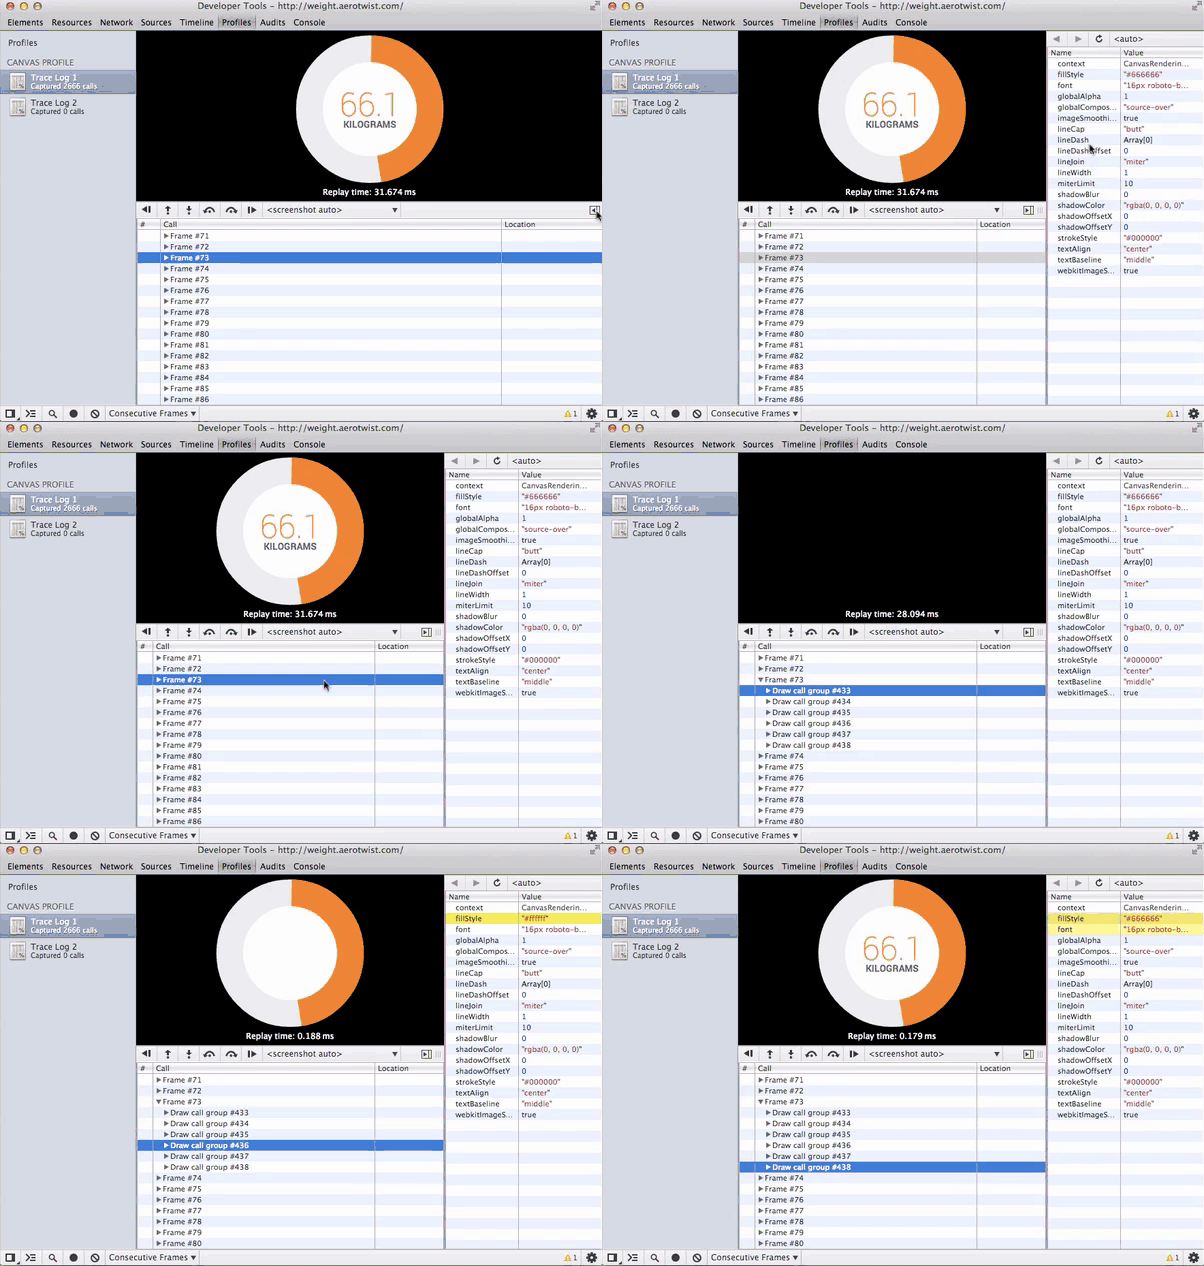
With the profiler enabled, press Start and interact with your application normally. When you're done capturing consecutively, press Stop. A new profile appears in the left-hand list, showing the total number of context calls captured across all <canvas> elements. Clicking the profile opens a view like this:
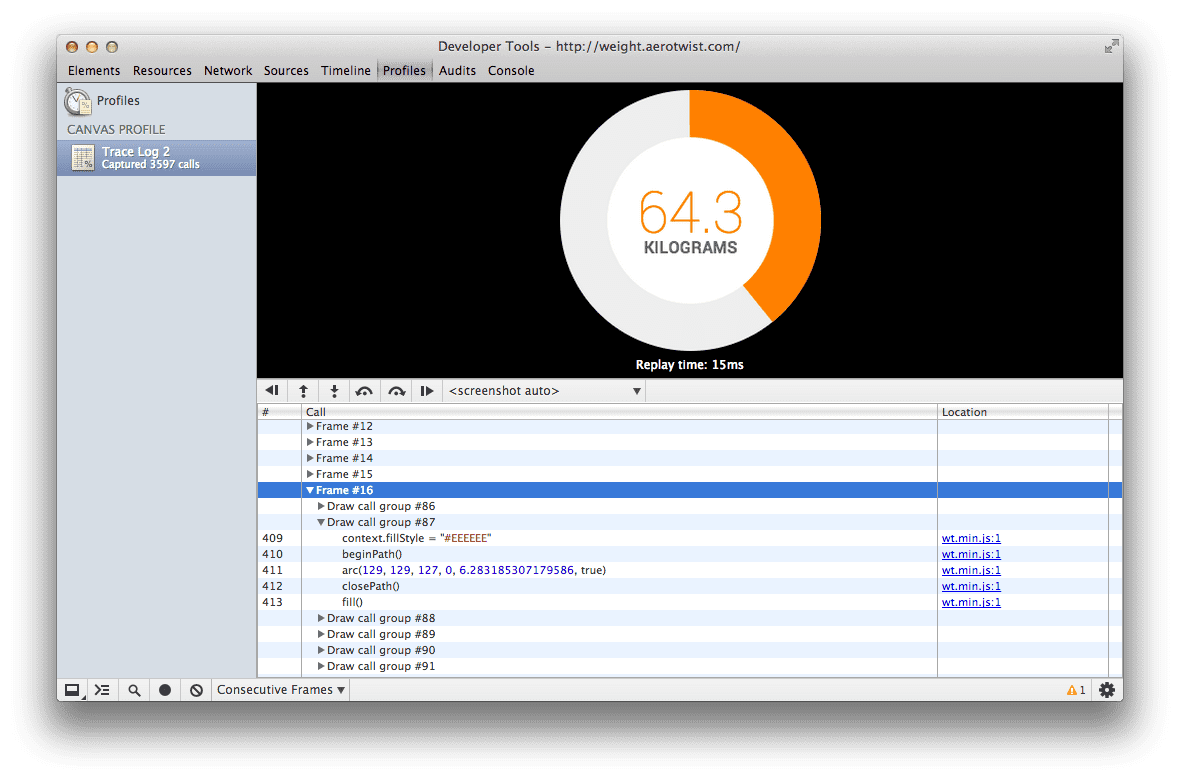
The lower pane lists all captured frames, and clicking each one updates the screenshot above to show the canvas element's state at the end of that frame. When multiple canvas elements are present, use the menu below the screenshot to switch between them.
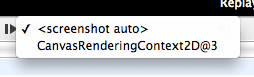
Within each frame, draw calls are grouped together; each group ends with a single draw call, which is the operation that actually alters the visible drawing buffer. In a 2D context that includes functions such as clearRect(), drawImage(), fill(), stroke(), putImageData(), and text rendering functions. For WebGL, draw calls are clear(), drawArrays(), and drawElements(). Essentially, anything that would change the current drawing buffer's contents—a bitmap whose pixels you are manipulating—counts as a draw call.
You can step through the recorded sequence at the frame, draw call group, or individual call level. Buttons below the screenshot provide quick navigation, and at every step you see the canvas context at that moment, which makes it straightforward to pinpoint where a rendering bug comes from.

Comparing property changes
The profiler also lets you compare which properties and variables change between two calls. Click the sidebar button  to reveal the comparison view. As you step through draw calls, updated properties are highlighted, and any buffers or arrays can be inspected by hovering over them.
If you encounter issues with the Canvas Profiler or have suggestions for additional inspection features, file a bug or post to the Chrome DevTools discussion group. Feedback from real-world usage is what drives improvements to these tools.


