

Lighthouse audits can be driven from the command line rather than through DevTools, which makes it possible to capture reports on a schedule and compare them over time. The tool built here wraps the Lighthouse Node module in a small script that opens Chrome, runs an audit, and writes each report to a timestamped JSON file.
What Lighthouse produces
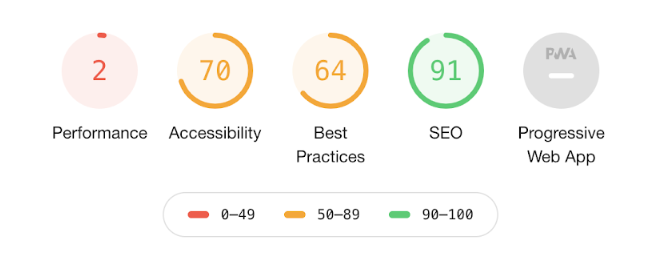
Lighthouse scores a page across Performance, Accessibility, Best Practices, SEO and Progressive Web App, aggregating each category into a color-coded 0-100 score alongside other diagnostics and performance metrics. The aggregate makes results legible to people who would not otherwise read a First Contentful Paint or Speed Index figure — useful when the audience is a stakeholder rather than a developer.
Chrome and the latest Edge run audits from DevTools, and PageSpeed Insights and WebPageTest offer hosted alternatives, but the remainder of this build uses only the Node module, since the goal is to audit, record and compare programmatically.
Prerequisites and project skeleton
You need Node.js — the tutorial targets v10.17.0, though most recent versions should work — plus Chrome installed, since Chrome is what actually runs the audit. Create a project directory, cd into it, and run npm init, accepting the defaults. Add a file such as lh.js, put a console.log in it, and confirm it executes with node lh.js.
console.log('Hello world');$ node lh.js
Hello worldLaunching Chrome from Node
Install Lighthouse as the first dependency:
npm install lighthouse --save-devThis populates node_modules, which belongs in .gitignore. Replace the test log with imports for Lighthouse and for chrome-launcher, a Lighthouse dependency that lets Node start Chrome itself.
const lighthouse = require('lighthouse');const lighthouse = require('lighthouse');
const chromeLauncher = require('chrome-launcher');ES6 syntax is safe here because the script runs under Node. Write a function taking a url parameter and call the launcher's launch() method with the startingUrl option; invoking the function opens Chrome at that address.
const launchChrome = (url) => {
}const launchChrome = url => {
chromeLauncher.launch({
startingUrl: url
});
};launchChrome('https://www.lukeharrison.dev');launch() returns a promise resolving to an object with useful methods and properties. For instance, you can log that object and then close the browser three seconds later with kill().
const launchChrome = url => {
chromeLauncher
.launch({
startingUrl: url
})
.then(chrome => {
console.log(chrome);
setTimeout(() => chrome.kill(), 3000);
});
};
launchChrome("https://www.lukeharrison.dev");Wiring in the audit
Rename the function to launchChromeAndRunLighthouse(). Inside the launcher's then callback, which runs only once the browser is open, pass the url to Lighthouse to trigger the audit; the instance must be linked to the open browser by passing its port alongside the URL.
const launchChromeAndRunLighthouse = url => {
chromeLauncher
.launch({
startingUrl: url
})
.then(chrome => {
const opts = {
port: chrome.port
};
lighthouse(url, opts);
});
};
launchChromeAndRunLighthouse("https://www.lukeharrison.dev");Run that and the console reports an error.
(node:47714) UnhandledPromiseRejectionWarning: Error: You probably have multiple tabs open to the same origin.The fix is to drop the startingUrl option entirely and let Lighthouse handle navigation.
const launchChromeAndRunLighthouse = url => {
chromeLauncher.launch().then(chrome => {
const opts = {
port: chrome.port
};
lighthouse(url, opts);
});
};After that change the script visibly does something, but nothing confirms the audit ran and Chrome no longer closes itself. The lighthouse() function returns a promise, so kill Chrome and print the results as JSON via the report property of the results object.
const launchChromeAndRunLighthouse = url => {
chromeLauncher.launch().then(chrome => {
const opts = {
port: chrome.port
};
lighthouse(url, opts).then(results => {
chrome.kill();
console.log(results.report);
});
});
};Pasting that output into the Lighthouse Report Viewer renders the full report. Tidy the function so it returns the report once finished, which keeps later processing out of a pyramid of nested callbacks.
const lighthouse = require("lighthouse");
const chromeLauncher = require("chrome-launcher");
const launchChromeAndRunLighthouse = url => {
return chromeLauncher.launch().then(chrome => {
const opts = {
port: chrome.port
};
return lighthouse(url, opts).then(results => {
return chrome.kill().then(() => results.report);
});
});
};
launchChromeAndRunLighthouse("https://www.lukeharrison.dev").then(results => {
console.log(results);
});Taking the URL from the command line
One URL at a time is limiting, so accept the target as an argument. The yargs package handles the parsing.
npm install --save-dev yargsImport only its argv function, alongside Chrome Launcher and Lighthouse.
const lighthouse = require('lighthouse');
const chromeLauncher = require('chrome-launcher');
const argv = require('yargs').argv;node lh.js --url https://www.google.co.ukconst url = argv.url // https://www.google.co.ukFeed the argument into the function's url parameter, guarding against a missing argument with an if statement and an error message.
if (argv.url) {
launchChromeAndRunLighthouse(argv.url).then(results => {
console.log(results);
});
} else {
throw "You haven't passed a URL to Lighthouse";
}The result launches Chrome, runs a Lighthouse audit and prints the JSON report to the terminal.
Persisting reports to disk
Console output is hard to read and leaves nothing behind. Each report should go into its own JSON file, grouped by site and named with a timestamp so names never collide and reports are easy to tell apart: each first-level directory is a hostname (such as lukeharrison.dev or cnn.com) holding files like 2020-01-31T18:18:12.648Z.json. Windows rejects the colon as a filename character, so each colon becomes an underscore, giving names such as 2020-01-31T18_18_12.648Z.json.
Deriving the directory name
The directory name comes from the URL argument, and it has to handle pages below the root too: auditing https://www.foo.com/bar should not break on slashes, which are invalid in directory names. Those characters become underscores, yielding foo.com_bar. Node's native url module helps here; it needs no entry in package.json or npm install.
const lighthouse = require('lighthouse');
const chromeLauncher = require('chrome-launcher');
const argv = require('yargs').argv;
const url = require('url');Instantiate a URL object from it. Logging the object reveals the parsed fields available for use.
if (argv.url) {
const urlObj = new URL(argv.url);
launchChromeAndRunLighthouse(argv.url).then(results => {
console.log(results);
});
}$ node lh.js --url https://www.foo.com/bar
URL {
href: 'https://www.foo.com/bar',
origin: 'https://www.foo.com',
protocol: 'https:',
username: '',
password: '',
host: 'www.foo.com',
hostname: 'www.foo.com',
port: '',
pathname: '/bar',
search: '',
searchParams: URLSearchParams {},
hash: ''
}Declare a dirName variable and apply replace() to the URL's host property to strip www (and the https protocol). let rather than const is needed because the value is reassigned when the URL carries a pathname; a regular expression swaps the slashes for underscores.
const urlObj = new URL(argv.url);
let dirName = urlObj.host.replace('www.','');const urlObj = new URL(argv.url);
let dirName = urlObj.host.replace("www.", "");
if (urlObj.pathname !== "/") {
dirName = dirName + urlObj.pathname.replace(/\//g, "_");
}Creating the folder
The native fs module creates the directory. Its mkdir() method must be preceded by a check with existsSync(), since Node throws if the directory is already there.
const lighthouse = require('lighthouse');
const chromeLauncher = require('chrome-launcher');
const argv = require('yargs').argv;
const url = require('url');
const fs = require('fs');const urlObj = new URL(argv.url);
let dirName = urlObj.host.replace("www.", "");
if (urlObj.pathname !== "/") {
dirName = dirName + urlObj.pathname.replace(/\//g, "_");
}
if (!fs.existsSync(dirName)) {
fs.mkdirSync(dirName);
}Running the script at this point produces a directory: passing https://www.bbc.co.uk/news as the argument creates bbc.co.uk_news.
Writing each audit to disk
Inside the then callback of launchChromeAndRunLighthouse(), the previous console.log is replaced with a call to writeFile() from the native fs module. It takes the file name, the file contents and a callback that receives an error object if the write fails.
launchChromeAndRunLighthouse(argv.url).then(results => {
fs.writeFile("report.json", results, err => {
if (err) throw err;
});
});The file belongs in the dirName directory created earlier, so the dirName variable is prepended to the path.
launchChromeAndRunLighthouse(argv.url).then(results => {
fs.writeFile(`${dirName}/report.json`, results, err => {
if (err) throw err;
});
});For the file name, the report's own fetchTime property supplies a timestamp. Colons must be swapped for underscores so the name is valid on Windows.
launchChromeAndRunLighthouse(argv.url).then(results => {
fs.writeFile(
`${dirName}/${results["fetchTime"].replace(/:/g, "_")}.json`,
results,
err => {
if (err) throw err;
}
);
});
Running the script at this point fails rather than producing a timestamped file:
UnhandledPromiseRejectionWarning: TypeError: Cannot read property 'replace' of undefinedThe cause is that Lighthouse hands back JSON rather than a JavaScript object. Instead of parsing it, ask Lighthouse for an object directly by changing this line:
return chrome.kill().then(() => results.report);to:
return chrome.kill().then(() => results.lhr);Rerunning now names the file correctly, but its contents are:
[object Object]The opposite problem has appeared: a JavaScript object is being written without being stringified first. Returning both formats from Lighthouse avoids spending resources parsing or stringifying the large object ourselves:
return lighthouse(url, opts).then(results => {
return chrome.kill().then(() => {
return {
js: results.lhr,
json: results.report
};
});
});The writeFile call then becomes:
fs.writeFile(
`${dirName}/${results.js["fetchTime"].replace(/:/g, "_")}.json`,
results.json,
err => {
if (err) throw err;
}
);Each audit now lands in the URL-named directory under a unique timestamped filename, so reports stay organised and never overwrite one another.
Designing the comparison
For day-to-day performance work, comparing reports straight in the console answers whether a change is heading in the right direction. The functionality has two requirements:
- When an audit finishes and a previous report for the same site exists, compare against it automatically and show changes to key performance metrics.
- Allow comparison of key metrics from any two reports, from any two websites, without generating a new Lighthouse run.
The comparison covers the numerical key performance metrics every report collects, which describe objective and perceived performance:

Three further metrics sit outside that part of the report but are already in a comparable format:
- Time to first byte — the time at which the server sends a response.
- Total blocking time — the sum of all periods between FCP and Time to Interactive where task length exceeded 50ms, in milliseconds.
- Estimated input latency — an estimate of how long the app takes to respond to input, in milliseconds, during the busiest 5s window of page load; above 50ms users may perceive the app as laggy.
Output is a simple old-versus-new percentage comparison, with each metric colour-coded as faster, slower or unchanged for quick scanning:

Finding the previous report
A new function, compareReports(), sits below launchChromeAndRunLighthouse() and owns all comparison logic. It accepts two reports through the parameters from and to. For now it prints a little data from each report to confirm they arrive correctly.
const compareReports = (from, to) => {
console.log(from["finalUrl"] + " " + from["fetchTime"]);
console.log(to["finalUrl"] + " " + to["fetchTime"]);
};Because comparison follows the creation of a new report, the call belongs in the then function of launchChromeAndRunLighthouse(). With, say, 30 reports in a directory, the script must identify the most recent one to use as the previous report; the timestamped filenames make that possible. Collecting the existing reports is the job of the glob dependency, which does pattern matching when the number and names of files can't be predicted:
npm install glob --save-devImport it at the top of the file in the usual way:
const lighthouse = require('lighthouse');
const chromeLauncher = require('chrome-launcher');
const argv = require('yargs').argv;
const url = require('url');
const fs = require('fs');
const glob = require('glob');Set its sync option to true so execution waits until the number of other reports is known. The directory is the existing dirName.
launchChromeAndRunLighthouse(argv.url).then(results => {
const prevReports = glob(`${dirName}/*.json`, {
sync: true
});
// et al
});glob returns an array of paths. Given a directory laid out as:
- lukeharrison.dev
- 2020-01-31T10_18_12.648Z.json
- 2020-01-31T10_18_24.110Z.json
the array would be:
[
'lukeharrison.dev/2020-01-31T10_18_12.648Z.json',
'lukeharrison.dev/2020-01-31T10_18_24.110Z.json'
]Since a comparison needs a previous report, this array doubles as the conditional for the comparison logic:
const prevReports = glob(`${dirName}/*.json`, {
sync: true
});
if (prevReports.length) {
}The paths now need reducing to bare timestamped filenames and compared. Trimming the directory names and turning underscores back into colons — making the strings valid dates again — is easiest with path, another native Node.js module.
const path = require('path');Passing a path to its parse method:
path.parse('lukeharrison.dev/2020-01-31T10_18_24.110Z.json');returns this object:
{
root: '',
dir: 'lukeharrison.dev',
base: '2020-01-31T10_18_24.110Z.json',
ext: '.json',
name: '2020-01-31T10_18_24.110Z'
}That yields the list of timestamp filenames like so:
if (prevReports.length) {
dates = [];
for (report in prevReports) {
dates.push(
new Date(path.parse(prevReports[report]).name.replace(/_/g, ":"))
);
}
}For the same example directory, the result would be:
[
'2020-01-31T10:18:12.648Z',
'2020-01-31T10:18:24.110Z'
]Dates compare natively:
const alpha = new Date('2020-01-31');
const bravo = new Date('2020-02-15');
console.log(alpha > bravo); // false
console.log(bravo > alpha); // trueA reduce therefore collapses the array of dates down to the most recent one:
dates = [];
for (report in prevReports) {
dates.push(new Date(path.parse(prevReports[report]).name.replace(/_/g, ":")));
}
const max = dates.reduce(function(a, b) {
return Math.max(a, b);
});Printing max at this stage shows a UNIX timestamp, so one more line converts the date back to ISO format:
const max = dates.reduce(function(a, b) {
return Math.max(a, b);
});
const recentReport = new Date(max).toISOString();Given these reports:
- 2020-01-31T23_24_41.786Z.json
- 2020-01-31T23_25_36.827Z.json
- 2020-01-31T23_37_56.856Z.json
- 2020-01-31T23_39_20.459Z.json
- 2020-01-31T23_56_50.959Z.json
recentReport would be 2020-01-31T23:56:50.959Z.
Next, extract its contents. Declare recentReportContents beneath recentReport and assign it an IIFE (immediately invoked function expression) — the extra parentheses make it run as soon as the parser reaches it, with no manual call needed:
const recentReportContents = (() => {
})();Inside, readFileSync() from fs returns the most recent report's contents, which are JSON and must be parsed into a regular JavaScript object:
const recentReportContents = (() => {
const output = fs.readFileSync(
dirName + "/" + recentReport.replace(/:/g, "_") + ".json",
"utf8",
(err, results) => {
return results;
}
);
return JSON.parse(output);
})();Then compareReports() is called with the current and most recent report as arguments:
compareReports(recentReportContents, results.js);For the moment this only prints a few details to verify the data:
https://www.lukeharrison.dev/ 2020-02-01T00:25:06.918Z
https://www.lukeharrison.dev/ 2020-02-01T00:25:42.169ZAny errors here are best resolved by deleting stray report.json files or reports left without valid content earlier in the tutorial.
Comparing arbitrary pairs from the command line
To satisfy the second requirement, allow the user to pass full report paths as command line arguments, which are then sent to compareReports():
node lh.js --from lukeharrison.dev/2020-02-01T00:25:06.918Z --to cnn.com/2019-12-16T15:12:07.169ZImplement this by extending the if statement that checks for a URL argument, adding a check for a from and to path pair and otherwise falling back to the URL check. A pair of paths therefore skips the Lighthouse audit entirely.
if (argv.from && argv.to) {
} else if (argv.url) {
// et al
}The contents of both JSON files are read, parsed and handed to compareReports(). Parsing already happened when fetching the most recent report, so that logic moves into its own helper. Build getContents(), which takes a file path, from the recentReportContents() code — but as a regular function, not an IIFE, so it does not fire the moment the parser sees it:
const getContents = pathStr => {
const output = fs.readFileSync(pathStr, "utf8", (err, results) => {
return results;
});
return JSON.parse(output);
};
const compareReports = (from, to) => {
console.log(from["finalUrl"] + " " + from["fetchTime"]);
console.log(to["finalUrl"] + " " + to["fetchTime"]);
};recentReportContents() is then updated to use the helper:
const recentReportContents = getContents(dirName + '/' + recentReport.replace(/:/g, '_') + '.json');The new conditional passes the contents of the comparison reports to compareReports():
if (argv.from && argv.to) {
compareReports(
getContents(argv.from + ".json"),
getContents(argv.to + ".json")
);
}Again, basic report information is printed to the console to confirm everything works:
node lh.js --from lukeharrison.dev/2020-01-31T23_24_41.786Z --to lukeharrison.dev/2020-02-01T11_16_25.221ZThe result looks like:
https://www.lukeharrison.dev/ 2020-01-31T23_24_41.786Z
https://www.lukeharrison.dev/ 2020-02-01T11_16_25.221ZExtracting the metrics
Everything the comparison needs lives in the audits property of the Lighthouse result object, which bundles performance metrics, opportunities and informational entries. The bulk of it is irrelevant to the tool, so the first job is narrowing it down.
The First Contentful Paint audit is a representative sample of the nine performance metrics to be compared:
"first-contentful-paint": {
"id": "first-contentful-paint",
"title": "First Contentful Paint",
"description": "First Contentful Paint marks the time at which the first text or image is painted. [Learn more](https://web.dev/first-contentful-paint).",
"score": 1,
"scoreDisplayMode": "numeric",
"numericValue": 1081.661,
"displayValue": "1.1 s"
}Start by listing those nine metric keys in an array, which then serves as a filter against the audit object:
const compareReports = (from, to) => {
const metricFilter = [
"first-contentful-paint",
"first-meaningful-paint",
"speed-index",
"estimated-input-latency",
"total-blocking-time",
"max-potential-fid",
"time-to-first-byte",
"first-cpu-idle",
"interactive"
];
};Iterate over one report's audits object and match each name against the filter list — either report works, since their content structures are identical. Only the matches are kept:
const metricFilter = [
"first-contentful-paint",
"first-meaningful-paint",
"speed-index",
"estimated-input-latency",
"total-blocking-time",
"max-potential-fid",
"time-to-first-byte",
"first-cpu-idle",
"interactive"
];
for (let auditObj in from["audits"]) {
if (metricFilter.includes(auditObj)) {
console.log(auditObj);
}
}The keys that survive the filter and reach the console are:
first-contentful-paint
first-meaningful-paint
speed-index
estimated-input-latency
total-blocking-time
max-potential-fid
time-to-first-byte
first-cpu-idle
interactiveValues are then read from from['audits'][auditObj].numericValue and to['audits'][auditObj].numericValue inside the loop. Logging each key alongside its value produces output like this:
first-contentful-paint 1081.661 890.774
first-meaningful-paint 1081.661 954.774
speed-index 15576.70313351777 1098.622294504341
estimated-input-latency 12.8 12.8
total-blocking-time 59 31.5
max-potential-fid 153 102
time-to-first-byte 16.859999999999985 16.096000000000004
first-cpu-idle 1704.8490000000002 1918.774
interactive 2266.2835 2374.3615Computing the change
What remains is the percentage difference between the two values, printed in the color-coded format. The formula:
((From - To) / From) x 100For a Speed Index of 5.7s in the first report (from) and 2.1s in the second (to):
5.7 - 2.1 = 3.6
3.6 / 5.7 = 0.63157895
0.63157895 * 100 = 63.157895Rounded to two decimal places, that is a 63.16% decrease in Speed Index. The calculation belongs in a helper function declared inside compareReports(), below the metricFilter array:
const calcPercentageDiff = (from, to) => {
const per = ((to - from) / from) * 100;
return Math.round(per * 100) / 100;
};Within the auditObj conditional, the helper supplies the percentage for each metric:
for (let auditObj in from["audits"]) {
if (metricFilter.includes(auditObj)) {
const percentageDiff = calcPercentageDiff(
from["audits"][auditObj].numericValue,
to["audits"][auditObj].numericValue
);
}
}The target console format looks like this:
Color comes from passing a color code as an argument to console.log():
console.log('\x1b[36m', 'hello') // Would print 'hello' in cyan
Only three codes matter here: green \x1b[32m, red \x1b[31m, and white \x1b[37m for values that stay the same. A full reference of codes is available in the linked Stack Overflow question.
Picking color and wording
Three things depend on the sign of the percentage:
- The color: green for a negative change, red for a positive one, white for no change.
- The message: "[Name] is X% slower" for positive numbers, "[Name] is X% faster" for negative ones, and "[Name] is unchanged" when there is no difference.
- The minus sign must be stripped from negative numbers, otherwise the sentence reads as nonsense — Speed Index is -92.95% faster.
Math.sign() handles the branching: it returns 1 for positive arguments, 0 for zero and -1 for negative ones.
for (let auditObj in from["audits"]) {
if (metricFilter.includes(auditObj)) {
const percentageDiff = calcPercentageDiff(
from["audits"][auditObj].numericValue,
to["audits"][auditObj].numericValue
);
let logColor = "\x1b[37m";
const log = (() => {
if (Math.sign(percentageDiff) === 1) {
logColor = "\x1b[31m";
return `${percentageDiff + "%"} slower`;
} else if (Math.sign(percentageDiff) === 0) {
return "unchanged";
} else {
logColor = "\x1b[32m";
return `${percentageDiff + "%"} faster`;
}
})();
console.log(logColor, `${from["audits"][auditObj].title} is ${log}`);
}
}The tool can now generate a fresh Lighthouse report and, when a previous one exists, compare the two. Passing any two reports from any two sites to compareReports() works equally well.
Full code
The completed source code is available as a Gist:
const lighthouse = require("lighthouse");
const chromeLauncher = require("chrome-launcher");
const argv = require("yargs").argv;
const url = require("url");
const fs = require("fs");
const glob = require("glob");
const path = require("path");
const launchChromeAndRunLighthouse = url => {
return chromeLauncher.launch().then(chrome => {
const opts = {
port: chrome.port
};
return lighthouse(url, opts).then(results => {
return chrome.kill().then(() => {
return {
js: results.lhr,
json: results.report
};
});
});
});
};
const getContents = pathStr => {
const output = fs.readFileSync(pathStr, "utf8", (err, results) => {
return results;
});
return JSON.parse(output);
};
const compareReports = (from, to) => {
const metricFilter = [
"first-contentful-paint",
"first-meaningful-paint",
"speed-index",
"estimated-input-latency",
"total-blocking-time",
"max-potential-fid",
"time-to-first-byte",
"first-cpu-idle",
"interactive"
];
const calcPercentageDiff = (from, to) => {
const per = ((to - from) / from) * 100;
return Math.round(per * 100) / 100;
};
for (let auditObj in from["audits"]) {
if (metricFilter.includes(auditObj)) {
const percentageDiff = calcPercentageDiff(
from["audits"][auditObj].numericValue,
to["audits"][auditObj].numericValue
);
let logColor = "\x1b[37m";
const log = (() => {
if (Math.sign(percentageDiff) === 1) {
logColor = "\x1b[31m";
return `${percentageDiff.toString().replace("-", "") + "%"} slower`;
} else if (Math.sign(percentageDiff) === 0) {
return "unchanged";
} else {
logColor = "\x1b[32m";
return `${percentageDiff.toString().replace("-", "") + "%"} faster`;
}
})();
console.log(logColor, `${from["audits"][auditObj].title} is ${log}`);
}
}
};
if (argv.from && argv.to) {
compareReports(
getContents(argv.from + ".json"),
getContents(argv.to + ".json")
);
} else if (argv.url) {
const urlObj = new URL(argv.url);
let dirName = urlObj.host.replace("www.", "");
if (urlObj.pathname !== "/") {
  dirName = dirName + urlObj.pathname.replace(/\//g, "_");
}
if (!fs.existsSync(dirName)) {
fs.mkdirSync(dirName);
}
launchChromeAndRunLighthouse(argv.url).then(results => {
const prevReports = glob(`${dirName}/*.json`, {
sync: true
});
if (prevReports.length) {
dates = [];
for (report in prevReports) {
dates.push(
new Date(path.parse(prevReports[report]).name.replace(/_/g, ":"))
);
}
const max = dates.reduce(function(a, b) {
return Math.max(a, b);
});
const recentReport = new Date(max).toISOString();
const recentReportContents = getContents(
dirName + "/" + recentReport.replace(/:/g, "_") + ".json"
);
compareReports(recentReportContents, results.js);
}
fs.writeFile(
  `${dirName}/${results.js["fetchTime"].replace(/:/g, "_")}.json`,
  results.json,
  err => {
    if (err) throw err;
  }
);
});
} else {
throw "You haven't passed a URL to Lighthouse";
}Where to take it
- A simple online dashboard that lets non-technical users run Lighthouse audits and watch metrics trend over time. Winning stakeholders over to web performance work is hard, so something tangible they can interact with directly can help spark interest.
- Performance budget support: when a generated report shows metrics slower than they should be, the tool outputs advice on improving them.