
Why pages repaint, and how to stop wasted work
Every frame a browser draws involves taking your DOM and CSS and producing pixels on screen. That pipeline has several stages: the DOM is parsed from markup, the CSSOM from stylesheets, and the two are combined into a render tree. Chrome then hands that tree to its rasterizer, Skia, which converts each visible element into drawing calls similar to the canvas API—think moveTo, lineTo, and more complex operations—and executes them into bitmaps. Those bitmaps are uploaded to the GPU and composited into the final image.
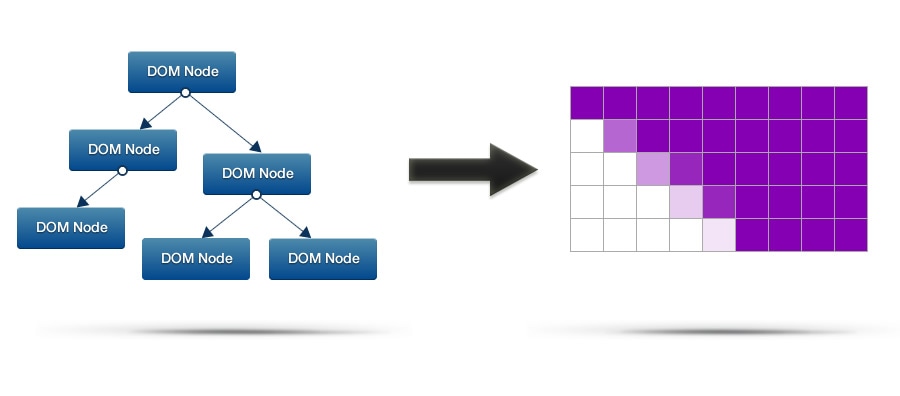
The cost of this work is directly tied to the styles applied. Some CSS features are algorithmically heavy and force Skia to do more per element. Since all of this must finish within a frame budget of roughly 16ms at 60fps, expensive paints easily spill over and become visible jank. The key is knowing what triggers a paint in the first place, and how to avoid unnecessary ones.
Scrolling always repaints something
Scrolling forces the browser to repaint content before it appears onscreen. Minimizing the painted area helps, but a small rectangle is no guarantee of speed—if the elements in that region have complex styles, the paint itself can still be slow. Chrome's DevTools offers a "Show Paint Rectangles" option (via the cog in the lower right corner) that flashes the areas being repainted as you interact with the page. Keep an eye on those rectangles while scrolling; they tell you exactly where the browser is spending paint time.
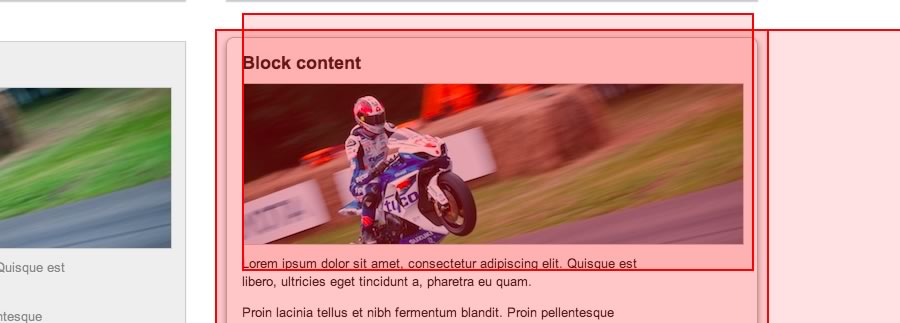
Scroll performance matters because users notice poor scrolling immediately. The goal is to keep paint work light during a scroll so frames stay within budget.
Interactions add paint on top of paint
Hovers, clicks, touches, and drags all cause repaints as well. A hover effect, for example, forces Chrome to repaint the affected element, and if that element uses heavy styles, the frame rate drops even for a tiny interaction. Smooth animations require that the style changes involved stay cheap enough to render in time. But interactions don't happen in isolation: scroll and input often occur at the same time, and that combination is where the real cost appears.
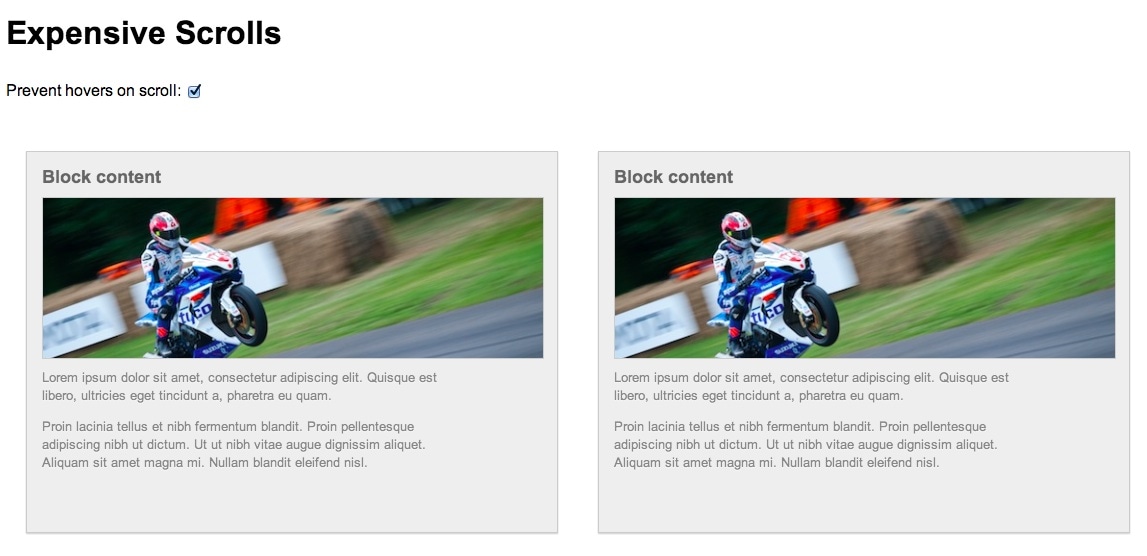
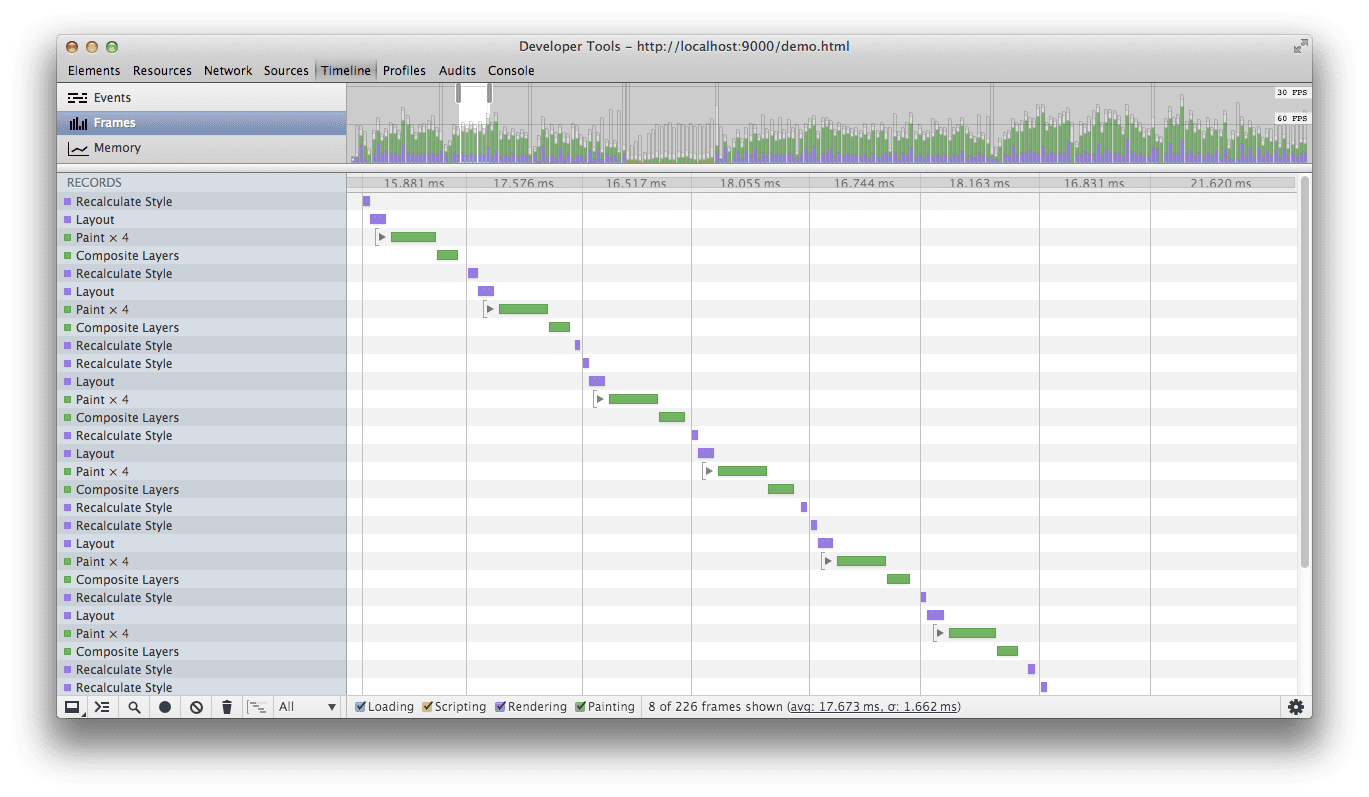
Moving the mouse while scrolling can inadvertently trigger an expensive hover just as the page is already doing paint work for the scroll. Together those tasks can push a frame past the ~16.7ms budget, causing visible jank. A demo from the original article shows this clearly: hovering over heavy-styled blocks during a scroll registers significant paint time in DevTools, periodically exceeding the frame budget. The cost of that interaction paint is waste—it wasn't needed by the scroll itself, but it steals time from frames that need it.
The fix is simple and small. Attach a scroll handler that disables hover effects and starts a timer to re-enable them. As long as the user is scrolling, the page won't run expensive interaction paints. When scrolling stops for long enough, hovers are switched back on.
// Used to track the enabling of hover effects
var enableTimer = 0;

/*
 * Listen for a scroll and use that to remove
 * the possibility of hover effects
 */
window.addEventListener('scroll', function() {
  clearTimeout(enableTimer);
  removeHoverClass();

  // enable after 1 second, choose your own value here!
  enableTimer = setTimeout(addHoverClass, 1000);
}, false);

/**
 * Removes the hover class from the body. Hover styles
 * are reliant on this class being present
 */
function removeHoverClass() {
  document.body.classList.remove('hover');
}

/**
 * Adds the hover class to the body. Hover styles
 * are reliant on this class being present
 */
function addHoverClass() {
  document.body.classList.add('hover');
}
The approach uses a class on body to track whether hovers are allowed. The underlying styles only apply when that class is present:
/* Expect the hover class to be on the body
 before doing any hover effects */
.hover .block:hover {
 …
}
Keep paint under budget by design
Render performance is part of the user experience, and the paint workload should stay well under the 16ms budget. Using DevTools throughout development helps you spot bottlenecks as they appear rather than after the fact. Inadvertent interactions during scrolls, particularly on paint-heavy elements, are a common and costly trap. A few lines of code can prevent that waste entirely. Audit your own sites for places where hovers or other interactions might fire during a scroll—those are the spots that could use a little paint protection.


