Stripe users can now give compatible agents such as Claude and Cursor structured access to their Stripe analytics data. Two routes are available: connecting through Stripe's MCP, or calling the Queries API and Reports API directly. Both are generally available to all Stripe users. Typical uses include producing an investor slide deck that shows where the business outperformed the previous quarter, or assembling a custom dashboard that explains a shift in revenue, all from natural language prompts.
Pricing and availability
The Queries API is free for every Stripe user through January 31, 2027, after which usage is billed per credit with no monthly subscription required. The Reports API stays free.
What the agent gets to work with
A useful analysis depends on the agent knowing which tables to query, how Stripe defines the metrics involved, and how to build the analysis itself. The Reports API supplies a modeled schema spanning more than 300 tables along with built-in guidance on using them, which Stripe says improves the accuracy and reliability of results. For a subscriptions business, for example, the agent can be routed to track monthly recurring revenue over time and attribute movement to upgrades, downgrades, churn and other drivers.
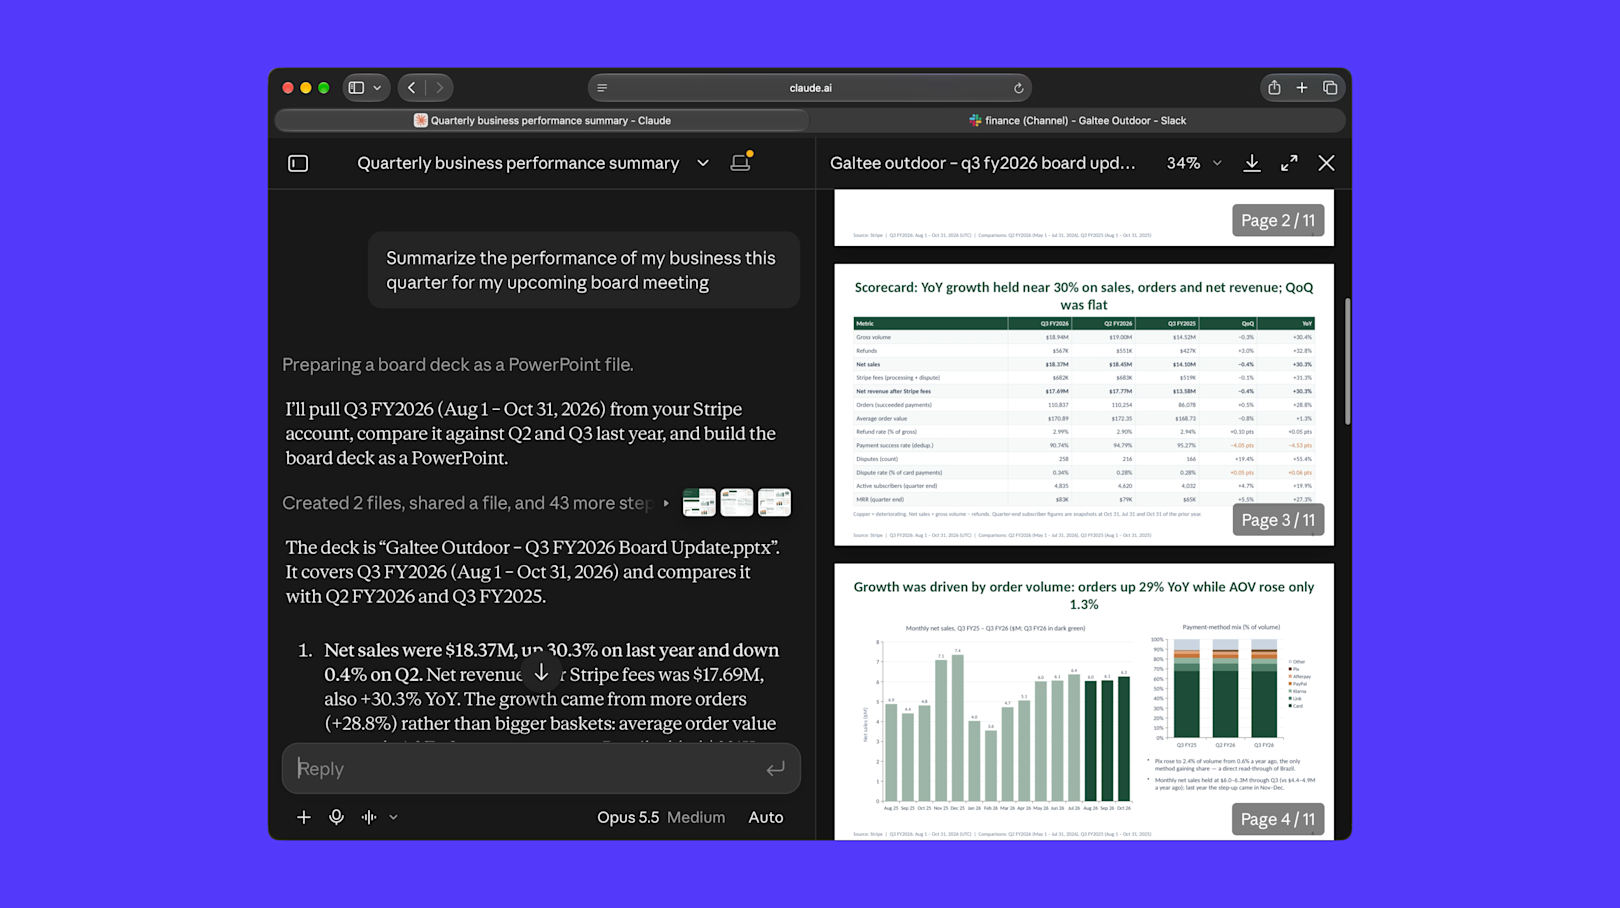
Responses can also be combined with outside context: data from connected tools and the history of earlier conversations. In Claude, a PostHog connector for website activity, subscription data from Stripe and context from prior threads about a campaign could be pulled together to identify customers who clicked a button but churned later. Because such financial analysis often feeds business decisions and investor reporting, every analysis run against the APIs exposes the underlying SQL, so you can check how a result was calculated and edit the query as requirements change.
Prompts to start with
The following examples can be copied or adapted.
Accounting and finance:
- "Reconcile each payout from the past three months to its underlying payments, refunds, disputes, fees, and transfers. Show any amounts that do not tie out and the transactions contributing to each difference."
- "Create an Excel file with all open and past-due invoices grouped by customer and invoice age from the last month. Flag customers with repeated collection failures."
Growth tracking:
- "Build a monthly recurring revenue dashboard for me to monitor MRR, expansion, contraction, churn, and reactivation, then explain the largest month-over-month changes by product and plan."
- "How have our new promotions affected revenue this quarter?"
Fraud:
- "Set up a Slack notification when fraud rates go higher than my predefined range. Show trends by payment method and dispute reason, then highlight the segments with the largest increases."
- "Find the payment segments with the highest chargeback rates over the past 90 days."
Payments performance:
- "Give me a visual report on my payments business over the past quarter, with charts of payment volume, success rates, failures, refunds, and disputes. Show the most important trends by payment method and market, flag notable changes, and summarize where performance is improving or needs attention."
- "Find failed payments from the past 30 days that did not succeed within three days. Group them by decline reason and payment method."
Getting connected
Users already on the Stripe MCP can prompt their agent with any of the examples above; setup instructions are in the documentation. Those new to it open their agent and prompt "Pull my Stripe data in" to establish the connection. For programmatic access from an existing workflow, use the Queries API or Reports API directly.