Lighthouse audits, now with more checks
Lighthouse, the open source auditing tool bundled into DevTools, scores pages on performance, SEO, accessibility and related categories. Generating a report takes a single click, and the output is plain-language findings — for example, "Document uses legible font sizes 100% legible text" or "Avoid an excessive DOM size (1,189 elements)". Nearly every audit links to developer documentation describing why it can fail and how to fix it.
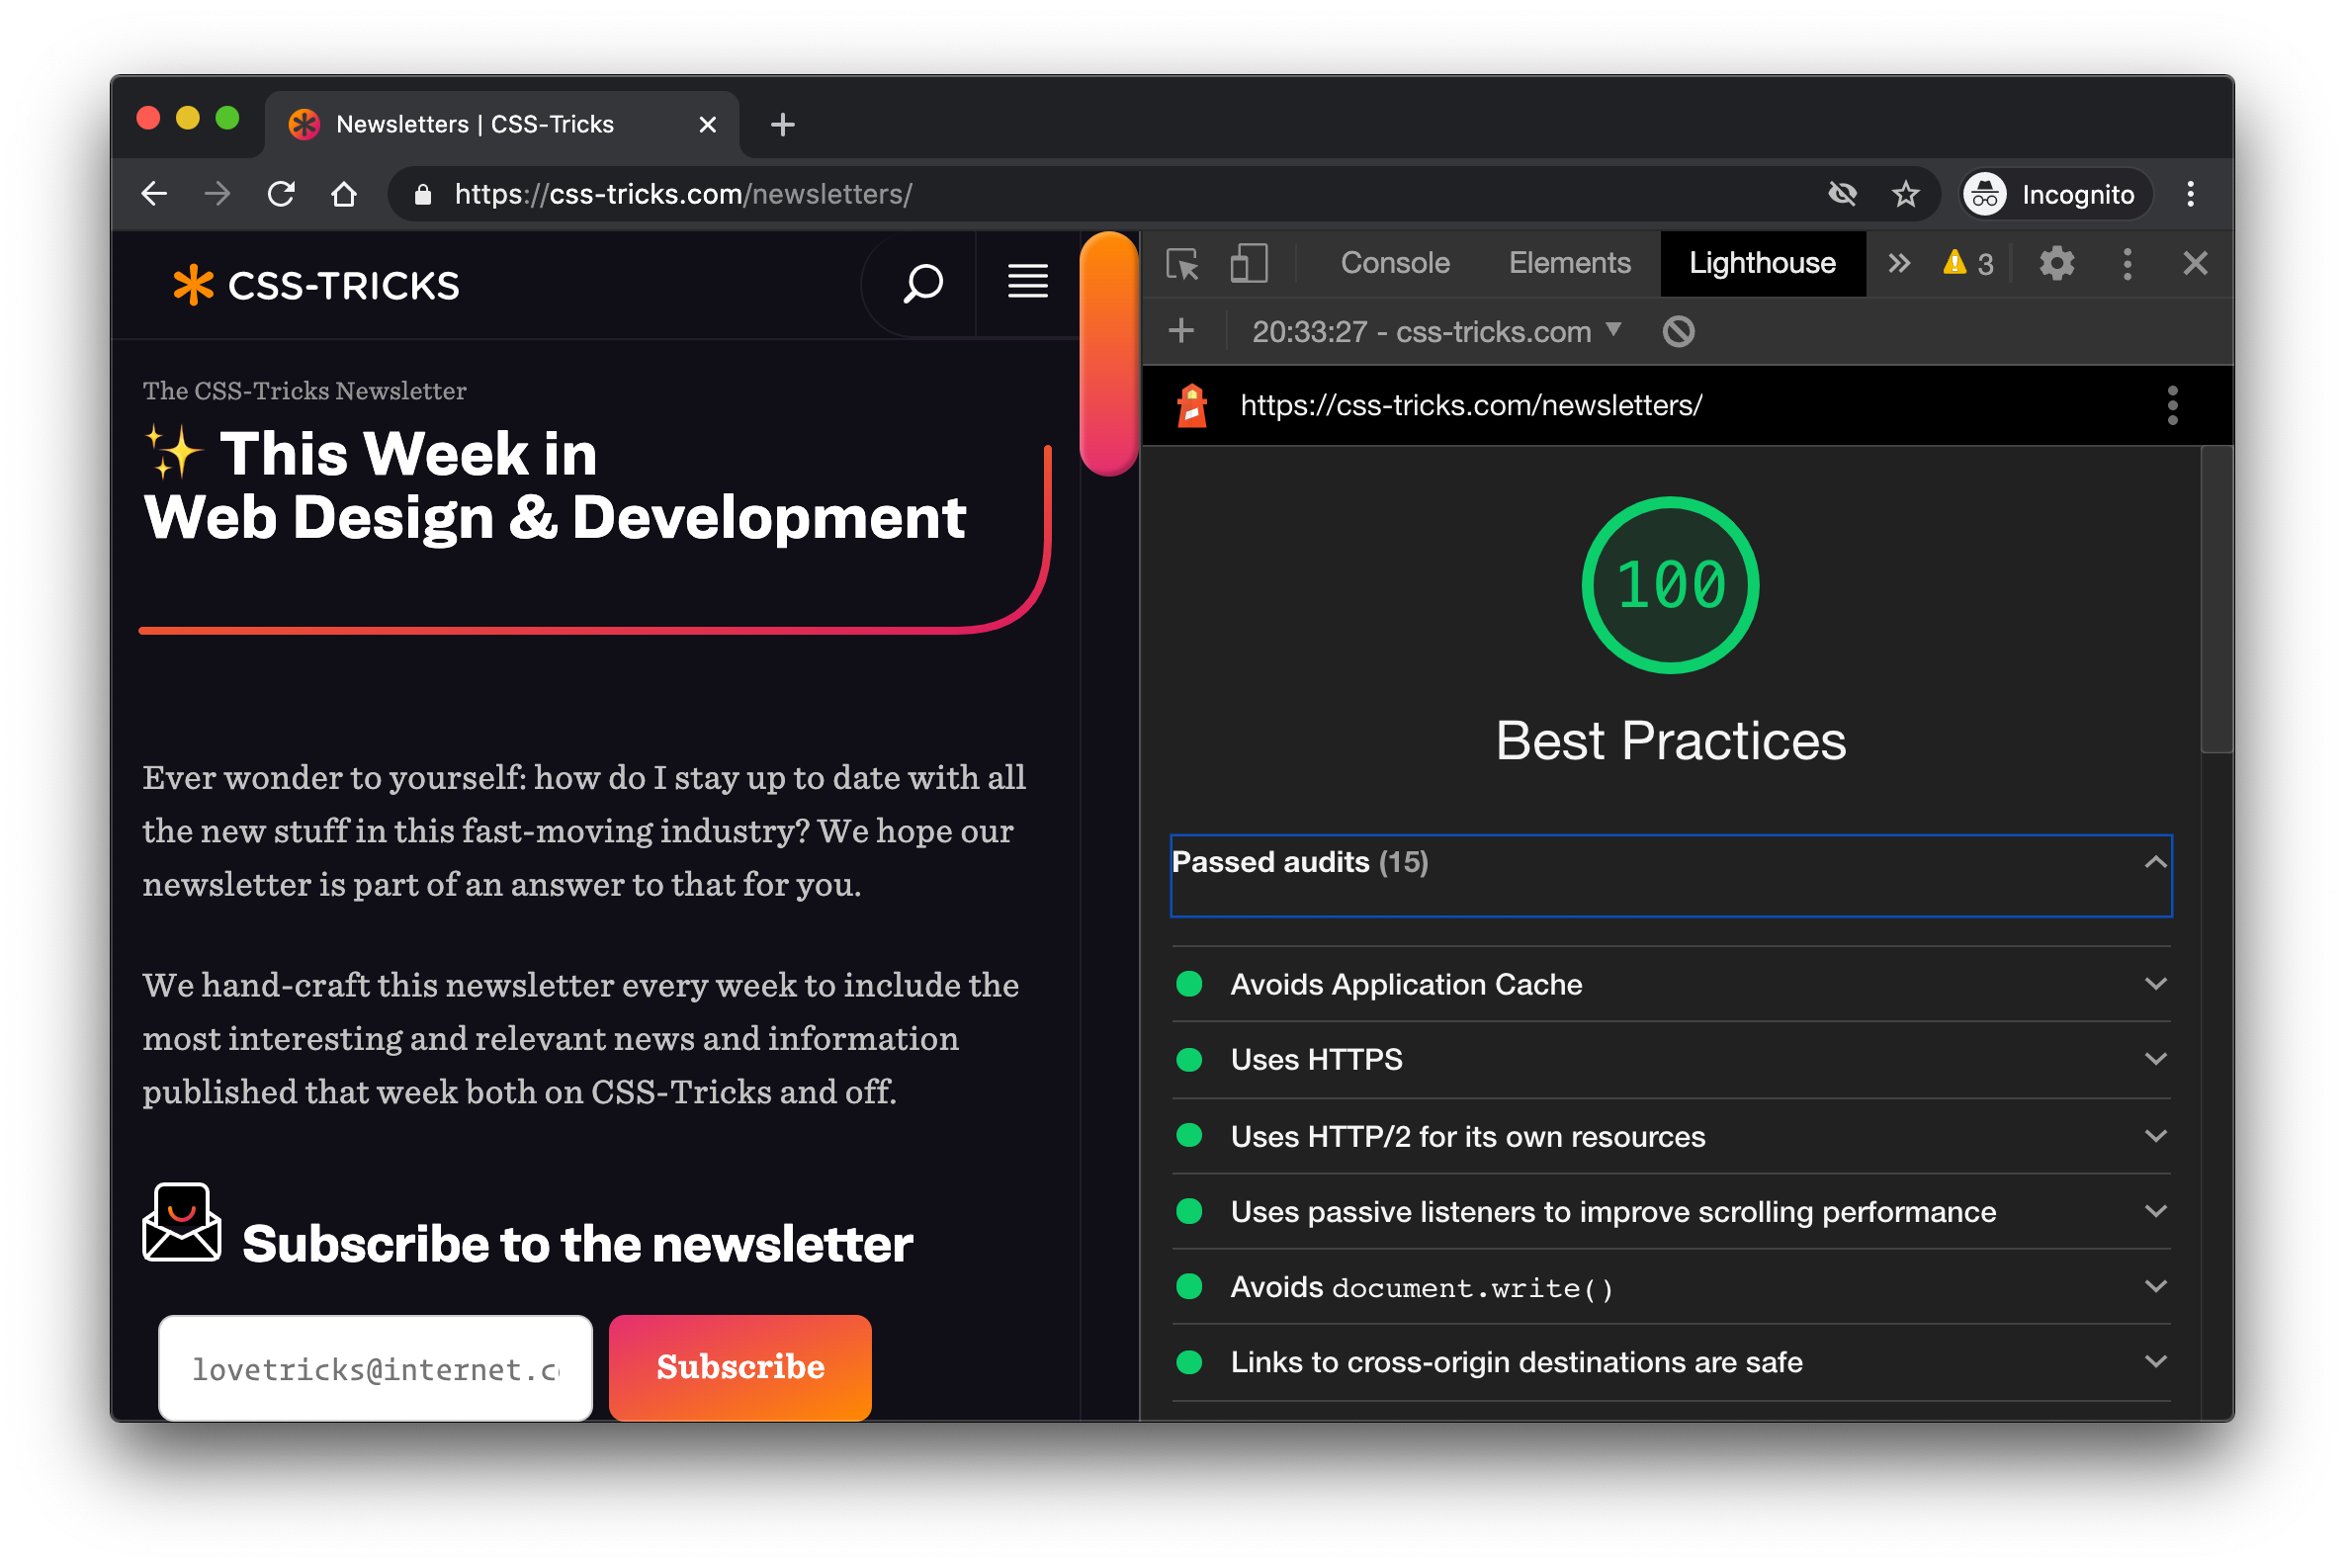
The panel has shipped since 2017, but it keeps gaining user-facing audits, including:
- a check that anchor elements resolve to their URLs
- an audit verifying that Largest Contentful Paint is fast enough
- a warning for unused JavaScript
To try it: open DevTools on one of your own sites, switch to the Lighthouse panel, pick the categories to audit (Best practices is a reasonable starting point), click Generate report, then open individual passed or failed audits to dig into the findings.
Accessibility moves into Inspect Element
Inspect Element is arguably the most-used part of DevTools, and its tooltip now carries accessibility information. That matters less for the data itself than for its placement: DevTools has offered accessibility tooling for some time, but embedding it in a everyday workflow raises its visibility considerably.

The tooltip reports the text's contrast ratio against its background, the text representation, the ARIA role, and whether the element is keyboard-focusable. Right-click an element and choose Inspect, or use Cmd + Shift + C.
Emulating vision deficiencies
The Rendering pane can simulate how a page appears to users with impaired vision. Beyond blurred vision, the available options include protanopia, deuteranopia, tritanopia and achromatopsia.

- Open DevTools (Inspect, or
Cmd+Shift+C). - Open the DevTools Command menu (
Cmd+Shift+Pon Mac,Ctrl+Shift+Pon Windows). - Choose Show Rendering.
- Pick a deficiency in the Rendering pane.
The feature is meant to complement existing accessibility knowledge rather than teach it: it influences design decisions instead of prescribing them.
User-facing timings in the Performance panel
The Performance panel has traditionally read as a dense mix of shapes and colors. Its update surfaces meaningful metrics more clearly.


The added timing rectangles in the "Timings" section of a recording mark:
- DOMContentLoaded: fires when the initial HTML has loaded
- First Paint: the browser's first paint of pixels to the screen
- First Contentful Paint: when DOM content is drawn, signaling to the user that content is arriving
- Onload: the page and all of its resources have finished loading
- Largest Contentful Paint: the largest image or text element rendered in the viewport
Clicking the Largest Contentful Paint event in a recording reveals further detail.

The Related Node field is arguably the most valuable item there, since it names exactly which element contributed to the LCP event. To see it yourself, open the Performance panel, click "Start profiling and reload page", inspect the timing metrics in the Timings section, and click any individual metric for more information.
Real-time metrics with Performance Monitor
For a quick read on a page's performance after Lighthouse, the Performance Monitor resembles having something like WebPageTest.org at your fingertips, CPU usage included.

- Open DevTools.
- Open the Command menu (
Cmd+Shift+Pon Mac,Ctrl+Shift+Pon Windows). - Select "Show performance monitor".
- Navigate and interact with the site.
- Watch the results.
Unlike Lighthouse, the Performance Monitor offers no recommendations — interpretation and follow-up are left to you, whether that means judging a 90% CPU usage figure as acceptable or not. An interactive legend toggles metrics such as CPU usage, JS heap size, DOM Nodes, JS event listeners, Documents, Document Frames, Layouts / sec and Style recalcs / sec.
One browser among several
Chrome is the reference point here, but the tooling landscape is in motion everywhere. Firefox DevTools is in strong shape, and Microsoft Edge, built on Chromium, inherits these same DevTools capabilities. Safari's Web Inspector has also progressed considerably, as its Technology Preview release notes show.