
What Shoppers Actually Look For
Buying decisions hinge on trust. That's why roughly 95% of users consult reviews, but the information they seek goes far beyond a high average score. Customers scrutinize reviews to verify that a product is high quality, fairly priced, and the right fit for their needs. They look for validation from people with a similar profile, check for hidden details like missing accessories or sizing quirks, and assess risk factors such as return policies and the availability of customer support.
These subtle cues are rarely visible in a simple star rating on a landing page. To address the underlying doubts, review UX needs to surface the details that help customers calculate risks and confirm their choice.
Lean Into Negative Feedback
Most experienced online shoppers read negative reviews first, and they need enough of them to navigate their skepticism. Specific, critical feedback gives customers the chance to determine whether a complaint is relevant to them. For example, a review citing delayed shipping during the holidays or a temporary issue with customer service may not apply to every buyer all year long.
A complete absence of negative reviews is a red flag in itself, as it can obscure serious defects, fraudulent practices, or a deliberately difficult cancellation process. However, you can run into a problem with trusting only the most extreme opinions. Most satisfied customers do not post reviews, while those who are very happy or very frustrated are far more likely to share their experience.
Because of this skewed data, stars matter less than the quality of the overall signal. A few honest, specific negative reviews can build more confidence than a synthetic 5.0 score. Consider offering a small incentive for detailed disgruntled feedback, or ask reviewers to confirm whether a problem was ultimately resolved. These methods help ensure you have enough low scores circulating to appear honest while also providing crucial nuance about the product.
Precision Matters in Rating Displays
Vague star displays create a problem: they compress vastly different experiences into a pair of rounded numbers. A product rated 4.0 sits in the same visual bucket as one rated 4.9, despite the large gap in customer satisfaction that this represents, and the stars hide what users liked or disliked entirely.
The best practice is to show a more granular average score on a decimal scale, such as 4.7 out of 5, and pair it with the total number of reviews. The average score provides a useful benchmark, while the volume of ratings gives that score credibility. Review counts also strongly affect choice. In usability testing, users prefer products with 180 reviews and a 4.5-star average over competing options with 39 reviews and a 4.8-star average. Roughly 70% will select this lower-scoring but more established product.
There's also a sweet spot for ratings. A score landing between approximately 4.5 and 4.89—backed by at least 75 reviews—is a competitive place to be. If the number jumps beyond 4.9, customers tend to halt and look for hidden traps or misleading marketing, a level of scrutiny that rarely helps close a sale. A "perfect" rating can feel less trustworthy than a genuinely positive score below that threshold.
Provide Context Through Distribution
Rating distribution summaries are common for good reason: they break down exactly how the high and low scores are balanced across a range. Instead of comparing single aggregates, users can look for the specific patterns you'll find with most popular products—a large share of 5-star ratings, plenty of 4-star ratings, and a meaningful number of critical low scores that signal the worst that could happen.
This pattern tends to match what Sav Sidorov calls the J-shaped distribution. Rather than a graceful bell curve, great products often show a near-L shape where satisfied buyers cluster at the 5-star mark, and, noticeably, a second smaller cluster collects at the lowest rating level. Games of Thrones on IMDB shows a dense high-scoring block and a small low-scoring bump while remaining very trustworthy. Products concerned about legitimacy need this small "worst case" group to look reliable.
The J-curve also illustrates why entire systems become distorted by extreme opinions. Customers don't naturally spend time leaving a review for a 4-star experience. Feedback tends to come from the upper peak of delight and the deepest trough of frustration. Because those extreme opinions dominate, companies may need to actively coax feedback from range of users over time.
Designing around this reality can occur a few ways:
- Rating modifiers: Allow users to click up or down multiple times, (↑, ↓, ↑↑, and ↓↓), letting them provide a better gradient to describe the intensity of their experience.
- Delayed reviews: Prevent immediate ratings. Etsy requires customers to wait a week before writing a review or adding photos, ensuring they've spent time with the product rather than reacting instantly.
- Added attributes: Break down the aggregate scores and distribution by unique product attributes, offering context that prevents misinterpretation of raw numbers.
Adding context that clarifies rating patterns is probably the most reliable route to user confidence. Merely assembling a number, even if that number represents an accurately collected data set of scores, lacks the texture of the reviews that tell the rest of the story—what it's like to live with the item.
Building a Better Review Experience
The way we present feedback must support informed decision-making rather than a simple stamp of approval. To support that goal:
- Keep the star count visible, but always pair it with a decimal-based average score and the exact number of reviews used to compute it.
- Avoid the temptation to tout a perfect 5.0 rating. A high-volume option with a 4.6 score typically delivers better outcomes for both customers and brands.
- Optimize for a rating count above 75 per product, recognizing that the volume of voices is as important as the average to maintain trustworthiness.
- Prioritize unedited images and tag filters to make concrete feedback about the product experience immediately viewable and relevant.
- Add a recommendation score as a distinct metric that goes against typical reviewer bias, clarifying if a majority would actually suggest the product for others.
Handle the Distribution Dashboard Thoughtfully
Star ratings should be treated as an entrance to data, not the entire summary. A more nuanced view requires checking the full distribution alongside factors such as price and volume. That spread assists shoppers to isolate “good products with a minor imperfection” versus goods with core flaws that don't appear at first glance.
You'll produce a far more useful experience if your data isn't limited to massive, all-encompassing feedback blocks. Break summaries into context clusters like “shipping,” “value,” or “ease of setup” that communicate the specific categories shoppers seek in written evaluations. These filters also support someone who is deciding for another person (e.g., buying a toy or safety item for a child) who needs to avoid most variations in opinion.
The base requirement is to display a visible distribution summary and keep the charts legible. Shading each segment according to how customers access the pattern ensures decisions are clear. As most users scan plots to look for disproportionate shades of “concerning,” meaningful summaries prevent blind purchase and reinforce trust in the transparency of the listing.
User reviews are the engine that powers product selection in modern stores. While they compile large quantities of data, communicating that data in an honest, specific, and context-aware way converts scattered opinions into credible signals that drive sales.
Attribute-Level Ratings Let Shoppers Judge Details
A single overall distribution summary still forces customers to wade through dozens of reviews to learn about specific qualities such as battery life, fit, or value for money. One way to cut through that is to break ratings down by product attribute, showing an average score for each characteristic.

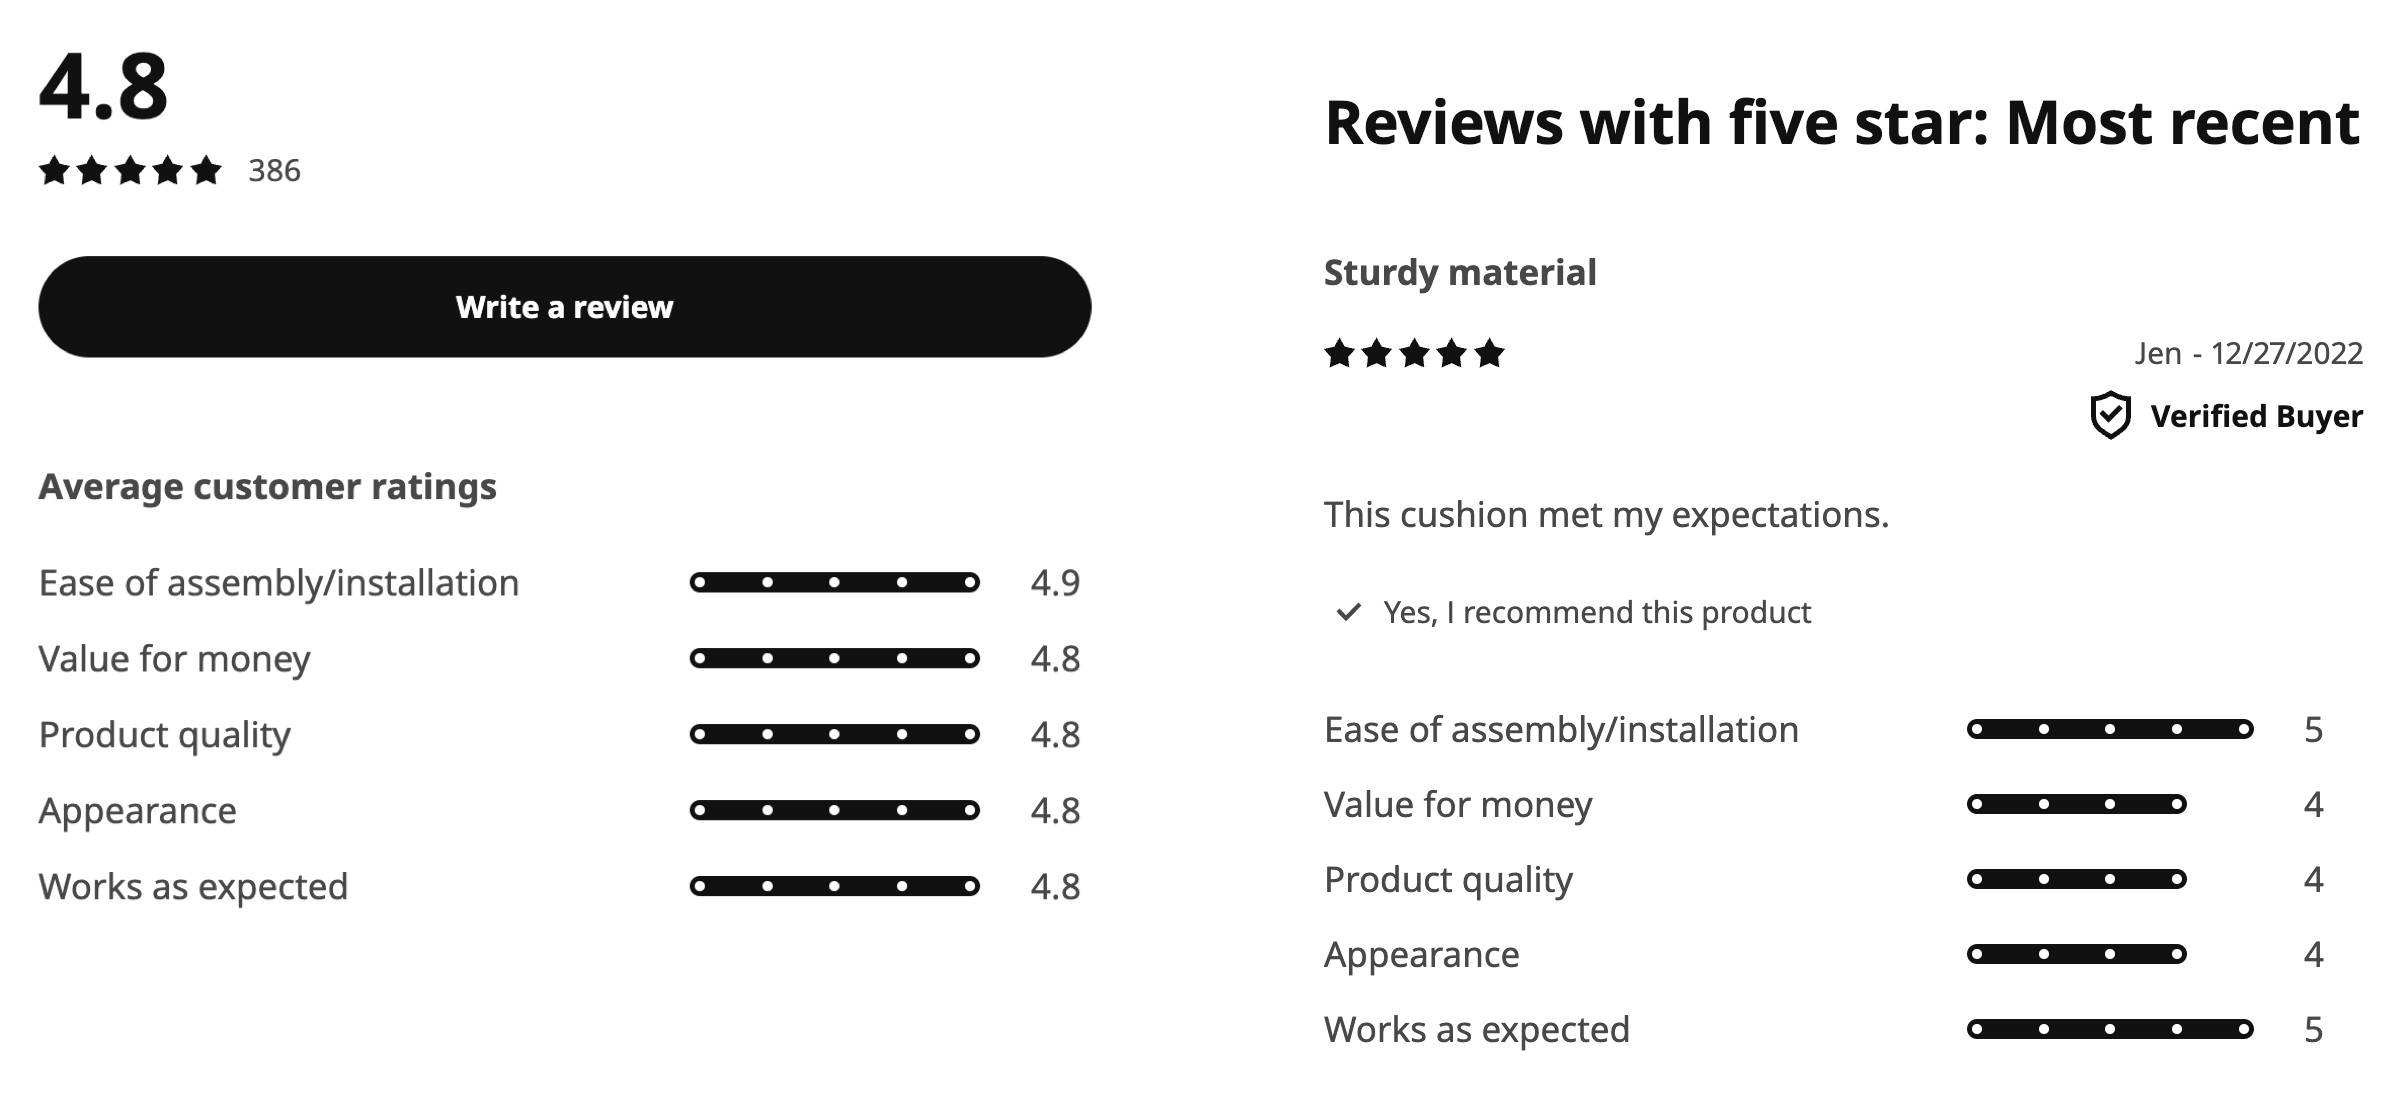
The idea is to ask reviewers to evaluate distinct qualities — appearance, build quality, value — and then calculate an average for each. Flipkart does this with attribute groups tailored to the product type. Its color coding distinguishes “good” from “bad” feedback, though a more accessible color palette would help, and there is currently no way to filter reviews by a specific attribute score.
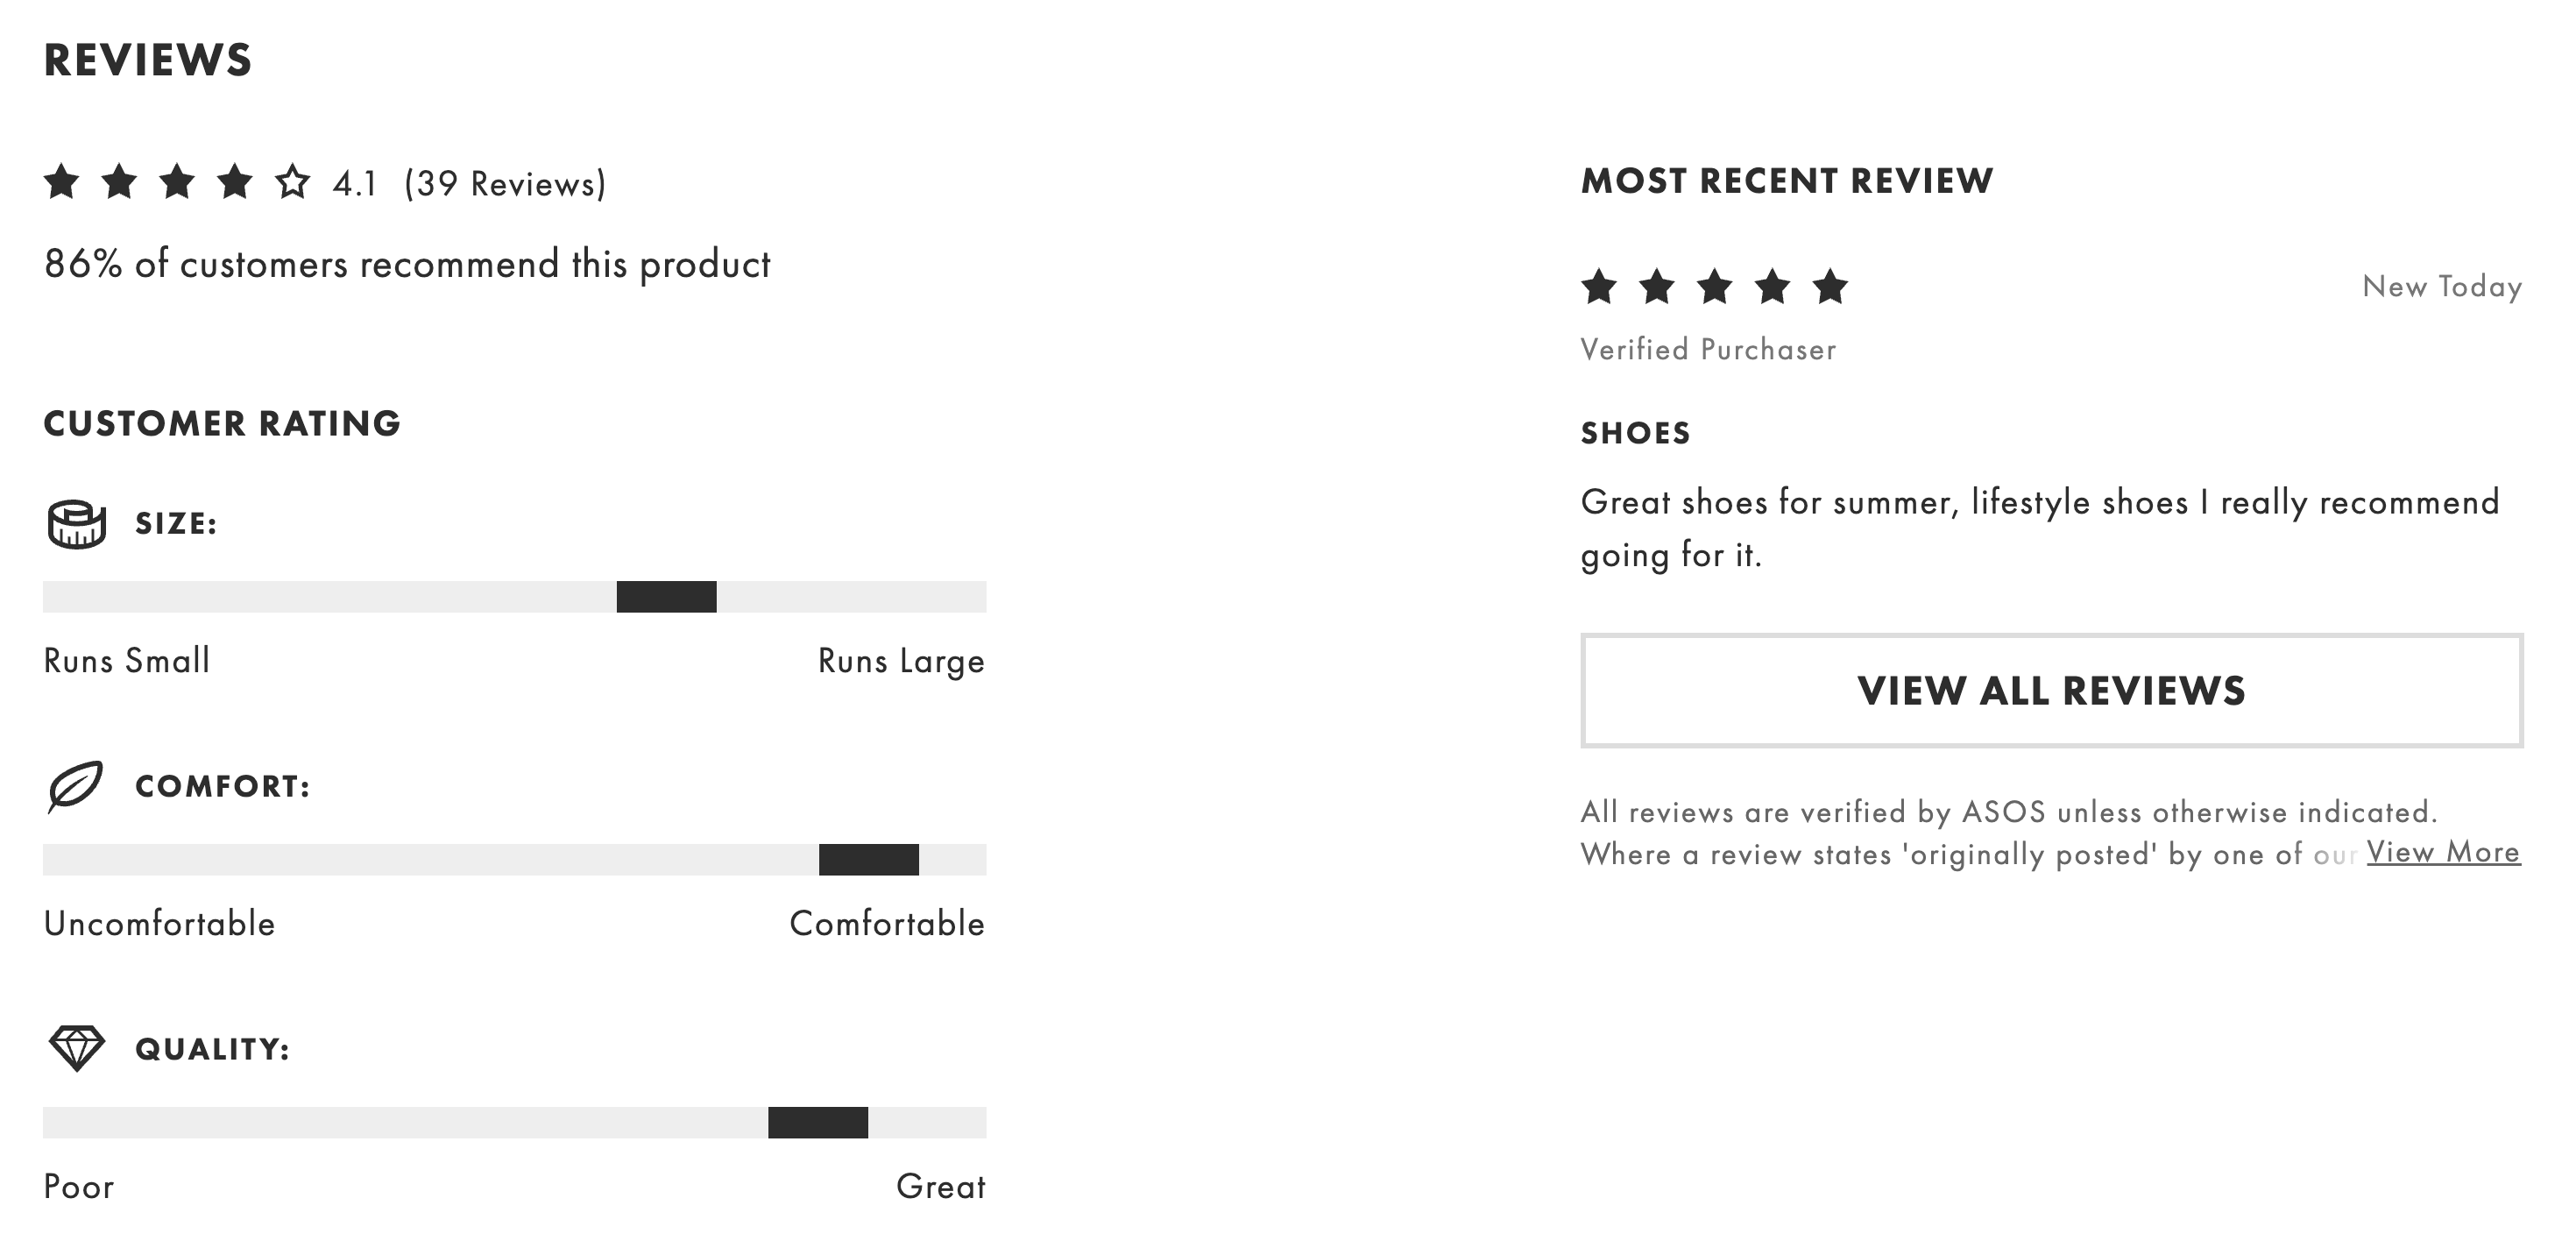
Adidas and LL Bean take a slightly different route, letting shoppers explore individual product qualities through a position on a scale or a separate distribution summary. Both formats communicate how a product performs on a single attribute at a glance.
Suggested Tags Surface Relevant Experiences
Attribute scores cannot capture everything. A well-crafted product might simply not suit certain customers, and that mismatch is rarely visible in a spec sheet. A workaround is to suggest relevant tags during review submission — phrases such as “great fit,” “great for kids,” or “easy to use.” Tags can also capture personal context like frequency of use, experience level, age range, or location, which helps future buyers find reviewers similar to themselves.
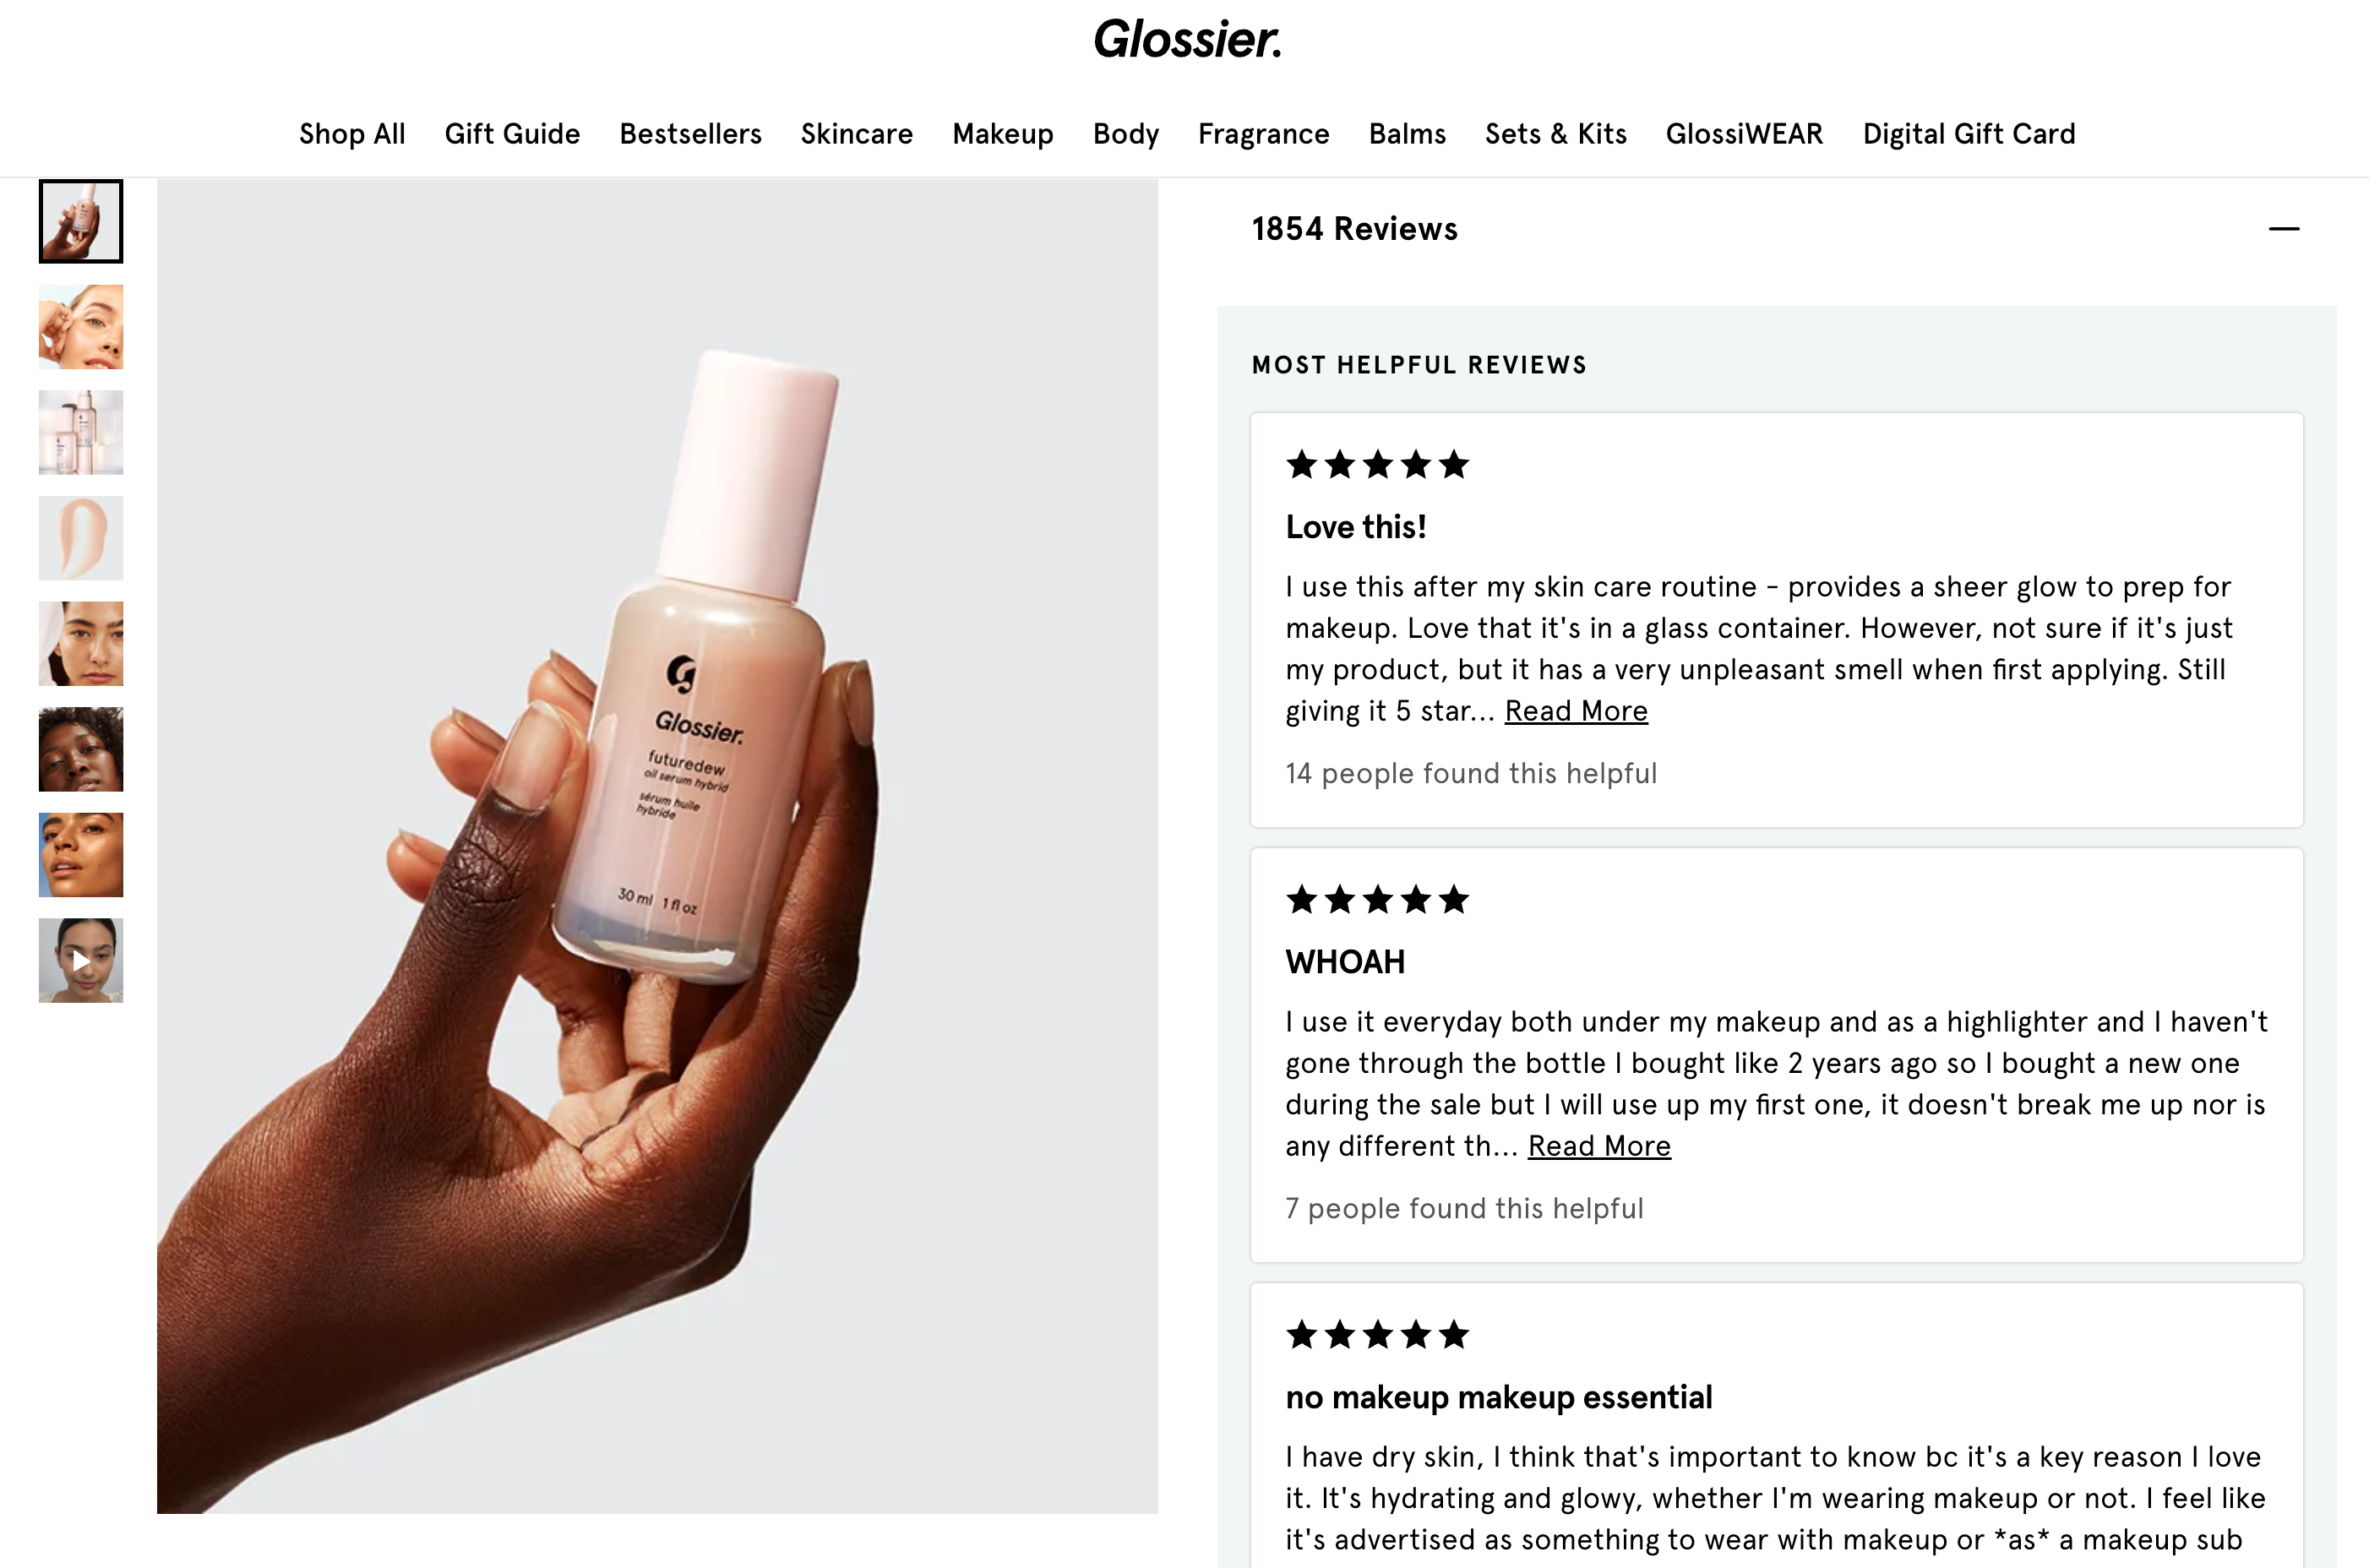
The tags can be tailored to product categories. Glossier and Sephora, for instance, ask about skin type, preferred look, scent, and shade for cosmetics. Once collected, these tags can act as additional rating filters, letting shoppers pull up reviews from people like them rather than relying on broad averages.
Recommendation Scores Add Social Proof
A simple question at the end of a review — would you recommend this product? — can yield a metric that resonates more than star ratings. Asos displays “86% of customers recommend this product,” which captures nuance that a 3-star rating cannot: a customer might not love a product for themselves yet still vouch for its quality.
An ideal recommendation score sits above 90%, with anything over 95% inviting skepticism. To boost the signal further, tie the number to a customer profile: “86% of customers (5+ years of experience, enterprise-level) recommend this product” is far more actionable for shoppers who match that group.
Pros and Cons Summaries Speed Up Evaluation
Shoppers still have to dig through reviews to separate the good from the bad. Automatically generated summaries that list pros and cons as bullet points can compress that effort. These high-level takeaway lists would be especially valuable on category listing pages, product pages, and comparison views, where buyers are weighing several options side by side.
Helpful-Vote Signals and Smarter Sorting
Not all reviews are equal — some are generic, some overly specific, and some just miss the mark. Asking customers to mark reviews as helpful and then surfacing the most-validated ones at the top of the list, with the vote count attached, shortens the path to relevant information and boosts perceived trustworthiness.
Filtering by star rating only gets a shopper so far. Bite lets users sort within a score range by review date, presence of photos or videos, and helpfulness. Glossier and Wayfair go further, allowing searches within reviews and offering autocomplete. Wayfair also shows how often a keyword appears in the review corpus, which gives a sense of what customers talk about most.
Personal Details Make Reviews Persuasive
Reviews gain credibility when they come from a real person with visible credentials or a public profile. Asking reviewers to include a name, location, age range, job title, links to social profiles, and a candid photo or short video — along with a product photo and optionally their employer’s logo — builds authenticity.
Customer photos are especially effective. Because many buyers distrust marketing imagery, unedited product photos from other customers deliver a realistic preview of what to expect. Reviews with personal details and images deserve a prompt encouraging submission and possibly a reward.
Checklist for a Robust Review System
A well-designed rating experience requires many elements to work together. At minimum, customers should be able to see or do all of the following:
- An average score with decimal places;
- The total number of ratings;
- A full distribution chart of ratings, including counts for intermediate values;
- Unedited customer product photos;
- Scores for individual attributes such as size, fit, and support;
- Tags and filters for quickly finding relevant reviews;
- Personal details on reviewers to identify those similar to them;
- The review date;
- Helpful-vote counts;
- The percentage of customers who recommend the product.
Building all of this is substantial work, but the payoff is considerable. A credible and complete review system often outperforms any single marketing campaign and keeps compounding in value, turning customers into a community that recommends the brand beyond the product page.