When AI tools began to take hold a few years ago, Figma set out to track their effect on design work—not just what the tools can do, but how ways of working and product strategy are shifting, and how people feel about it. Because transformations of this kind compound over time rather than arriving at once, the company launched a multi-year project built on annual surveys, an index derived from them, and interviews. The volume of material—thousands of data points and hundreds of transcripts—exceeded what a human team could process unaided, so the research team built custom AI tools to support its existing methods and to give everyone involved a common source of truth.
A six-dimension index benchmarked against itself
The centerpiece is a sentiment index: a single scale that captures how a group feels about something, in the manner of the University of Michigan's consumer sentiment index, which tracks confidence in the economy rather than the economy's actual performance. Figma asks participants about the past 12 months and about their expectations for the next 12, so that predictions can be compared with what actually happens. Respondents—designers, developers, and PMs—answer questions such as "Over the past 12 months, to what degree has AI affected your personal productivity and workflows?" Answers are mapped from 0 (no impact) to 100 (transformational). A score near 50 indicates AI has entered someone's job without fully reshaping it; scores approaching 100 indicate fundamental change.
Because AI affects aspects of work unevenly—an individual's productivity moves before a team's does—the survey covers six dimensions, informed by socio-technical systems theory and research on digital transformation. The same questions have been used for three years, allowing trends to be tracked in each area:
- Organizational goals: whether AI changes what companies prioritize and where they place bets
- Productivity and workflows: how people use AI for daily work such as exploration, prototyping, and coding
- Collaboration: AI's influence on how teams work together
- Project types: AI's role in what people actually build
- Products and services: whether companies sell AI-powered products
- Tools: how AI changes the tools people use
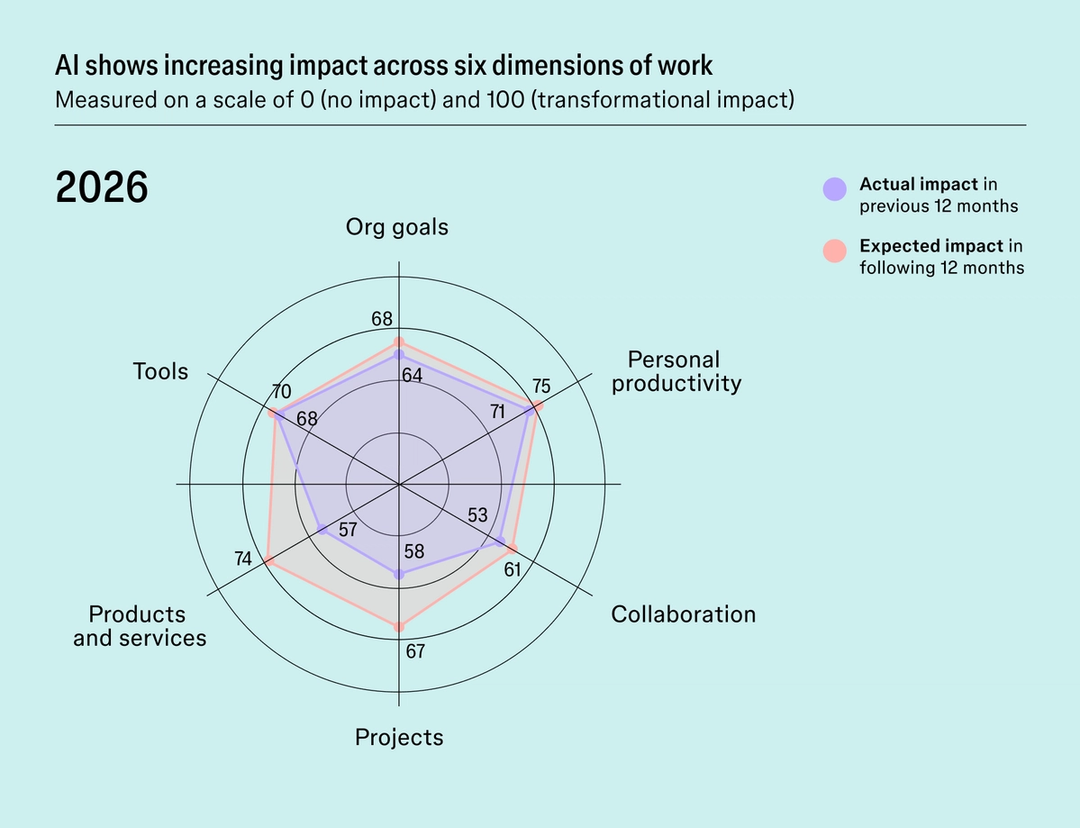
In 2026, every dimension exceeded the prior year's expectations by 10 or more index points. Collaboration nearly doubled, from 32 to 58, while personal productivity, projects, and products climbed from the 40s into the high 60s and 70s. The overall index reached 62 out of 100, nearly double its 2024 level.
Interviews conducted and analyzed by machine
Numbers alone don't tell the whole story, so the team tried an AI interview tool in which an AI moderator leads live conversations, asking clarifying questions and adapting to context in real time. The result was 639 AI-moderated interviews covering how AI has changed people's work, their concerns about the future, and organizational responses.
2026 interviews by the numbers
639 transcripts
2 million words
40,701 codes
11,846 total themes
553 recurring themes across participants
Off-the-shelf analysis tools the team had tried were opaque: without visibility into how a tool interprets data, there is no way to check its work. Figma therefore built an AI-powered version of thematic analysis—the standard method of reviewing every transcript, labeling ideas as codes, and synthesizing them into broader themes—with traceability at every step. Any theme, such as "AI increased iteration speed but introduced quality concerns," can be traced to the specific participants who mentioned it (47 in that example), their exact words, and the original transcripts.
The approach also addressed a weakness of manual coding: with hundreds of interviews, a human reviewer may code the 50th differently from the first as fatigue sets in and early patterns color later readings. The tool applied a consistent analytical lens to every interview. Rigor still had to be designed in—the system needed clear context on which methods to use, the desired granularity, how to handle conflicting themes, and how to trace themes back to transcripts. As MIT economist David Autor's term "expertise re-intermediation" suggests, AI doesn't eliminate expert judgment; it makes that judgment scalable.
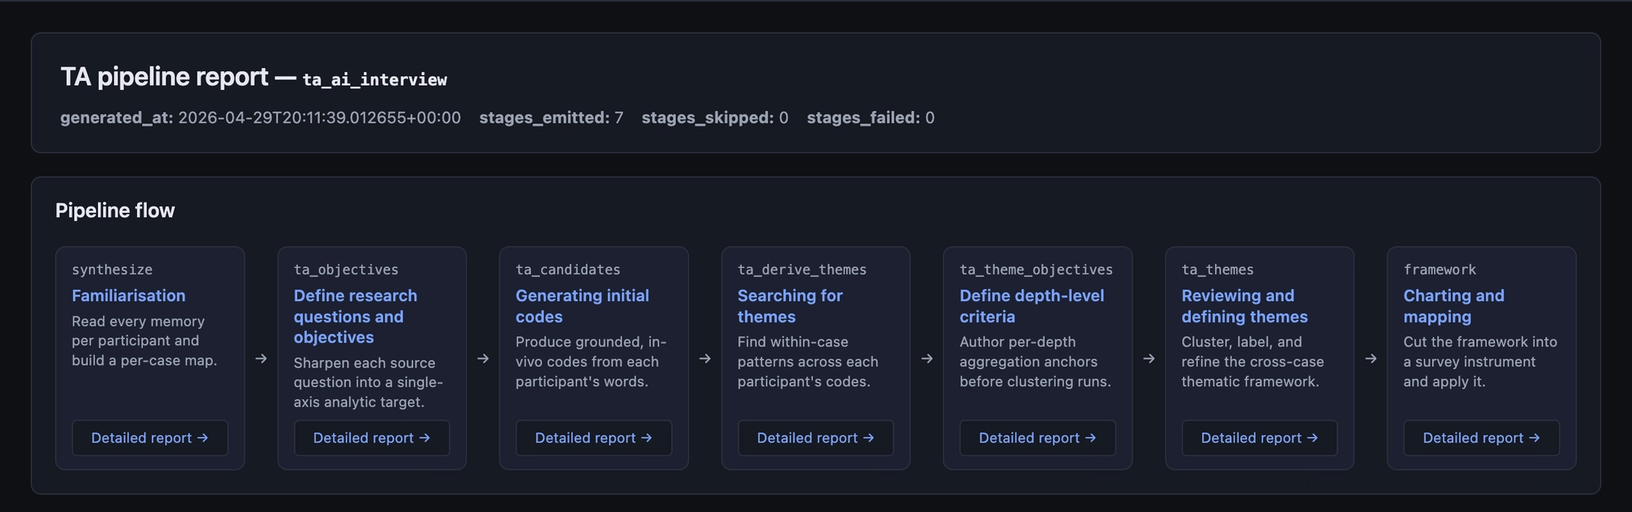
A dashboard as shared infrastructure
The analysis created a second problem: tens of thousands of data points and hundreds of themes living in notebooks and text files that non-researchers would struggle to navigate. Reporting spanned researchers, writers, marketers, and analysts, all of whom needed access without waiting for someone to pull numbers or export charts. The team coded an internal dashboard combining three years of survey results, interview analyses, and interactive charts—trends, breakouts by role and region, and deep dives into each index dimension. Raw analysis was converted into a self-contained HTML document, then iterated a few times using Figma's MCP server: layout and interaction patterns were designed in Figma, the initial code structure generated, the output refined in Figma for styling, and the result tweaked until it worked. The site was deployed with Payload CMS, which provided version control, access management, and easy sharing.
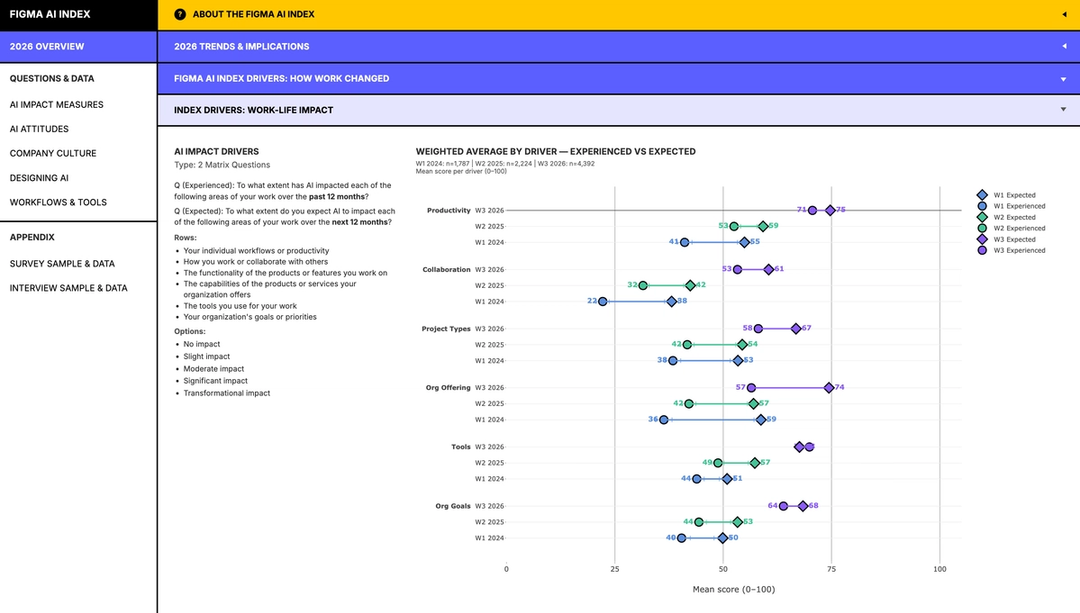
The point of the dashboard was less storage than coordination: rather than each person forming an independent mental model from scattered emails and slide decks, the whole team worked from one source. Even before the analysis was complete, AI's impact was visible to the team; the index was simply how they put a number on it.