When the Network Buckles Under the January Return
The first working day of 2021 began quietly for Slack’s global user base, and for most of the company’s own staff. That calm broke during the Americas’ morning when an external monitoring service alerted on-call engineers to creeping error rates. Initial triage showed the problem worsening, and the standard incident process kicked in. Almost immediately, the investigation hit a snag: the internal dashboarding and alerting service itself went dark, forcing the team to page the monitoring crew and work around the loss of its primary diagnostic tools.
Without dashboards, responders fell back on internal consoles, status pages, command-line tools, and direct queries against the still-healthy metrics backends. While this was less efficient than the usual pre-built queries, it was enough to reveal a broader pattern of network degradation. AWS, Slack’s main cloud provider, was brought in to help. At 6:57 am PST, Slack was still up, but message success rates had dropped to 99% from the usual 99.999%—a clear signal that something was deeply wrong.
A Perfect Storm at the 7 AM Peak
Slack’s traffic follows a rhythm of mini-peaks at the top of each hour and half hour, driven by reminders and external automation from around the world. The infrastructure is normally scaled to accommodate these bursts, but the 7:00 am PST peak collided with the underlying network faults. The result was saturation of the web tier. Rising load increased packet loss, which inflated latency for calls to backends, which in turn saturated system resources in the web tier. Slack became unavailable.
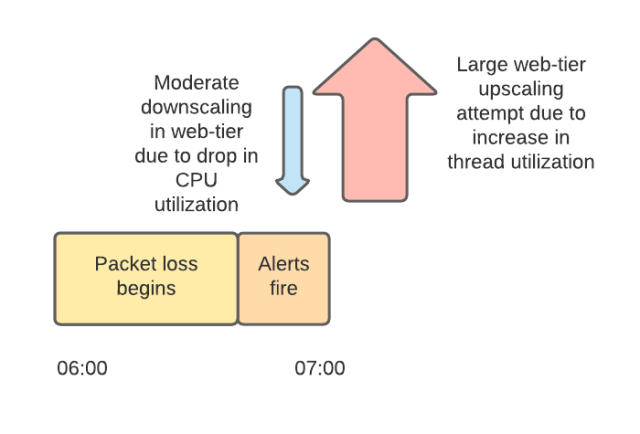
Two independent failures compounded the situation. First, automation flagged instances as unhealthy when they could not reach their dependencies, triggering an automatic replacement wave. Second, the autoscaling system began downscaling the web tier. Investigators, already working without monitoring tools, found their SSH sessions cut short as the very instances they were debugging were deprovisioned. Downscaling was disabled to preserve capacity and allow the investigation to continue.
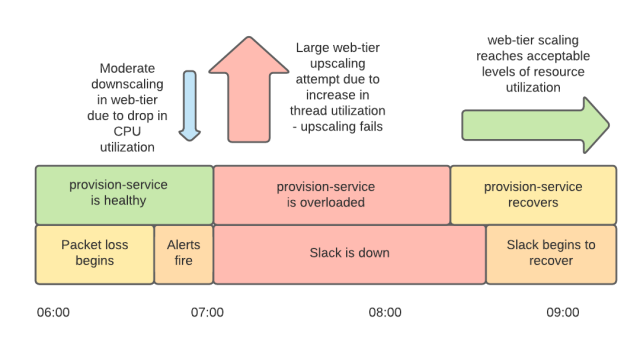
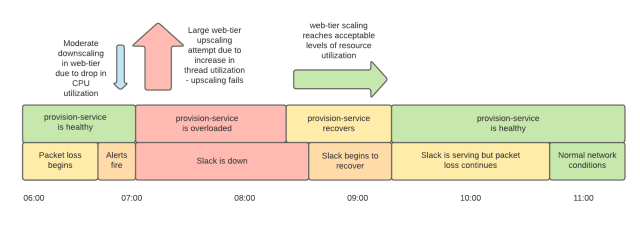
The autoscaling decisions were based on two signals: CPU utilization and Apache worker thread usage. The network problems had driven down CPU utilization, which initially prompted the downscale. That was quickly followed by a surge of upscaling as thread utilization rose in response to longer waits for backend responses. Between 7:01 and 7:15 am PST, the system attempted to add 1,200 servers to the web tier—a scale-up that would fail
Why the Scale-Up Failed
The scale-up was handled by a service called provision-service, which is responsible for configuring and testing new instances along with other infrastructure housekeeping. Like everything else at the time, it was communicating with its internal dependencies and AWS APIs over the degraded network. Longer connection and response times meant the service was consuming more system resources than usual. The simultaneous provisioning load pushed it past two bottlenecks—most notably the Linux open files limit, and also an AWS quota limit.
While provision-service was down, the web tier remained under capacity. A large number of instances had been created but were not fully provisioned and could not serve traffic. These broken instances also drove the web tier’s autoscaling group against its pre-configured maximum size limits, which are normally multiples of peak serving capacity. Responders were left to clear the broken instances manually while others continued chasing the root cause of the connectivity issues.
Further compounding the problem was the fact that the monitoring dashboards could not be restored: provisioning new dashboard instances depended on the same overloaded provision-service. It was not until roughly 8:15 am PST that the service was back in operation, at which point healthy instances began to enter service and conditions improved.
Recovery Through Panic Mode and Circuit Breakers
By 9:15 am PST, enough web tier hosts were functional to serve traffic, although the network was still experiencing elevated packet loss. The load balancing tier continued to report high rates of health check failures to web application instances. Slack’s load balancers, based on Envoy, include a “panic mode” feature that distributes requests across all instances when a significant percentage fails health checks. This, combined with client retries and circuit breaking, allowed Slack to return to a degraded but operational state.
Full recovery was still hours away. The unhealthy network meant the infrastructure needed more instances than usual to handle traffic, and provisioning those instances took longer than normal. It took an hour to bring error rates down to a low level. Around the time Slack had recovered, AWS engineers identified the trigger: a part of the AWS networking infrastructure had become saturated and was dropping packets.
The Root Cause: A Transit Gateway Scaling Gap
Slack’s cloud architecture has evolved from a single AWS account to a model where services run in separate accounts and dedicated Virtual Private Clouds (VPCs), giving greater isolation and more granular control over operator privileges. These VPCs are linked through AWS Transit Gateways (TGWs), which act as central hubs. On January 4th, one of these Transit Gateways became overloaded. While TGWs are managed by AWS and designed to scale transparently, Slack’s annual traffic pattern presented a unique challenge.
Traffic drops over the holiday period as users disconnect. On the first Monday back, client caches are cold and pull down significantly more data on the first connection. Slack’s own serving systems are built to scale quickly for such peaks, but the Transit Gateways did not scale fast enough to keep pace with the sudden demand. AWS engineers, alerted by their own internal monitoring, manually increased the TGW capacity. By 10:40 am PST, the change had rolled out across all Availability Zones, and the network, error rates, and latency returned to normal.
Lessons and Preventative Measures
Slack’s post-incident review points to several concrete steps. First, monitoring tools are being made more independent of the main infrastructure. The dashboard and alerting services failed because they ran in different VPCs from their backend databases, relying on the degraded Transit Gateway. Running these instances in the same VPC as their databases will remove that dependency.
Second, while provision-service had been load tested in the past, this event exceeded previous scale-ups by an order of magnitude. Regular load testing will be continued and expanded. Finally, the health-checking and autoscaling configurations will be reevaluated to prevent the system from inadvertently overloading provision-service again during extreme network disruptions.
The incident was a stark reminder that infrastructure dependencies can surface in unexpected ways, and that the systems meant to scale automatically can still hit limits when conditions are pathological. AWS has committed to reviewing the TGW scaling algorithms for large packet-per-second increases. Slack, meanwhile, has set a reminder to request a preemptive upscaling of its Transit Gateways at the end of the next holiday season—a simple acknowledgement that even fully automated systems sometimes need a nudge.


