The morning everything slowed down
Slack suffered a significant outage on February 22, 2022, when many users, including our own incident responders, found themselves unable to connect. What initially looked like a single-point failure turned out to be a textbook cascading failure, driven by a complex interaction between Slack’s application logic, its Vitess datastores, the Memcached tier, and the service discovery system. It took a combination of traffic throttling and query optimization to restore service.
The incident began at roughly 6 a.m. Pacific Time. All at once, support tickets, internal user reports, and engineering pages signaled that clients were struggling to boot — the process of fetching channel lists, preferences, and recent messages from the server to initialize a session. Booting is a prerequisite for using Slack, so when boot requests fail, users see an error page instead of their workspace.
The problem was a heavily loaded Vitess keyspace that contained channel membership data, sharded by user. Slack uses multiple Vitess keyspaces to isolate query workloads, but this particular keyspace was a bottleneck: much of the load came from a query listing Group Direct Message (GDM) conversations by user. That query is normally served by caching, so a sharp increase in its frequency indicated the cache tier was no longer doing its job.
Balancing boot requests against database health
Slow boot requests were consuming resources in the database tier and blocking queries from already-booted users. The response team throttled client boot requests to reduce database load, accepting that users without an active client session would be unable to connect. In exchange, users with booted clients would see relatively normal service, and the freed capacity would let the caches refill.
The throttle worked — errors dropped and performance for connected users stabilized. However, the team was using a self-imposed, high-load state as their baseline. An initial attempt to raise the boot limit overshot, pushing database load back to unsustainable levels. The limit was tightened again, and then raised much more carefully.
Root cause: Consul agent restarts and cache disruption
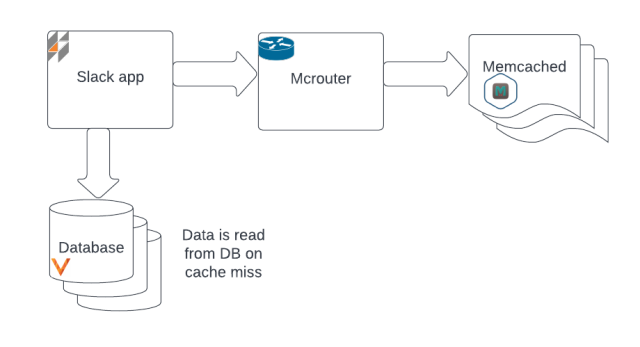
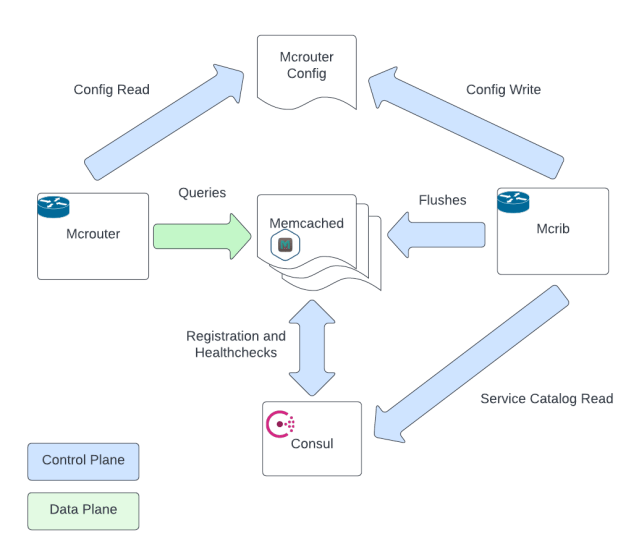
The systems involved in the outage included the web application, the Vitess-backed datastores, Memcached for low-latency data access, and Mcrouter as the consistent-hashing router for the cache fleet. Keeping the routing tables fresh was the job of Mcrib, a relatively new control plane that monitors Consul service discovery and assigns spare memcached instances to the ring when active ones become unavailable. When an instance rejoins after a period of absence, Mcrib flushes it before promotion to avoid serving stale data. Mcrib was introduced to replace a lock-based mechanism that struggled with contention, and it solved that problem.
The trouble began two weeks earlier, during earlier stages of a Consul agent rollout that upgraded the binary on each host and then restarted the service. The restart step was intentionally sequential to avoid a wave of coordinated deregistrations. Each agent restart deregisters its node from the service catalog, and then re-registers it. The February 22 step, moving to a 75% rollout state, caused the managed cache nodes to leave and rejoin the catalog in a steady stream. Mcrib treated these as failures and continuously rotated in spare nodes to maintain the hash ring configuration.
Because a freshly promoted memcached instance starts empty, the overall cache hit rate dropped. The consequences reached the boot path almost immediately. A GDM membership lookup, sharded by user ID, is inefficient without caching — the query must run on every shard in the keyspace. That “scatter query” approach works when the data is in the cache; once it is not, each cache miss results in a query to all shards. One missing channel in a GDM triggers a full datastore scan. With a significant portion of the cache unavailable, most users needed to query every shard, and the datastore was eventually overwhelmed.
Why the failure cascaded
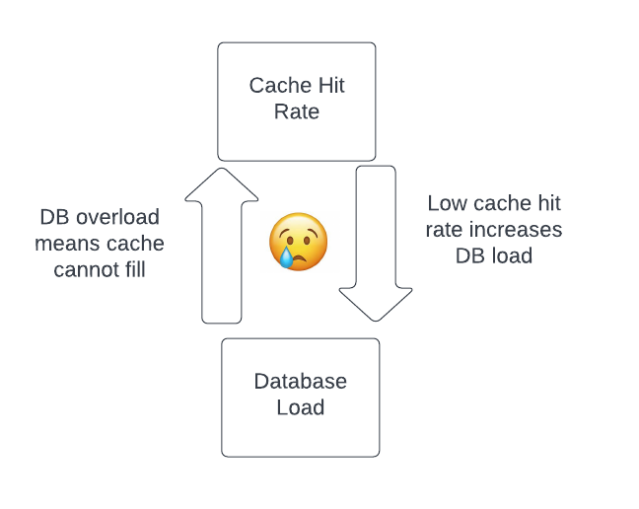
The system has two distinct stable states. In a healthy state, cache hit rates are high, database load is low, and there is slack to fill any cache gaps.
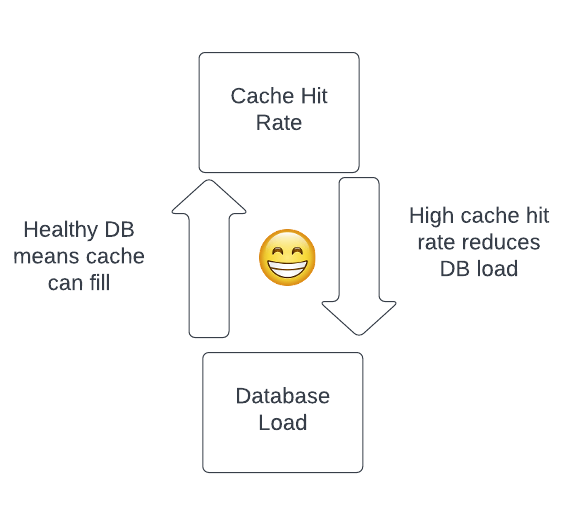
The destabilizing conditions that pass the tipping point, however, create an inverse loop: lower cache hit rates raise database load, and subsequent cache fills begin timing out, keeping hit rates low indefinitely.
Client retries made the situation worse. Slack clients retry automatically with exponential backoff and jitter, but in an overload condition, even successfully scheduled retries add to the database pressure.
The response team paused the Consul restart during only a brief moment early in the incident, before the link between the maintenance and the load pattern was confirmed. At that point, the damage was already underway, and breaking the failure loop required more deliberate intervention. The biggest win was changing the GDM membership query to read only the missing rows from Vitess instead of re-running the full scatter query on every cache miss, and to read from replicas rather than primaries where possible. That opened the door for the caches to refill and for database load to become tractable again. Only then could the team safely raise the boot rate limit back to normal levels.
What February 22 Taught Us
Viewed from the outside, the sequence of events that led to the February 22 outage can look almost inevitable — a tidy chain of performance bottlenecks, cascading failures, and a warm-cache dependency set off by routine changes. In retrospect, it is easy to stamp such incidents with the label “predictable.” But predictions are far easier after the fact than before it, and the broad categories of failure are much simpler to name than the specific interactions that produce a given cascading failure. The incident involved multiple system boundaries, several of which were modified recently. Complexity and change are unavoidable in large software systems — and both inevitably raise the risk of unexpected behavior.
The outage nonetheless yielded meaningful lessons. The interplay between Consul and the caching architecture is now understood much more broadly across the organization. We have already altered the procedure for Consul rollouts so that upgrades should no longer trigger this specific failure mode.
A notable twist in this story is that the new Mcrib component did not contribute because it was flawed or slow — the opposite is true. Mcrib detected downed memcached instances and repaired cache configuration faster and more efficiently than the previous system. That very efficiency increased churn in the cache tier and made the outage more severe than it would have been otherwise. Mcrib is objectively a better way to produce memcached configurations, but its speed reduced the overall safety of the broader system.
The incident also surfaced additional risks. A short network partition or outage affecting cache nodes could easily trigger the same cascading failure as the Consul agent restarts — perhaps even worse, as it would be more coordinated across the fleet. We are rolling out changes to a part of the Mcrib control loop to guard against that scenario.
One of the offending queries — a high-volume scatter query — has been modified to read from a table sharded by channel. We have also reviewed other database queries fronted by the caching tier to identify any additional scatter queries that could pose similar risks. Longer-term work is underway to explore other methods of strengthening the resilience of the caching tier.
In the aftermath of incidents, I often return to Dr. Richard Cook’s short and influential paper “How Complex Systems Fail.” On this occasion, the fourth of its eighteen sections rang truest:
“Complex systems contain changing mixtures of failures latent within them. The complexity of these systems makes it impossible for them to run without multiple flaws being present. Because these are individually insufficient to cause failure they are regarded as minor factors during operations. Eradication of all latent failures is limited primarily by economic cost but also because it is difficult before the fact to see how such failures might contribute to an accident. The failures change constantly because of changing technology, work organization, and efforts to eradicate failures.”
What remains in Dr. Cook’s box of complex systems failure is not hope, but human expertise and adaptability. We share this story to deepen our own understanding of system failures and to contribute to the broader industry. We have learned a great deal from other people’s accounts of distributed-systems failure, and we hope you can take something useful from ours. We are also grateful to our users for their patience during the disruption.