
Meta’s MemLab: Automating JavaScript Memory Leak Detection
Memory leaks are a silent performance killer in web applications. Unlike a slow API response or a visual glitch, a leak consumes memory incrementally across a session, degrading responsiveness over time without any immediately obvious trigger. When Meta rebuilt Facebook.com as a client-side rendered single-page application and applied the same architecture to Instagram and Workplace, engineers saw memory usage and out-of-memory crashes climb. To address this, Meta built and has now open-sourced MemLab, a JavaScript memory testing framework that automates leak detection and root-cause analysis.
The core problem: Hidden references and unbounded growth
JavaScript runtimes rely on garbage collectors, which makes leaks easy to overlook. They arise when code keeps an unintentional reference to an object that should be unreachable. For example:
var obj = {};
console.log(obj);
obj = null;
In Chrome, this snippet leaks obj even after setting the reference to null, because the browser keeps an internal reference for console inspection. Beyond true leaks, memory can also grow linearly without an explicit leak: client-side caches without eviction policies and infinite scroll lists without virtualization both accumulate memory boundlessly during a session.
Traditional defenses—manual heap analysis through Chrome DevTools—don't scale against a high volume of daily code changes. Meta needed an automated system to catch regressions both before and after code landed in production, similar to its existing tooling for page load time and JavaScript bundle size.
How MemLab finds leaks
At its core, MemLab runs a headless browser through defined test scenarios, then diffs JavaScript heap snapshots to identify objects that were never released. Detection happens in a structured pipeline:
Heap diffing
MemLab automates a browser via Puppeteer and visits pages in sequence to compare lookups:
- Navigate to a baseline tab (A) and capture heap
SA. - Navigate to the target page (B) and capture heap
SB. - Return to page A and capture heap
SA'.
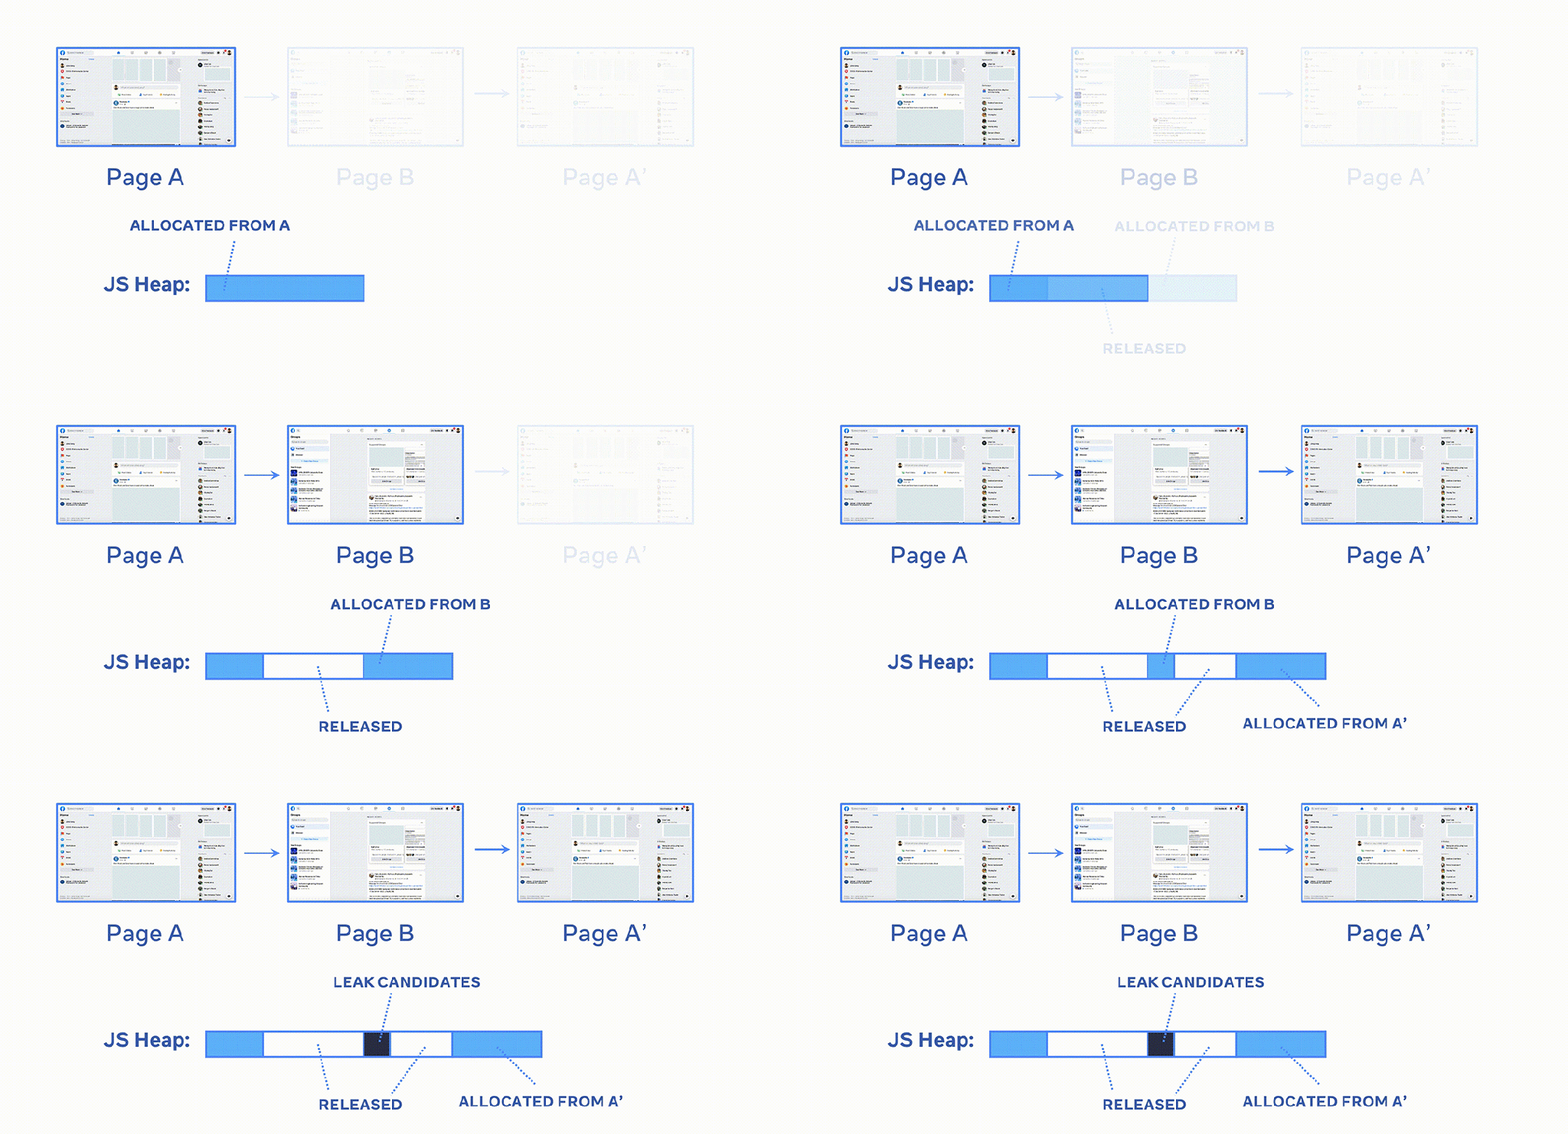
When navigating away from a page, most of its allocated memory should be freed. Objects allocated on page B that still exist after returning to page A—formally, the superset (SB \ SA) ∩ SA'—are potential leaks.
Refinement and retainer trace generation
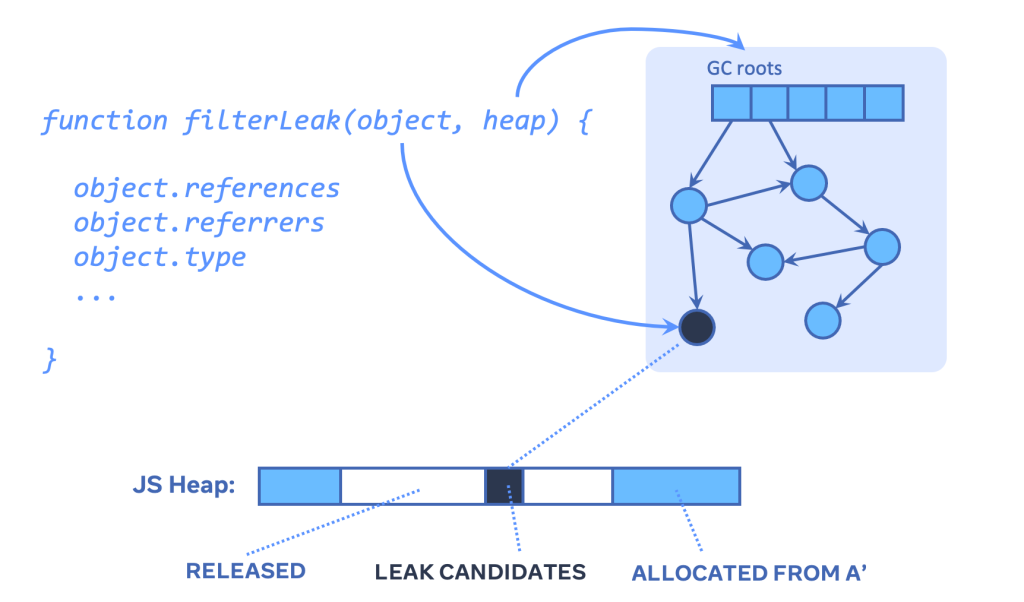
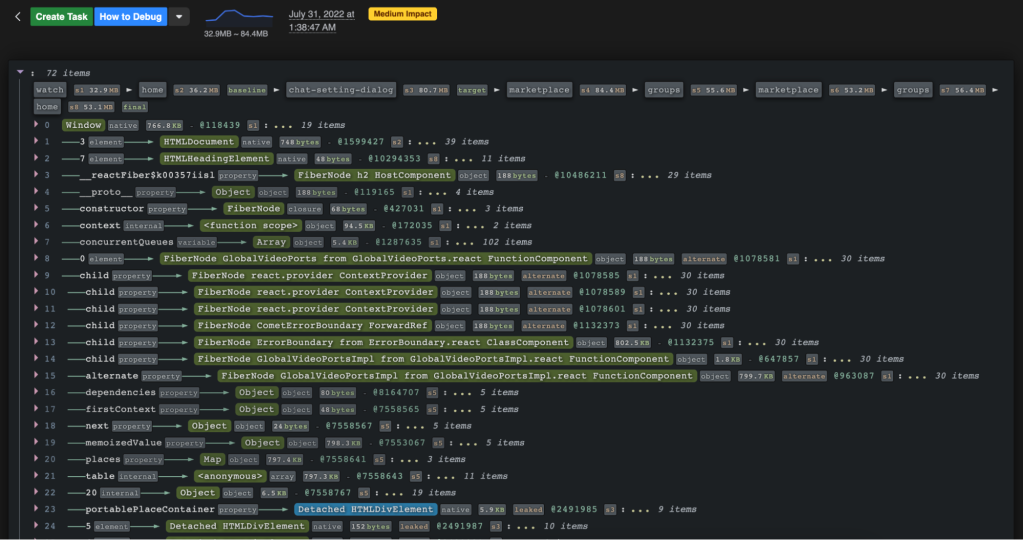
To avoid noise, the leak detector applies framework-specific filtering. For instance, React Fiber nodes (internal virtual DOM structures) are expected to be released after tab cleanup. For each genuine leak candidate, MemLab traverses the heap graph to generate a retainer trace: a reference chain from the GC roots to the leaked object. Following this chain pinpoints the reference that should have been set to null but wasn't.
Trace clustering and reporting
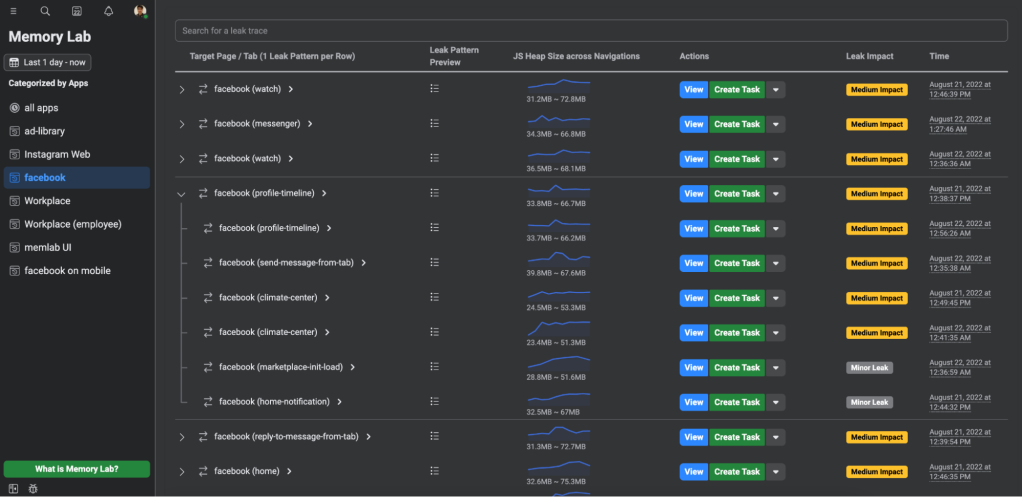
A single interaction can leak thousands of objects. MemLab clusters retainer traces that are structurally similar, presenting one representative trace per leak group, enriched with dominator node and retained size data.
At Meta, MemLab runs at regular intervals during the day, feeding findings into an internal dashboard that categorizes clustered traces. Developers can click through a trace to inspect object properties. That dashboard is not part of the open-source release, but its functionality can be reproduced in any CI/CD pipeline.
Testing scenarios and configuration
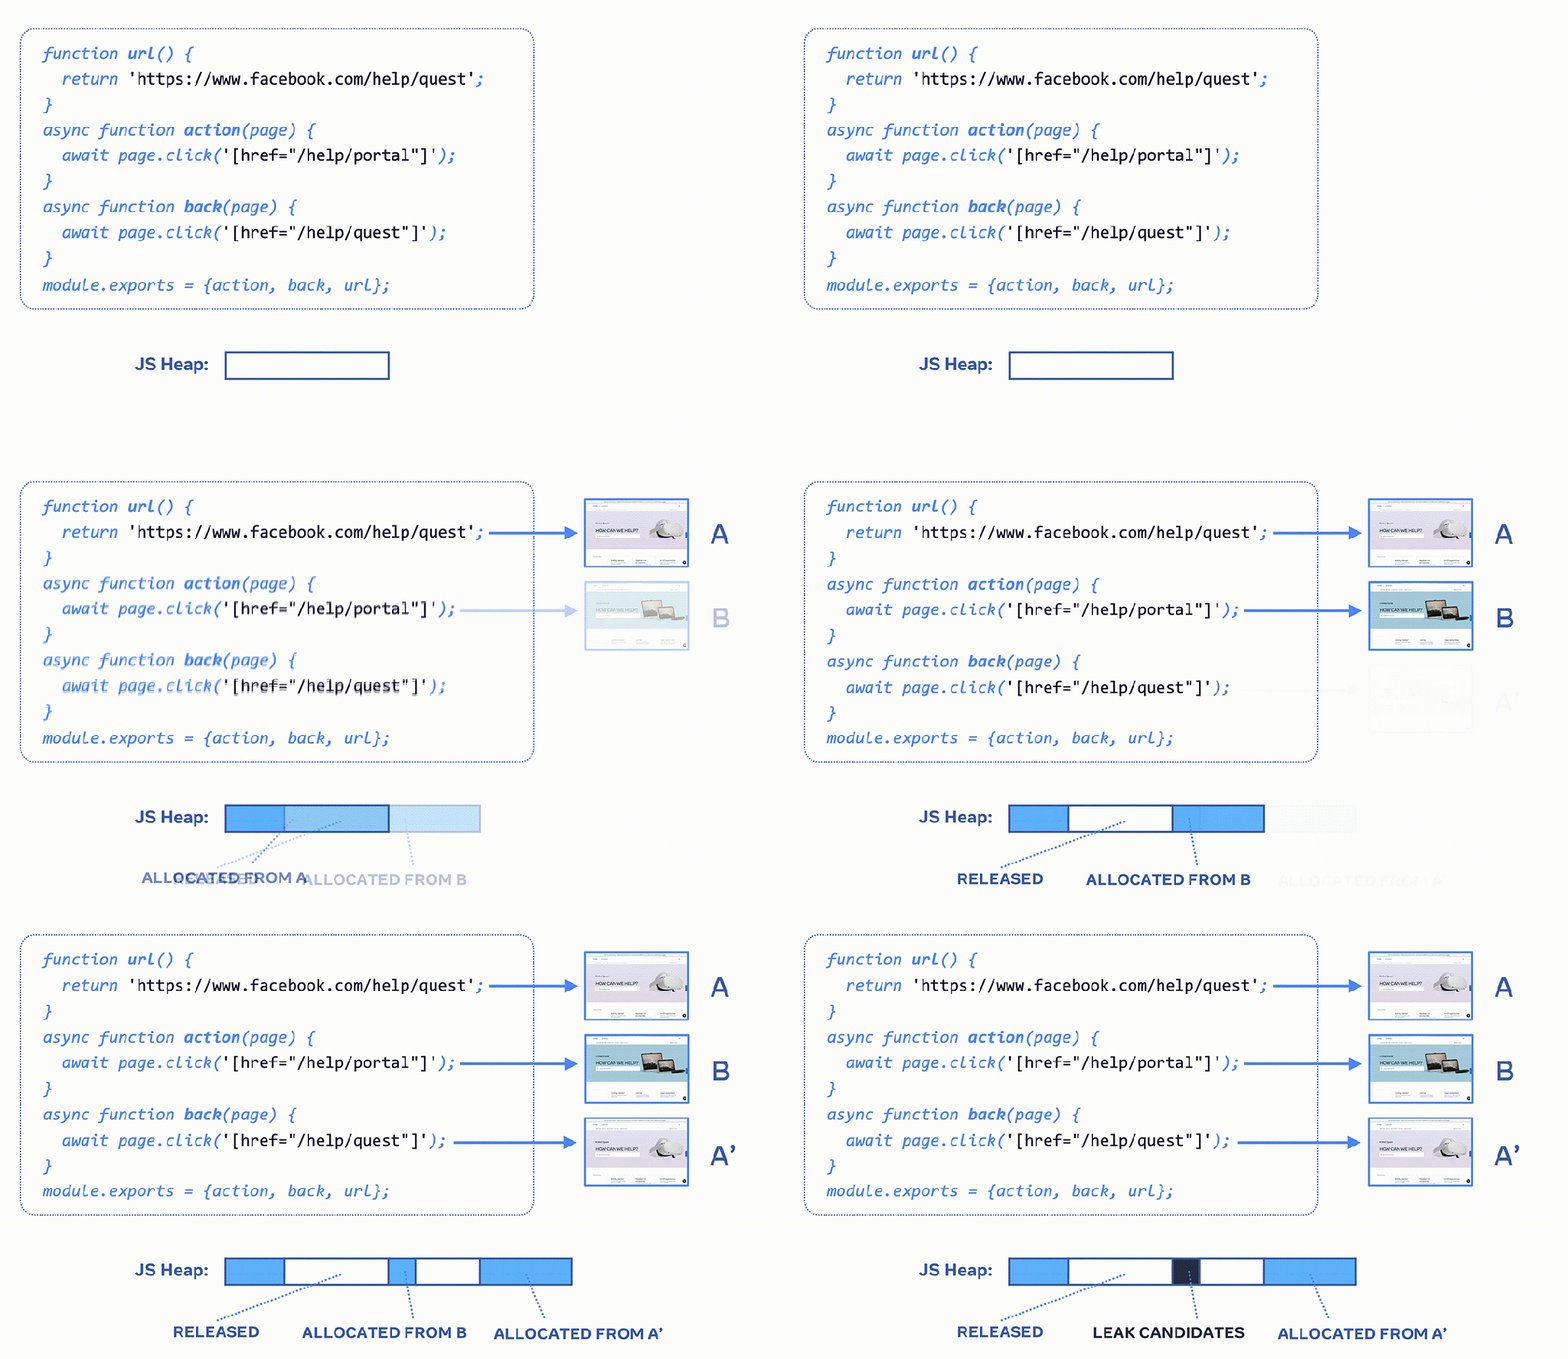
For in-browser leak detection, the developer only supplies a test scenario file that defines interactions with the target page by overriding three callbacks, using the Puppeteer API and CSS selectors. MemLab handles the heap diffing, leak refinement, and result aggregation automatically.
For custom analysis, MemLab supports a custom leak detector as a filter callback. Each leak candidate object is passed to the callback, which traverses the heap to make its decision. The built-in detector, for example, follows the return chain of a React Fiber node and checks if it is still attached to the Fiber tree.
Memory-efficient heap graph API
To analyze heap state thoroughly, MemLab exposes a graph view of the JavaScript heap. Every JavaScript or native object is a graph node; every reference is an edge. Real application heaps are large, so the graph is designed to be both memory-efficient and easy to traverse without knowing V8’s snapshot file structure.
Graph nodes are virtual—they are not interconnected via live JavaScript references. When analysis code traverses the heap, the graph builds the touched portions just-in-time and can deallocate them just as easily, because no persistent references link the nodes together. A single heap graph view can be loaded from snapshots taken from Chromium-based browsers, Node.js, Electron, or Hermes. That flexibility supports complex queries, such as counting alternate Fiber nodes from incomplete concurrent renders or calculating the total retained size of unmounted React components.
import {getHeapFromFile} from '@memlab/heap-analysis';
const heapGraph = await getHeapFromFile(heapFile);
heapGraph.nodes.forEach(node => {
  // heap node traversal
  node.type
  node.references
);
Memory assertion and optimization tooling
Developers building Node.js programs or Jest tests can also load a heap graph view of their own process state to write memory assertions, checking for problematic growth during the test itself.
import type {IHeapSnapshot} from '@memlab/core';
import {config, takeNodeMinimalHeap, tagObject} from '@memlab/core';

test('memory test', async () => {
  config.muteConsole = true;
  const o1 = {};
  let o2 = {};

  // tag o1 with marker: "memlab-mark-1", does not modify o1 in any way
  tagObject(o1, 'memlab-mark-1');
  // tag o2 with marker: "memlab-mark-2", does not modify o2 in any way
  tagObject(o2, 'memlab-mark-2');

  o2 = null;

  const heap: IHeapSnapshot = await takeNodeMinimalHeap();

  // expect object with marker "memlab-mark-1" exists
  expect(heap.hasObjectWithTag('memlab-mark-1')).toBe(true);

  // expect object with marker "memlab-mark-2" can be GCed
  expect(heap.hasObjectWithTag('memlab-mark-2')).toBe(false);

}, 30000);
Beyond leak detection, MemLab ships a set of built-in CLI commands and APIs to uncover optimization opportunities:
- Heap break down by object shapes, such as {arguments, postRun, preRun, quite, thisProgram, …}, catches memory hogs from object literals that constructor-name classification (e.g.,
Object) would miss. - Continuous growth detection takes a series of heap snapshots and finds objects or shapes whose size grows without limit over time.
- Duplicate string detection finds native strings that share identical values but aren't interned by V8, wasting memory.
Case study: React Fiber node cleanup
React builds an internal Fiber tree for rendered components. Although it looks like a tree, it is actually a bidirectional graph that strongly connects Fiber nodes, component instances, and associated DOM elements. React keeps the root of this graph referenced for the component's lifetime. When a component unmounts, React disconnects the host root from the rest of the tree, allowing the remainder to be garbage collected.
The problem with a strongly connected graph is that any single outside reference prevents the entire graph from being collected. For instance, caching a component at the module scope level keeps the associated Fiber tree and detached DOM elements alive indefinitely.
export const Component = ((
  <List> ... </List>
): React.Element<typeof List>);
This also affects more than just React's data structures. Hooks and their closures can keep references to a wide range of other objects. As a result, a single leaking component can cause a memory leak of a substantial portion of the page's object graph.
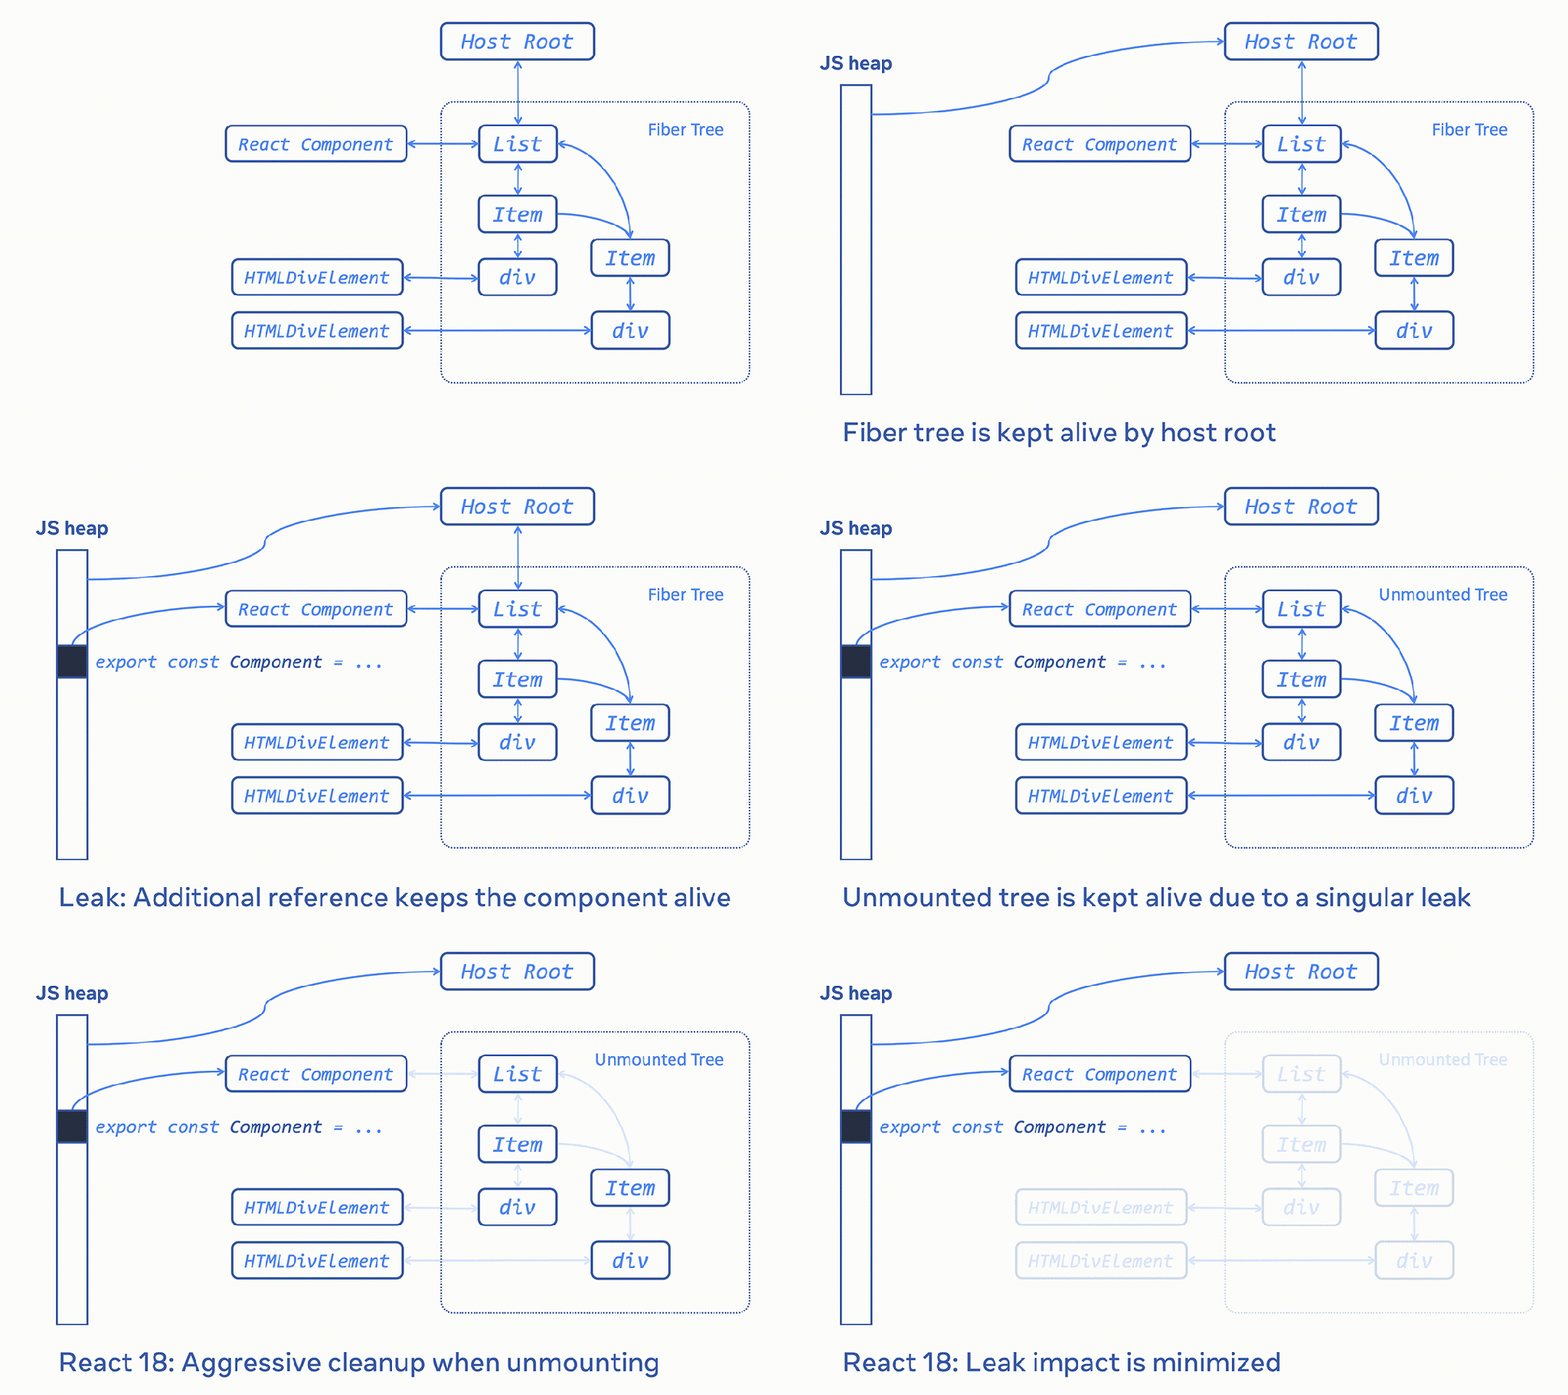
To limit this cascading effect, Meta added a full traversal that aggressively cleans up the tree when a component unmounts. This change landed in React 18, thanks to Benoit Girard and the React team. The cleanup makes it easier for the garbage collector to reclaim an unmounted tree, bounding accidental leaks to a smaller size. On Facebook, this fix reduced average memory usage by almost 25 percent. Sites that upgraded to React 18 saw similar improvements. The team initially worried the extra work would slow down unmounting, but the reduction in memory usage resulted in a significant performance win.
Case study: Relay string interning
Using MemLab's heap analysis APIs, the team found that strings accounted for 70 percent of the heap. Half of those strings had at least one duplicate instance. V8 does not always perform string interning, the optimization that deduplicates strings with identical values.
Further analysis of duplicated string patterns and retainer traces showed that a large share of this memory was taken by cached key strings in Relay. Relay generates cache keys for fragments through duplication, serialization, and concatenation. Those keys are then copied and concatenated again for cache keys of other Relay resources. By working with the Relay and React Apps teams, Meta optimized these cache keys by interning them and shortening overlong keys on the client side.
This optimization lets Relay cache more data on the client, which is particularly valuable when RAM is limited. The team observed a 20 percent reduction in both memory p99 and OOM crashes, along with faster rendering and improved user experience.
Getting started with MemLab
MemLab is now available as an open source project. You can install it via npm or build it from the GitHub repository.
npm i -g memlab
A quick start guide is available for developers who want to try it on their own projects. The team is interested in hearing how the community uses the tool, particularly the use cases and insights that emerge.


