
A logging engine purpose-built for AI training
Logarithm is Meta's internal, hosted, serverless, multitenant service for consuming and indexing logs at massive scale. It ingests more than 100 GB/s of log data in real time while serving thousands of queries per second. The system is designed to provide service-level guarantees on log freshness, completeness, durability, query latency, and query result completeness. Users emit logs via their preferred logging library—Google Logging Library (glog) being the most common—and can query using regular expressions on log lines, arbitrary metadata fields attached to logs, and across log files from multiple hosts and services.
Written in C++20, the codebase relies on modern patterns including coroutines and async execution, which the team credits for both performance and maintainability. This approach allowed the system to be developed in just three years.
The data model
Logarithm models logs as a named log stream: a time-ordered sequence of immutable, unstructured text lines corresponding to a single log file on a host. A process may emit multiple streams (e.g., stdout, stderr, and custom log files). Each line can carry zero or more metadata key-value pairs. In machine learning (ML) training, a common metadata example is the rank ID when multiple sequences of log lines are multiplexed into one stream, as happens with PyTorch.
Typed structures are supported through two paths: typed APIs for ints, floats, and strings, and regex-based parse-and-extract rules that pull key-value pairs directly from a log line. Extracted pairs are then added to the line's metadata. This is frequently used, for instance, to capture tensor metrics in ML model logging.

Debugging training at scale
ML training workflows present a broad range of failure modes that span data inputs, model code and hyperparameters, and systems components such as PyTorch, data readers, checkpointing, framework code, and hardware. The root causes evolve quickly as workloads shift—from scale to architectures to sharding and optimizations—faster than in traditional service architectures. Triaging these dynamic failures requires collecting detailed telemetry across both the systems and model layers.
Because training jobs run for extended periods, continuous capture of telemetry and state is essential. Debugging a failure without reproduction—which may be nondeterministic and wastes GPU resources—demands that the data already be available. Logs are comparatively cheap to write relative to metrics, relational tables, or traces, and retain the information content needed to power debugging. Given the detail and high throughput of training telemetry, Logarithm provides a natural fit: it streams, indexes, and queries both systems logs and model telemetry in one place.
In the configured setup, each host runs multiple PyTorch ranks, one per GPU, with all processes writing to a single log file. This creates ambiguity when debugging distributed job failures because log lines lack rank context. Adding rank IDs manually would require modifying every logging site, including third-party code. Instead, Logarithm's metadata API injects process context such as rank ID into the thread-local context automatically, attaching it to each log line via a glog handler.
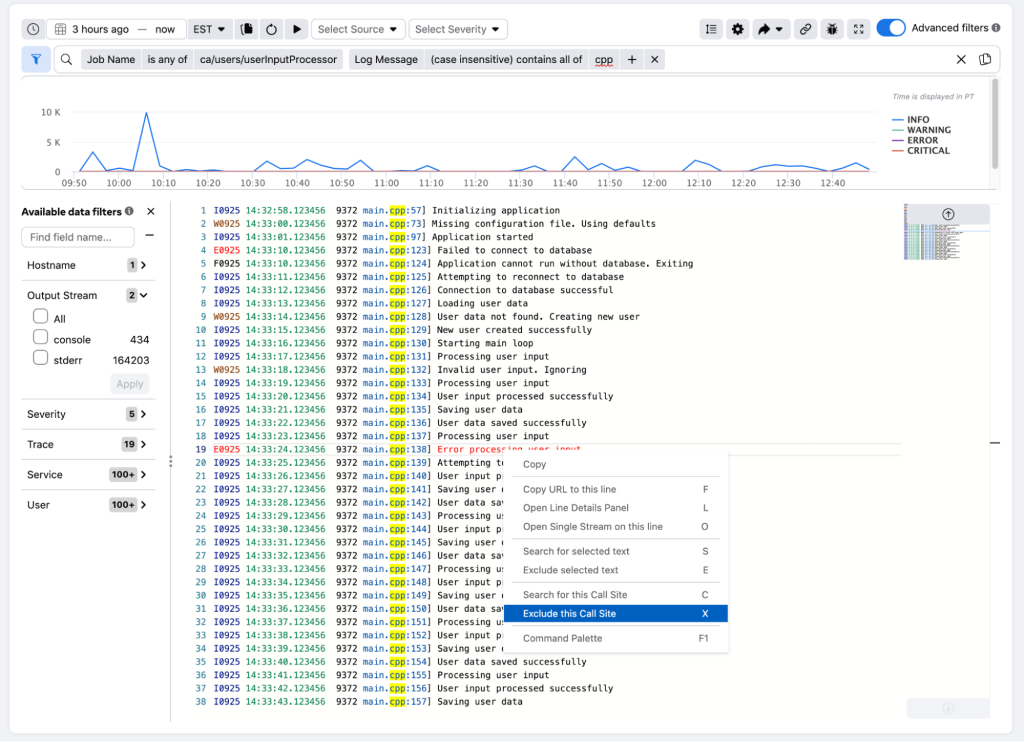
To support interactive debugging, Logarithm includes UI tooling on top of its filtering operations. One feature, filter-by-call-site, hides known noisy or verbose log lines when walking through a stream. Another enables side-by-side comparison of multiple streams to spot rank state differences—like extra or missing lines—which are typically a symptom or root cause. This works because production training jobs follow single-program, multiple-data semantics: every rank iterates over data batches with identical code and batch-level barriers.
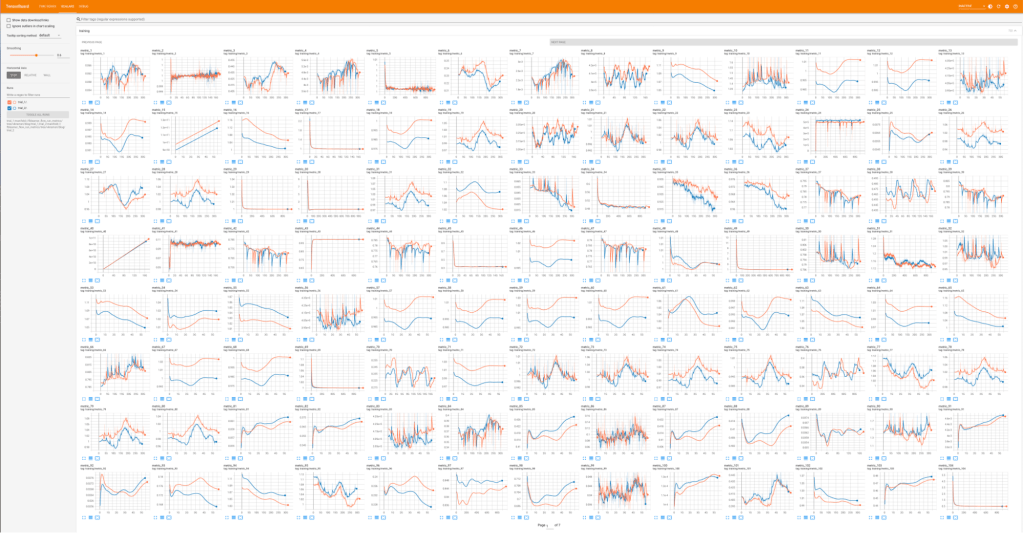
Model telemetry is ingested continuously as summary statistics spanning input and output tensors, model properties such as learning rate, internal state tensors like neuron activations, and gradients. This data powers live training dashboards, including an internal TensorBoard deployment, and enables ML engineers to debug convergence issues and failures from gradient or loss explosions using notebooks over raw telemetry.
Model telemetry is typically iteration-based tensor time series with dimensions like model architecture, neuron, or module names, and tends to be high-volume. Logarithm's low-cost ingestion makes it a suitable home for this data. Collocating systems and model telemetry also helps trace cascading failures from one layer to the other. Internally, the model telemetry APIs write timeseries and dimensions as typed key-value pairs using the metadata API. Multimodal data such as images are stored as references to files in an external blob store.
Dashboards for model telemetry usually appear as large grids of time-series plots, letting engineers quickly spot spatial and temporal anomalies and correlations. Rendering at interactive latencies requires fetching a large number of timeseries and tensor points. To achieve this, dashboards batch and fan out queries to Logarithm using its streaming API, which returns results in random order. This lets the UI render all plots incrementally in parallel, typically within hundreds of milliseconds for the first sample set and seconds for full point sets.
Designing for the write-heavy, time-skewed workload
Logarithm is built around two properties that hold across most logging workloads: logs are written far more often than they are queried, and recent logs are queried much more frequently than older ones. The architecture leans on that skew, layering storage tiers so that the hottest data lives in memory, recent data sits on local SSD, and cold data is pushed to remote durable blob storage (Meta's Manifold). Secondary indices follow the same tiering, which keeps the lowest latencies on the newest logs where queries concentrate.
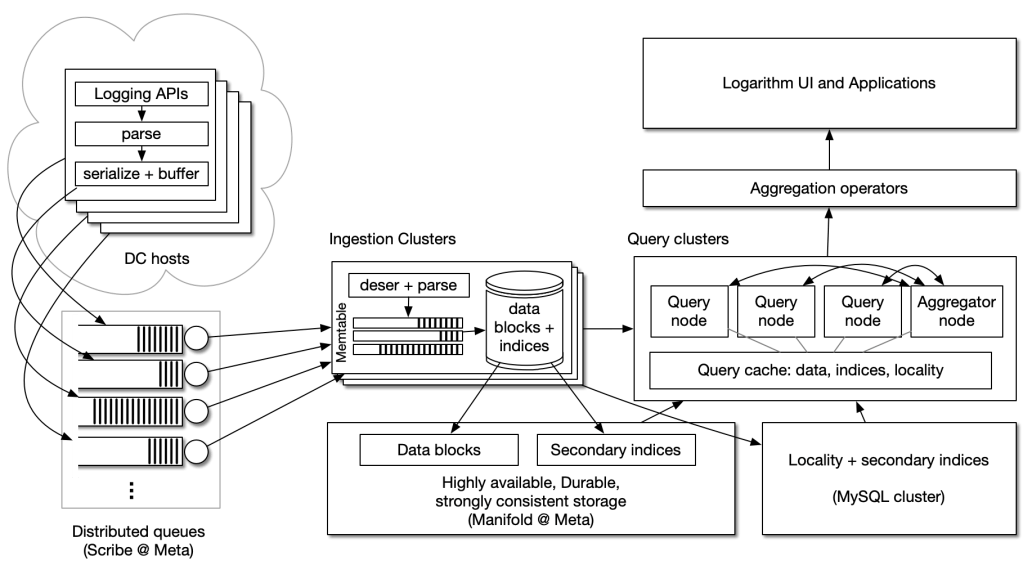
Operations flow through five stages:
- Application processes emit logs via APIs that accept unstructured lines plus per-line typed metadata key-value pairs.
- Host-side agents infer line formats and parse common fields like timestamp, severity, process ID, and call site.
- Parsed objects are buffered and written to a distributed queue per log stream, with durability guarantees and multi-day object lifetime.
- Ingestion clusters read from the queues and apply user-defined regex extraction rules, storing additional key-value pairs as metadata.
- Query clusters serve interactive and bulk queries across one or more streams, with predicate filters on both log text and metadata.
Data block locations are registered in a central locality service implemented on hosted, partitioned, replicated MySQL instances. Each block written at ingestion produces one row per contained log stream, placed in a deterministic shard, with reads distributed across that shard's replicas. The append-only workload avoids any need for distributed transactions. One consequence of freely partitioning ingestion across streams is that federated queries spanning multiple log streams may observe slight timestamp skew between streams.
Logs and metadata are stored as ORC files. Rather than maintaining heavy per-block inverted indices, Logarithm relies on lightweight secondary indices built from Bloom filters, plus min-max values per ORC stripe. The Bloom filters are prefetched into a distributed cache on query clusters when blocks land in disaggregated storage, hiding remote index lookup latency. Data blocks themselves can also be cached during a query, and the system tries to co-locate blocks belonging to the same log stream to cut fan-out and reduce stragglers.
Compute and storage are deliberately separated to allow independent scaling of ingestion, query, and stored volume. The main exception is an in-memory memtable on ingestion hosts: each log stream gets a bounded, time-ordered buffer of its newest logs, serving as a staging area for writes and immediate reads. Multiple memtables reduce contention, with one immutable version being serialized to disk while another is still accepting writes. Ingestion is designed to be I/O-bound rather than compute-heavy — roughly GB/s per host — with zero-copy handling to keep CPU and memory bandwidth out of the critical path.
Ingestion and query resources are also isolated from each other so bulk write processing cannot degrade interactive query latency. Schema is applied on write, with parsing split between host-side agents for common fields and, optionally, ingestion clusters for user-defined regex rules. Customers can separately provision capacities for retention, ingestion, and query workloads.
Fault tolerance and elasticity without replication at the compute layer
State maintenance is pushed down to the disaggregated storage layers rather than replicated in ingestion or query code. Manifold provides consistency, durability, and availability via read-write quorums; Scribe's LogDevice implements the distributed queues as durable replicated logs. Ingestion nodes stream serialized objects to Manifold in 20-minute epochs and periodically checkpoint Scribe offsets there. If an ingestion node fails, its replacement downloads the most recent epoch from Manifold and resumes from the last Scribe checkpoint, so any lost work is bounded to a single short epoch.
A Shard Manager–based control plane watches ingestion node health and per-shard load for every log stream. When one shard becomes hot, it is relocated; when a stream's volume climbs, the control plane adds shards on nodes with spare capacity. Resource isolation between streams is maintained at ingestion time. A sudden spike can overflow the Scribe queue, and logs are dropped until shard count catches up — behavior that typically manifests from logging bugs such as runaway verbosity rather than organic growth.
Query requests are routed uniformly across query clusters. The receiver acts as aggregator, partitioning work across a bounded subset of nodes as a balance between cluster load and latency. Filter and sort operators are pushed down to query nodes, and results are returned as one blocking, fully sorted response. Each partition is resolved by checking locality first, then reading through a chain that can span the query cache, ingestion nodes for the freshest logs, and Manifold. The query cache is replicated 2x to spread load and allow fast failover without waiting on cache shard migration.
A separate streaming API gives non-blocking, lower-latency reads with randomized sampling as logs arrive, useful for early visibility into a running query. Results are always paginated.
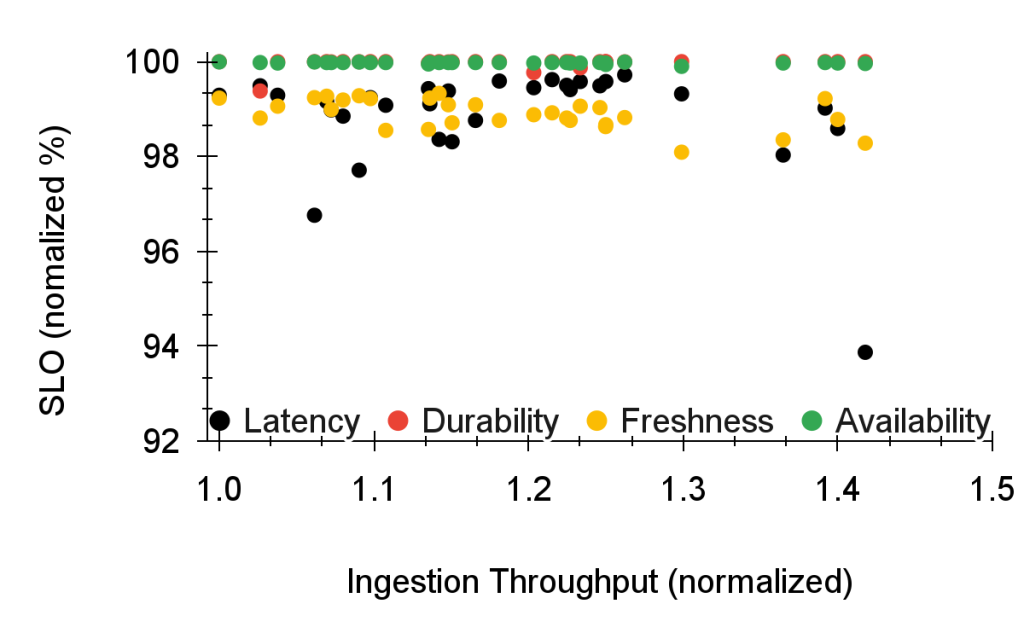
Query latency can be protected at the expense of completeness or ordering, with a flag raised to the client when that tradeoff is made. If a partition runs slow, the aggregator times out and skips that straggler; if too many blocks match, the query skips some and resumes from the skipped offsets on the next page. In steady operation, both completeness and latency targets are met because the architecture actively suppresses the usual causes of stragglers. Admission control is enforced at client or user granularity.
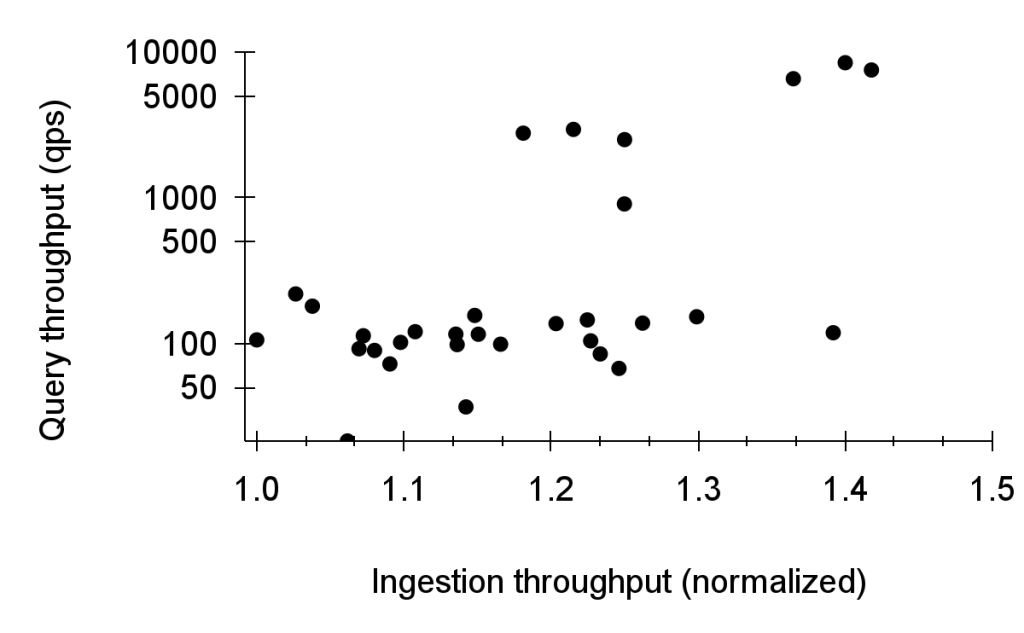
Security and privacy controls fit the same stream model. Access can be enforced per log line at both ingestion and query time, retention windows are configurable per stream, and deletion happens at line-level granularity.
Built-in exploration and the road ahead
Logarithm ships with a native UI for interactive log exploration, search, and filter — embedded as a widget in service consoles across Meta. A CLI supports bulk downloads for scripting and analysis.
Work is now focused on layering richer analytics over the core primitives while preserving query latency guarantees. Relational-algebra-style operations on structured data and broader log analytics are pushed down through the same search-filter-sort mechanism, along with federated retrieval. Storage-side improvements include lightweight disaggregated inverted indices for full text search and layouts tuned for query patterns. Distributed debugging UI primitives for AI systems are also in progress, keeping the design principle unchanged: simplicity in state distribution is what makes the scale-out properties hold.


