Measuring Test Reliability at Facebook
Facebook’s codebase changes daily as engineers ship new features and optimizations. Each change carries the risk of regressing functionality for billions of users. To guard against that risk, the company maintains a massive suite of automated regression tests, which run at every stage of development. These tests catch regressions early, but until recently, they themselves were never checked for deterioration.
An automated test is software like any other, and it can become unreliable as the codebase evolves around it. Flaky tests — those that pass and fail nondeterministically without any underlying product change — generate false signals. When engineers have to chase failures that don’t correspond to real defects, they lose trust in the testing process. That erosion of trust undermines regression testing itself, making it critical to identify when a test has become flaky.
Academia has generally focused on binary classification: is a test flaky or reliable? Facebook’s engineering experience contradicts that framing. Every real-world test is flaky to some degree, even one written to best practices. There is always something that could interfere. A test that was reliable yesterday may be flaky today, and reliability must therefore be monitored over time. The relevant question is not whether a test is flaky, but how flaky it is.
Facebook‘s answer is the probabilistic flakiness score (PFS). PFS is a universal measure, applicable to any regression test regardless of programming language or test framework. It is also efficient to compute, which permits real-time tracking of millions of tests across the company’s suite. Because the score is interpretable by engineers, it has been adopted by many teams to set reliability goals and coordinate efforts to fix flaky tests.
Why a Degree of Flakiness Matters
Flakiness erodes test suites over time. When engineers learn to ignore a flaky test, they eventually remove it entirely, and that removal increases the risk that future code changes will introduce unnoticed regressions. Facebook’s earlier work on predictive test selection made it clear that small, targeted tests may be somewhat flaky, and that is tolerable because they can be retried or adjusted at low cost.
Large end-to-end tests are a different challenge. Retrying them is expensive, and modifying them is complex. When a code change breaks an end-to-end test, developers need a highly reliable signal, or they will waste time investigating phantom problems. Ideally, a reliable test would never surface a regression that was not actually there. To find such tests, Facebook needed an automated way to test the tests.
The search for a perfectly reliable end-to-end test proved futile: none exist. The practical goal of PFS is therefore not to certify anything as 100 percent reliable. Instead, it is to assert that a test is reliable enough, and to quantify when a test falls below the acceptable threshold so that engineers can react quickly to maintenance needs. By monitoring PFS over time, Facebook can alert teams when a test’s flakiness increases beyond a tolerable level — often soon after the test is created — and direct attention to repairing it before it degrades the entire regression process.
What Makes a Test Result Meaningful
When a single test execution produces a result, we lack the context to determine whether that outcome reflects genuine flakiness or a real regression in the code under test. However, if we run a test repeatedly and observe a consistent level of flakiness, we can start to predict the distribution of results we would expect to see. This predictability is the foundation of measuring flakiness quantitatively.
To do this, we built a statistical model implemented in the probabilistic programming language Stan. The model generates distributions of test results for hypothetical tests with known flakiness levels. Flipping this around — taking real observed results from an actual test and estimating its flakiness — requires Bayesian inference, which Stan handles efficiently under the hood.
Three Factors That Influence Test Outcomes
Before diving into the mathematics, a qualitative model helps frame the problem. We can attribute test outcomes to three broad categories of influence:
- Code versions. The code under test and the test itself are the most direct determinants of outcomes. A test failing because of a regression is desirable; invalid assertions that always fail are usually caught and corrected early.
- External state. Many end-to-end tests depend on production services, feature flags, and configurations. Just as the code's behavior changes with its environment, so do test results — this dependency is sometimes necessary and occasionally even intended.
- Everything else. Nondeterministic elements like race conditions, randomness in the code, or transient network errors fall into a catch-all bucket. This is what we mean by flakiness in the strict sense, and it's the target of our measurement.
The sensitivity of a test's result to this third factor is, conceptually, the flakiness we want to compute:
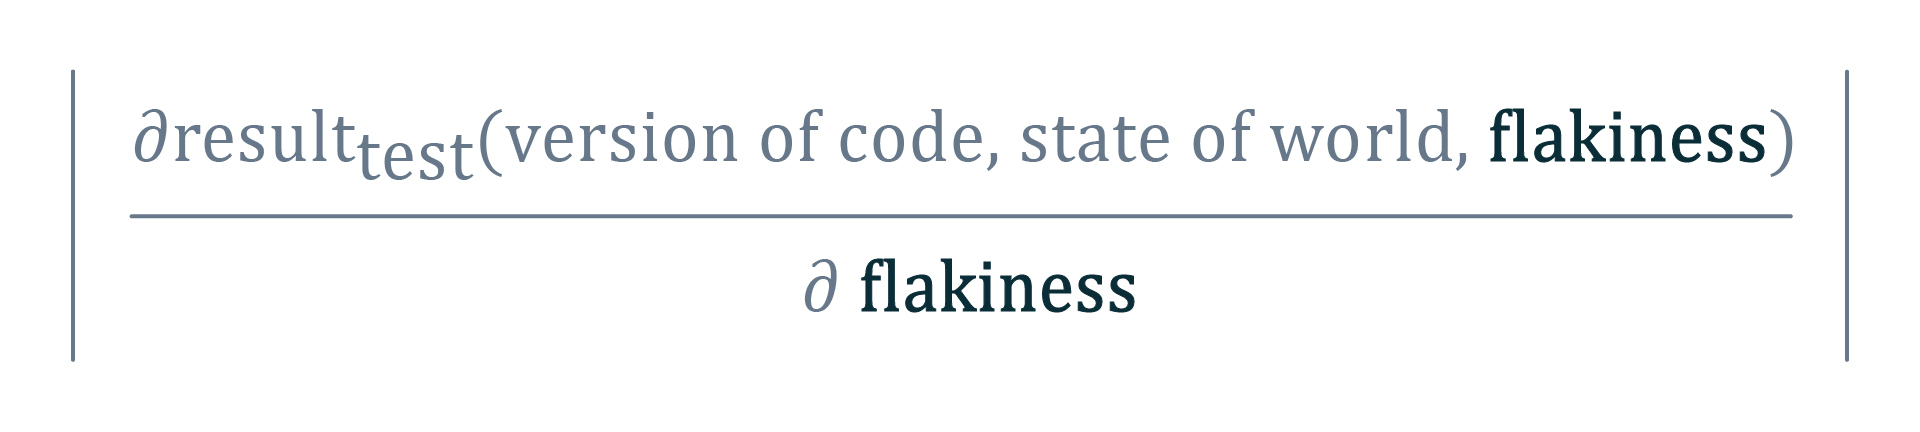
Since test results are binary (pass or fail), that partial derivative can't be calculated outright. We need a different, probabilistic way to quantify this sensitivity.
The Asymmetry That Drives the Score
During early attempts at modeling, we discovered a complication: the pure mathematics were symmetrical if you swapped passing and failing outcomes. That symmetry doesn't reflect how engineers actually treat test results. Our empirical observation is:
A passing test indicates the absence of the corresponding regression, while a failure is merely a hint to run the test again.
Engineers generally trust a pass. But a failure will usually prompt one or more retries against the same code; if the test then passes, the failure is chalked up to flakiness. We don't have a rigorous theoretical reason for this asymmetry, but it is a persistent part of software practice and we built our metric around it.
That metric, the Probabilistic Flakiness Score, is defined as:
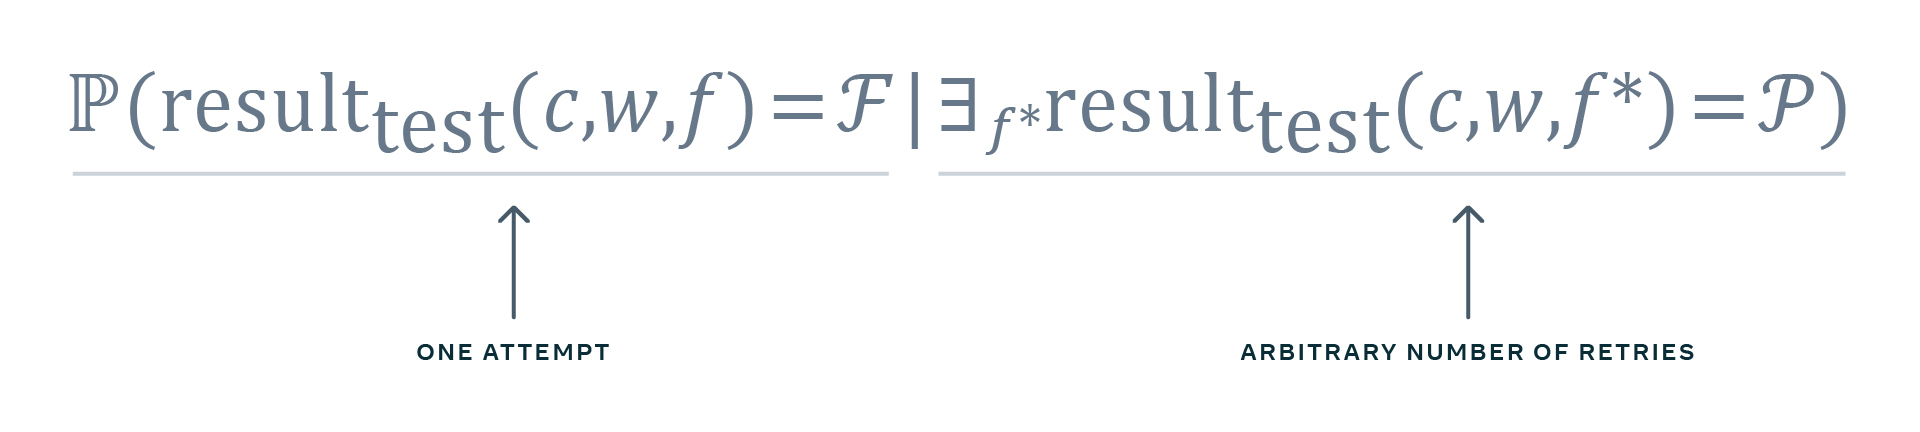
Intuitively, the score tells us the likelihood of a test failing when, had it been retried, it could just as well have passed under equivalent code and world state. Because engineers treat a run that eventually passes (after retries) as proof that a prior failure was flaky, this conditional definition matches that behavior.
Two Parameters Per Test
The underlying statistical model treats PFS as an intrinsic property of each test — a fixed but unknown number we estimate from a history of results. Each test is fully described by one of two parameters:
- Probability of a "bad state," pb — how often the test fails due to code versions or external services.
- Probability of failure in a "good state," pf — this equals the PFS.
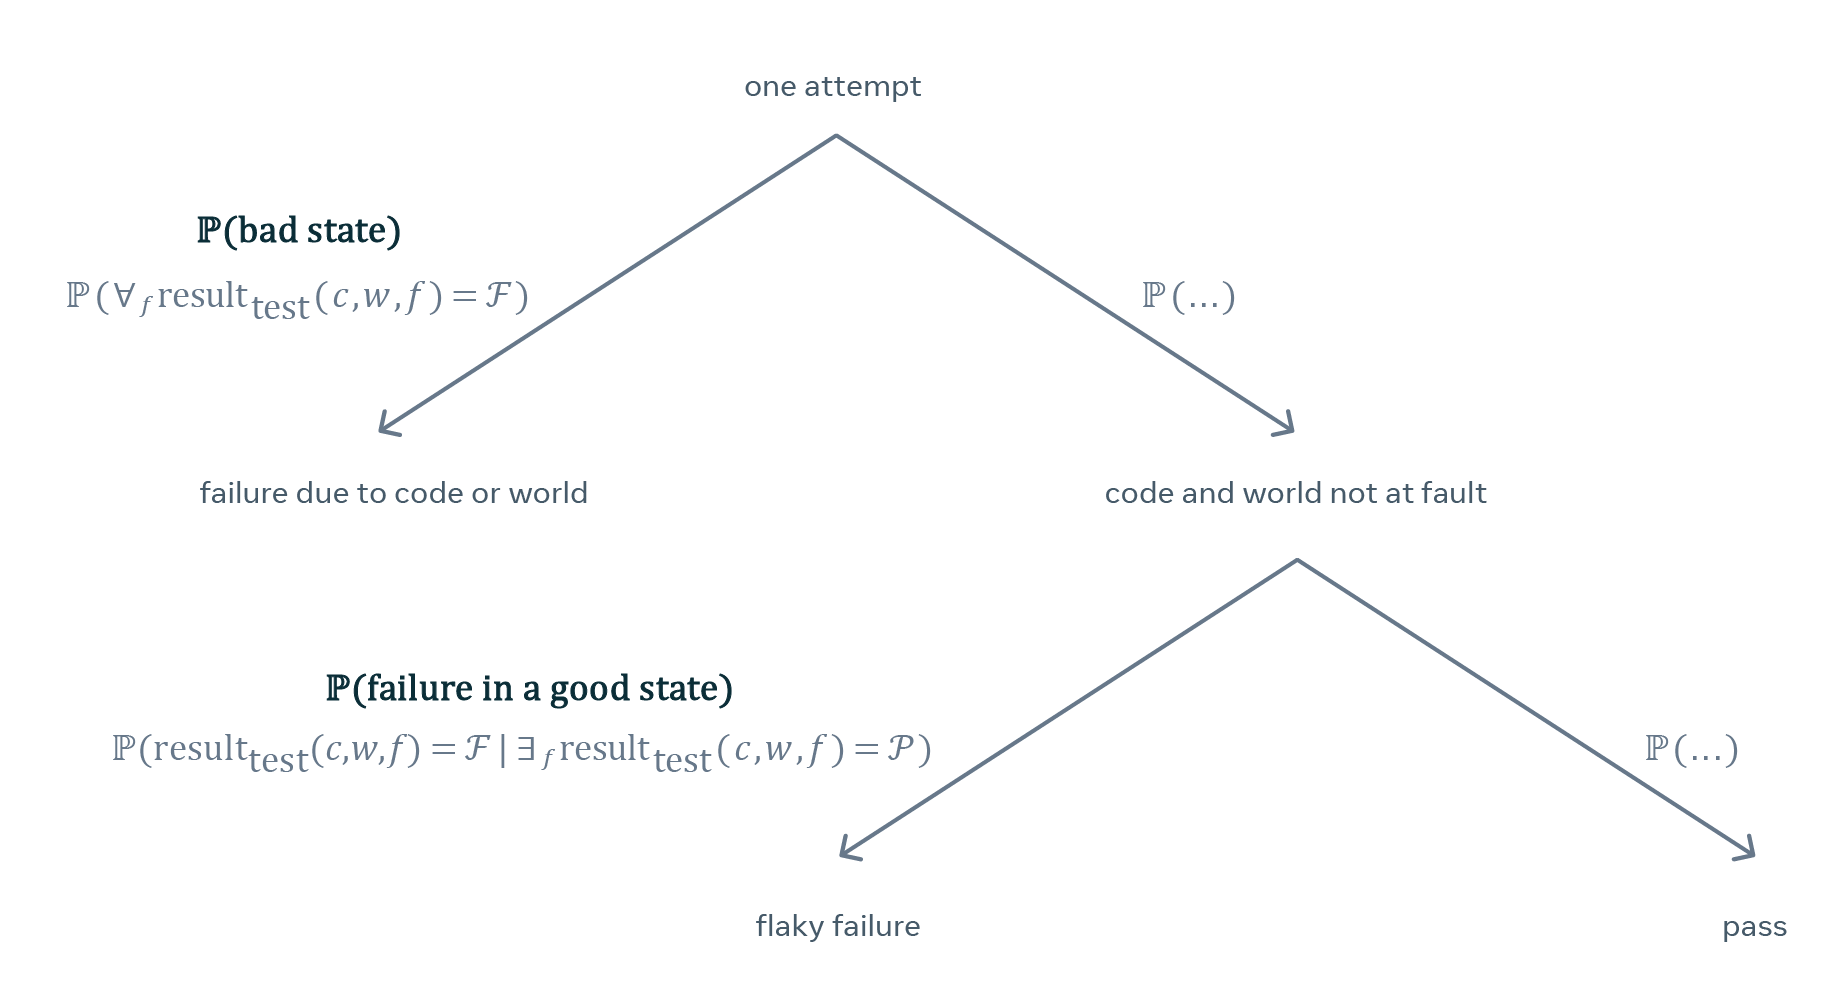
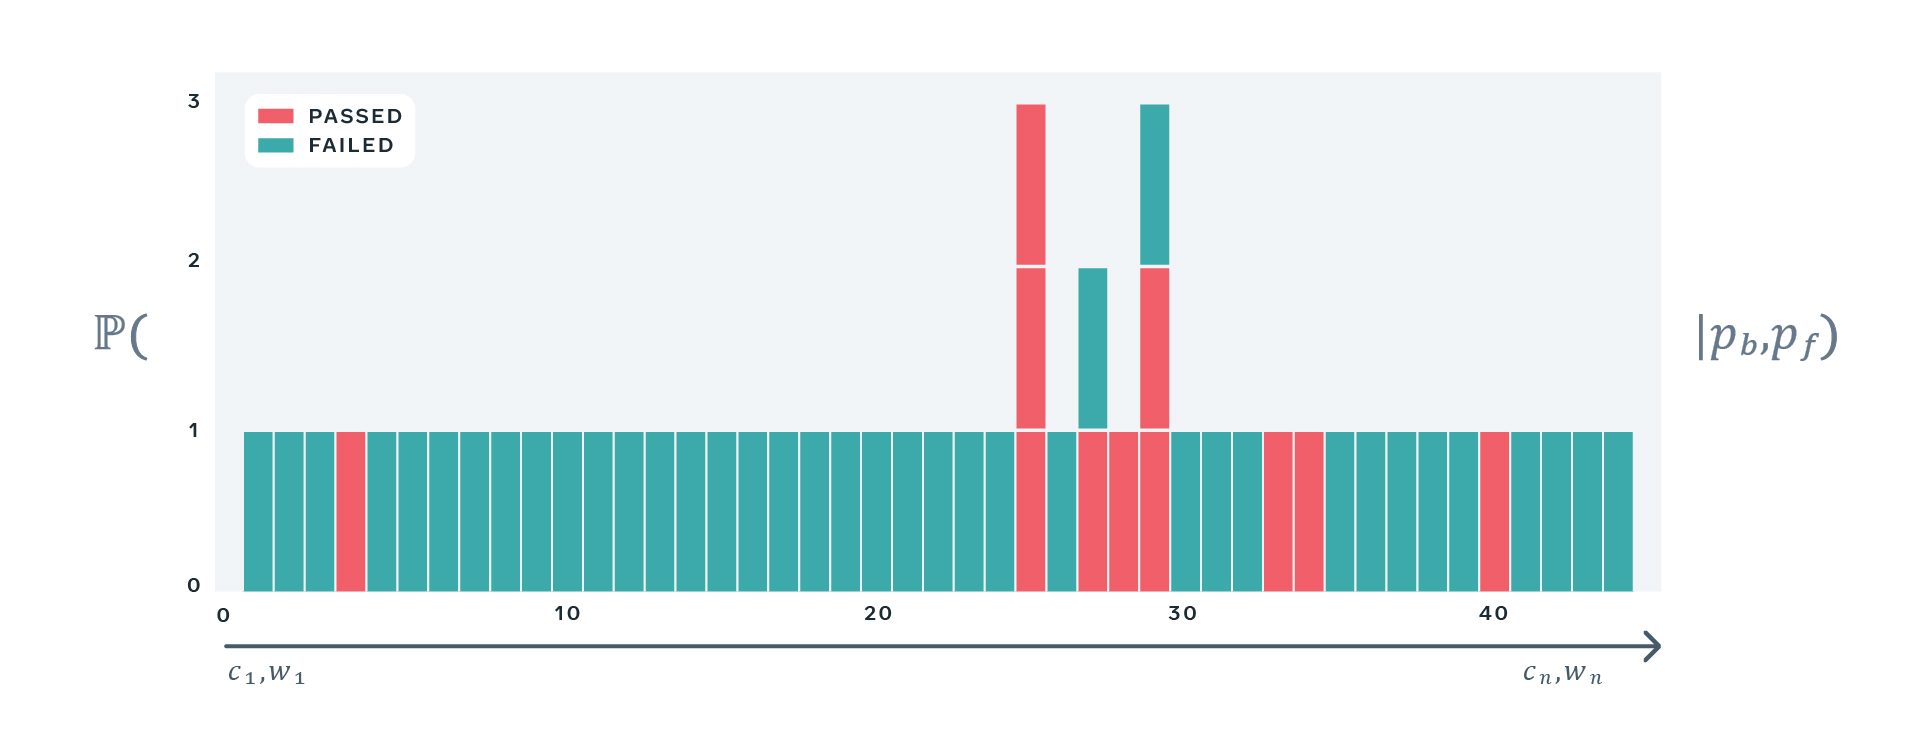
The model cannot tell us whether a specific failure originated from code, environment, or flakiness, nor does it promise to predict the next result. But it does tell us how likely a test with a given (pb, pf) pair would be to produce an observed sequence of results.
How Retries Fit In
A small example makes the mechanics clear. Suppose a test is run on code version c and sees state w1. If the first attempt passes, we're done — passing runs are not retried. If it fails, the test infrastructure retries it once, treating the second run as final, pass or fail. Real systems use a finite retry limit rather than retrying forever, but for this illustration one retry suffices.
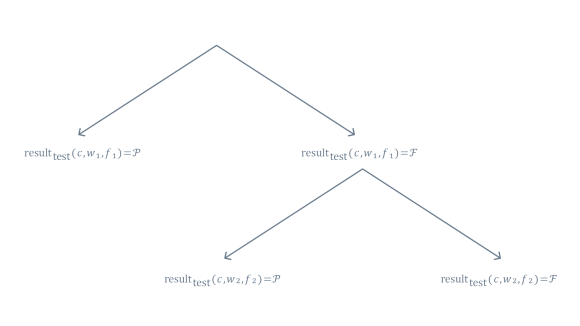
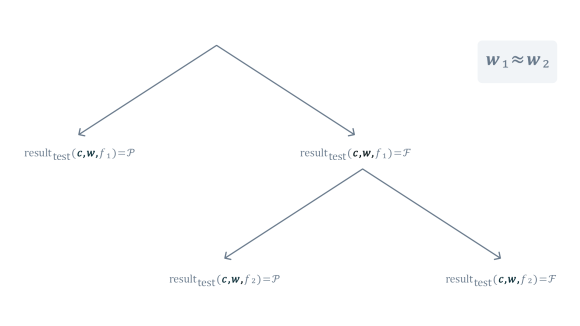
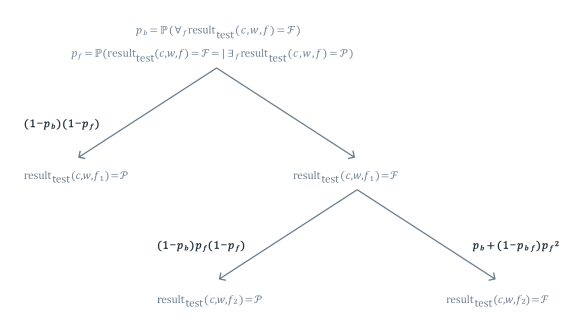
Both attempts happen within seconds of each other, often against the same pinned configuration and services, so we can reasonably assume the "state of the world" doesn't change between retries. With those assumptions, the probabilities of each observed outcome can be expressed strictly in terms of pb and pf.
From Results to the Score
The model is forward-facing — it produces result sequences from the parameters. But what we observe is a sequence of results, and the parameters are unknown. We need to invert the model:
The Bayes theorem is the tool that makes this inversion straightforward — it works directly on the model's likelihood function:

We encoded the model in Stan, which uses modern Bayesian inference algorithms capable of turning observed test history into a posterior distribution over both parameters.
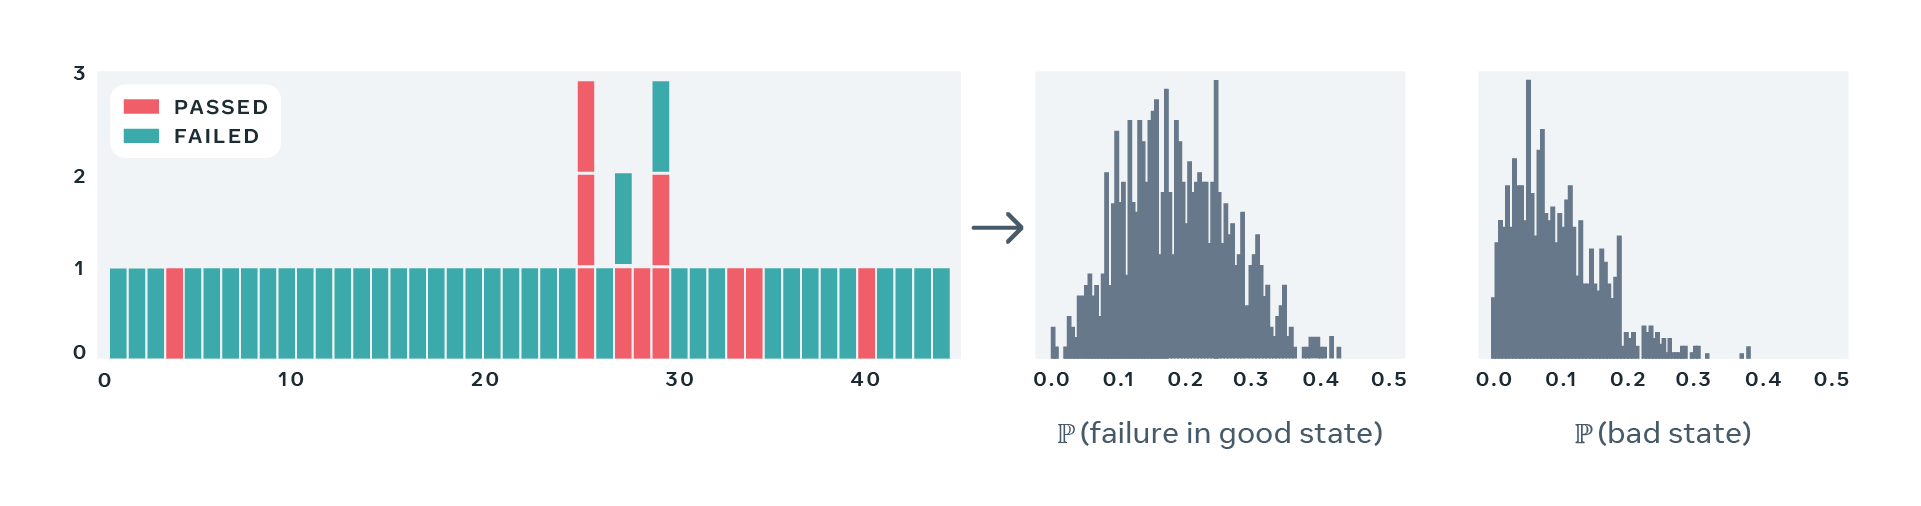
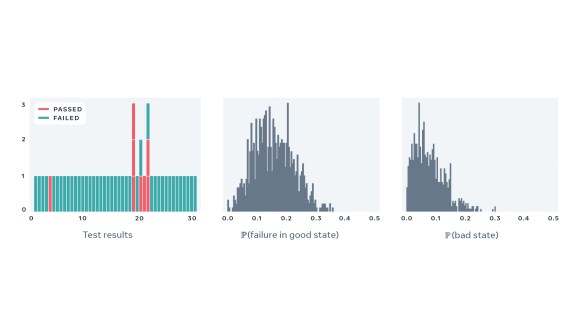
A key point: we are not producing a single, point estimate of flakiness. The posterior distribution itself encodes how confident we should be. A tight peak near a particular flakiness score gives high confidence. A wide spread, or a distribution with multiple peaks, is a signal that current data is insufficient for an estimate and we need more runs to draw conclusions.
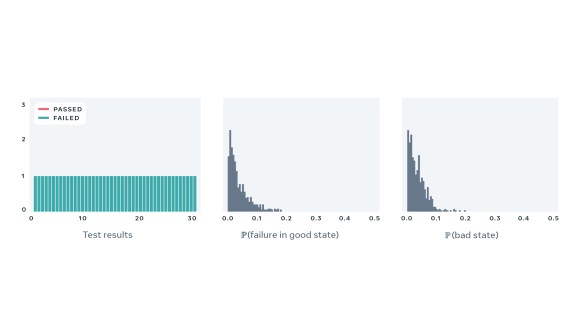
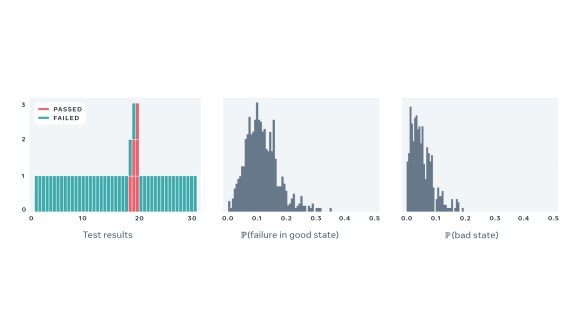
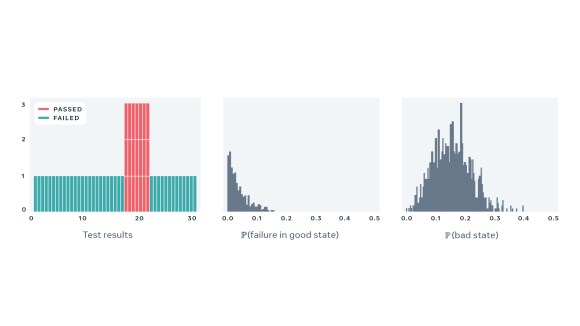
You can see the model in action on real tests below. Each example shows a recent run history plus the estimated distributions for both parameters. The match between our computed scores and what a developer would subjectively conclude from raw results confirms the approach. Critically, the model correctly identifies a test that fails deterministically due to, say, a temporary change to a shared configuration — such a test has a near-zero flakiness score even though its failure rate over that window appears high. The failures aren't flaky; they're caused by the world state, which is a distinct kind of problem with a different fix.
Putting PFS to Work
PFS provides a flakiness measure that works across any test, in any language or framework, using only the observed sequence of results. Because it requires no custom instrumentation, it reflects how much confidence you can place in a test's estimated flakiness. Since its initial deployment in mid-2018, PFS has been used for several distinct purposes at Google.
Incentives, Not Just Intentions
Beyond developer goodwill, PFS forms the backbone of an incentive structure that keeps a large test suite reliable. Scores are calculated continuously from test results produced during normal CI operation, so no extra test runs are required. Fitting the statistical model to a test's history takes a fraction of a second, allowing updates each time a new result arrives.
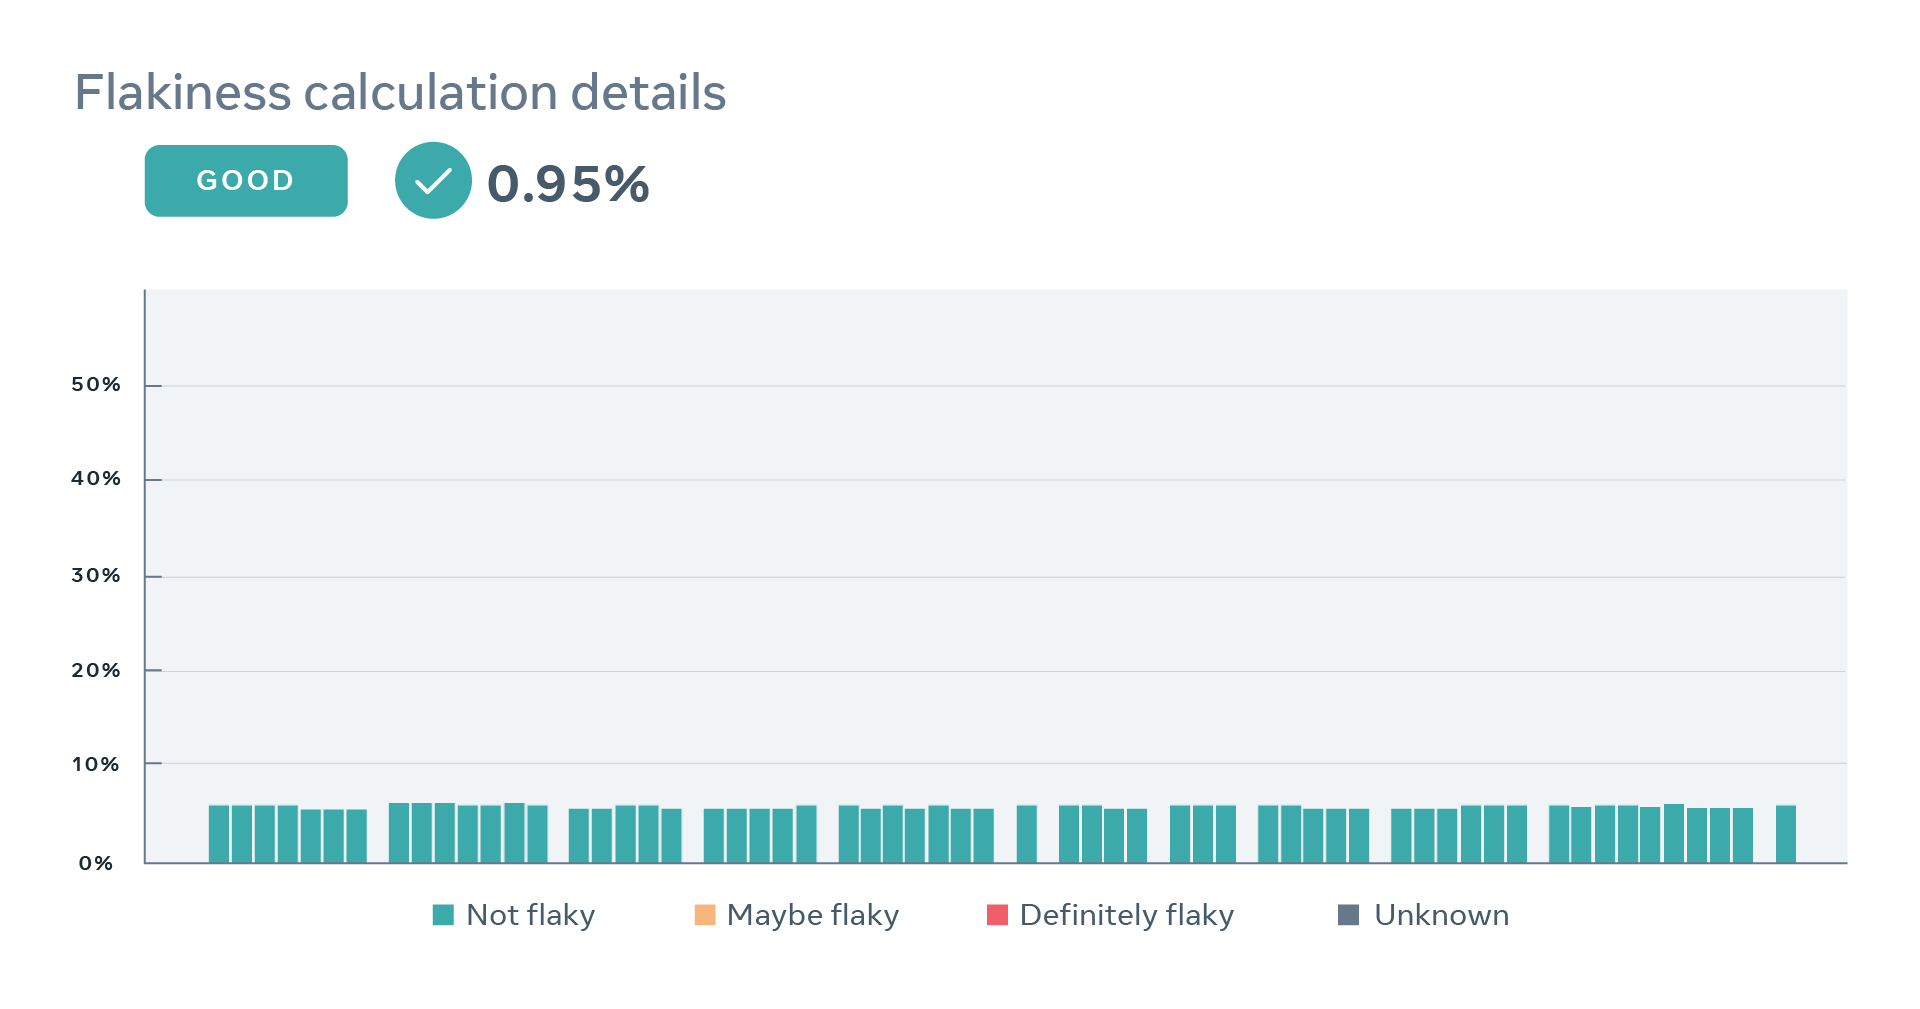
Developers can view historical PFS values on a per-test dashboard, making it easier to pinpoint when a score changed and identify the root cause. When a test's flakiness starts trending upward, a ticket is automatically created for its declared owner, whether an individual or a team. If a test deteriorates significantly or isn't fixed promptly, it gets marked as flaky and becomes ineligible for change-based testing. This means the CI system will no longer select that test to run on changes that might affect it, which is a powerful motivator for owners who depend on those tests to enforce contracts with other engineers working in the same monolithic codebase.
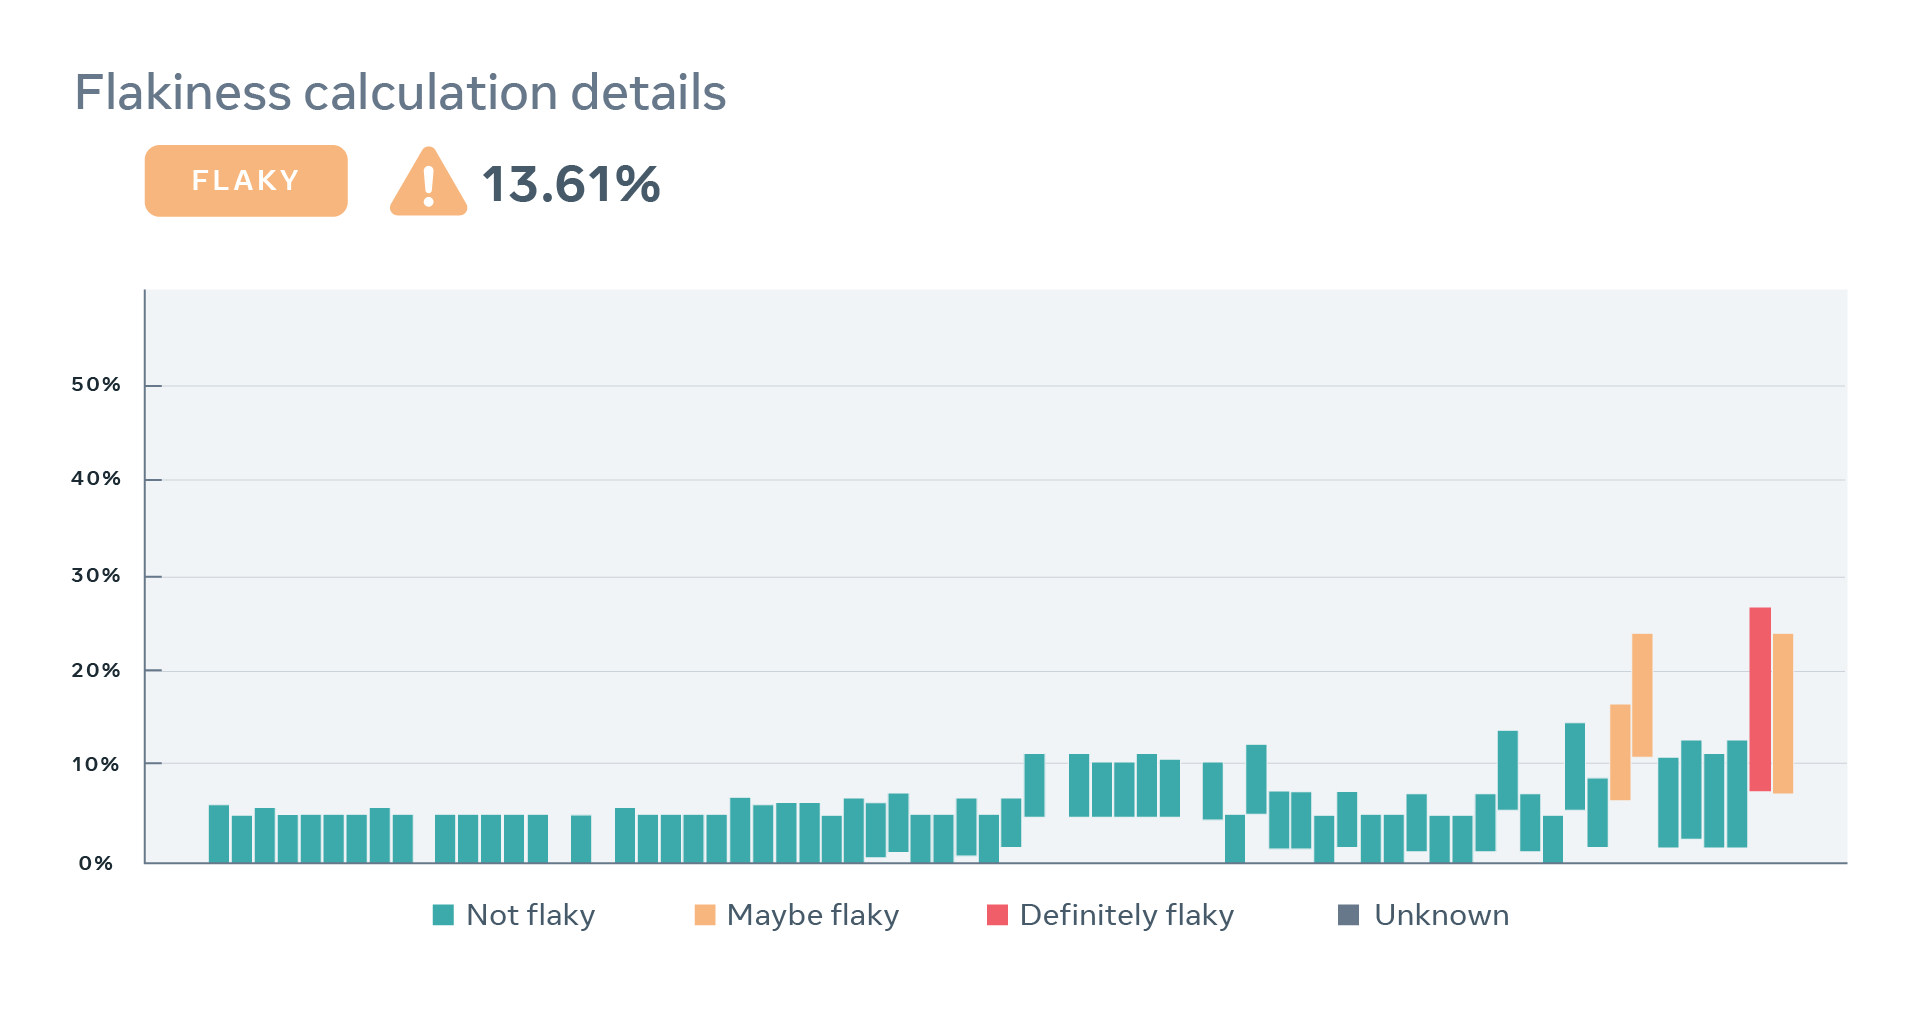
This carrot-and-stick approach establishes a social contract between test authors and codebase contributors: test owners must keep their tests reasonably reliable, and in turn, developers must address issues that reliable tests surface in their changes. PFS is the mechanism that resolves the natural tension between these two groups.
Trust as a Metric
As PFS gained credibility and became accepted as a measure aligned with engineers' perception of flakiness, large teams began using it to set goals and drive reliability improvements. That adoption is itself strong evidence of the trust placed in the metric.
PFS assumes all tests are flaky to some degree, which matters when using it to prioritize organization-wide investment in test quality. The score helps identify the most flaky tests, allowing developers to focus effort where it will have the greatest impact on reducing observed flakiness. It doesn't tell you how much work a fix will require, but it does tell you the expected reward.
It also helps determine when to stop. Since every test framework and environment carries an inherent level of flakiness, throwing more human resources at test reliability eventually hits diminishing returns. By comparing a real-world test's PFS to that of the simplest possible test in the same framework, you can see when the two converge. At that point, the test is as reliable as it can get without improving the framework itself. This effective lower bound varies by framework: well below 1 percent for unit tests, but as high as 10 percent for some end-to-end frameworks.
That observation about framework-contributed flakiness has since been validated from another angle. A more recent internal project produced a new end-to-end test framework that makes it extremely difficult to write unreliable tests and contributes nearly no flakiness on its own.
We'd like to thank the following engineers and acknowledge their contributions to the project: Vladimir Bychkovsky, Beliz Gokkaya, and Michael Samoylenko.


