

From pattern matching to program understanding
Static analysis has grown from a simple extension of text search into a discipline that borrows heavily from compiler technology. The earliest tools for security review were essentially lexical scanners: they read source code, broke it into tokens, and flagged any token that matched a name in a built-in list of dangerous functions. Tools like ITS4, Flawfinder and RATS worked this way. They solved a real problem—finding candidate sinks without pulling in comments and function declarations—but they still reported far too many false positives, because they had no way to tell whether a dangerous function was actually reachable with untrusted data.
The missing piece is an understanding of how data moves through a program. Before we can build that understanding, it helps to settle on vocabulary that is now standard in the field.
Sources, sinks, and data flow
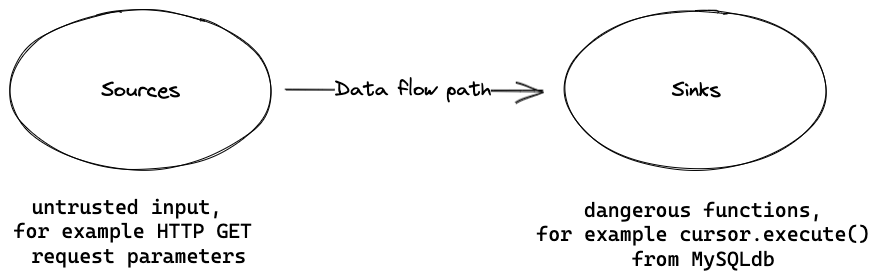
Injection vulnerabilities—SQL injection being the canonical example—share a common shape. Untrusted input enters the application at some entry point, travels through the code, and eventually reaches a function that executes or interprets that input. In static analysis terms:
- Source: any point where outside data enters the program, such as an HTTP request parameter or a command-line argument.
- Sink: any function that performs a sensitive operation on its arguments, such as
MySQLCursor.execute()or Python'seval(). - Data flow: a path through the program such that the value from a source can reach a sink without being sanitized or validated.
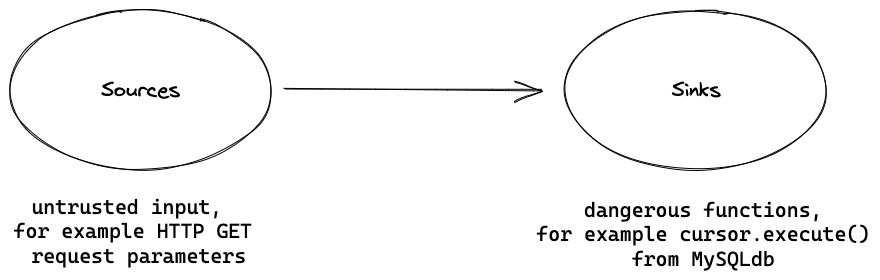
Defining these terms precisely matters because it turns "look for anything dangerous" into "find a path from a source to a sink." A sink is not automatically a vulnerability—plenty of sinks can be used safely—but a reachable, unsanitized path from a source is exactly the condition that makes an injection bug.
Why grep doesn't scale
Suppose you wanted to find SQL injection in a Django project by hand. You might start with grep for places where a GET request parameter is read:
username = request.GET.get("username")
The results would include noise. Comments and function names that merely contain the same words would match just as readily:
Def request_check(req)
# This processes a request from the server
Even after filtering out those false positives, you would still face a deeper problem. Source and sink counts grow quickly. A real application may have dozens of request handlers and hundreds of database calls, and the possible paths between them number in the thousands. Manually tracing each one is impractical. Grep only handles one syntactic pattern at a time; it does not model the semantics of the program. Static analysis tools were built to answer that need.
What compilers already knew
Compilers and interpreters have long performed a form of static analysis: type checking, which verifies that operations are applied to values of the correct type. That capability already eliminates entire classes of bugs at build time. Security-oriented static analysis takes the same idea further by adapting other compiler technologies for a different goal.
Lexical analysis is the first step. It converts raw text into a stream of tokens—strings, integers, identifiers, reserved words like def—while discarding characters that carry no meaning, such as comments and whitespace. Consider this small function containing a SQL injection:
1. from django.db import connection
2.
3. def show_user(request, username):
4.    with connection.cursor() as cursor:
5.        cursor.execute("SELECT * FROM users WHERE username = '%s'" % username)
The first line, from django.db import connection, becomes a sequence of tokens, each tagged with its type and position. This output was produced with Python's tokenize library:
TokenInfo(type=63 (ENCODING), string='utf-8', start=(0, 0), end=(0, 0), line='')
TokenInfo(type=62 (NL), string='\n', start=(1, 0), end=(1, 1), line='\n')
TokenInfo(type=1 (NAME), string='from', start=(2, 0), end=(2, 4), line='from django.db import connection\n')
TokenInfo(type=1 (NAME), string='django', start=(2, 5), end=(2, 11), line='from django.db import connection\n')
TokenInfo(type=54 (OP), string='.', start=(2, 11), end=(2, 12), line='from django.db import connection\n')
TokenInfo(type=1 (NAME), string='db', start=(2, 12), end=(2, 14), line='from django.db import connection\n')
TokenInfo(type=1 (NAME), string='import', start=(2, 15), end=(2, 21), line='from django.db import connection\n')
TokenInfo(type=1 (NAME), string='connection', start=(2, 22), end=(2, 32), line='from django.db import connection\n')
TokenInfo(type=4 (NEWLINE), string='\n', start=(2, 32), end=(2, 33), line='from django.db import connection\n')
Lexing alone solved the comment problem: tokens only represent actual program elements, so a string literal like "find the GET request" inside a docstring or comment simply does not appear in the stream that the tool inspects. Combined with a knowledge base of dangerous function names, this produced a generation of tools that could flag sinks with much lower noise than grep.
The remaining problem
Lexical tools still judge each sink in isolation. They can tell you that execute() appears in the code, and that it is potentially dangerous, but not whether the argument it receives originated from a source like an HTTP parameter. Reporting every sink regardless of context drowns the analyst in results. The next step requires a more complete model of the program: one in which the analyzer can actually trace a value from its origin at a source to its use at a sink. That is where CodeQL and similar tools begin to operate on a different level—one that the following parts of this series will explore in detail.
From syntax trees to data flow
The first generation of static analysis tools leaned on the simplest compiler primitive—lexing—to scan for vulnerable patterns in source code. As the field matured, analyzers adopted more sophisticated compiler theory: parsing, abstract syntax trees (ASTs), and eventually control flow analysis. The jump from token streams to an AST is significant. Instead of working with an undifferentiated sequence of symbols, the analyzer gets a tree where each node has a semantic type. A method call, for instance, is a typed node, and its qualifier and arguments sit as its children. This type information is what lets an engine answer more precise questions about the code.
We can see the difference with a practical example. Parsing a snippet of Python that contains a SQL injection using that language’s ast and astpretty modules yields a tree where the call to the dangerous method on line 5 is explicit.
Module(
    body=[
        ImportFrom(
            lineno=2,
            col_offset=0,
            end_lineno=2,
            end_col_offset=32,
            module='django.db',
            names=[alias(lineno=2, col_offset=22, end_lineno=2, end_col_offset=32, name='connection', asname=None)],
            level=0,
        ),
        FunctionDef(
            lineno=5,
            col_offset=0,
            end_lineno=7,
            end_col_offset=78,
            name='show_user',
            args=arguments(
                posonlyargs=[],
                args=[
                    arg(lineno=5, col_offset=14, end_lineno=5, end_col_offset=21, arg='request', annotation=None, type_comment=None),
                    arg(lineno=5, col_offset=23, end_lineno=5, end_col_offset=31, arg='username', annotation=None, type_comment=None),
                ],
                vararg=None,
                kwonlyargs=[],
                kw_defaults=[],
                kwarg=None,
                defaults=[],
            )
            # output cut for readability
            )])
Graphing the tree with graphviz makes this structure legible: the “Call” node on line 5 sits clearly at a branching point, with the method qualifier and its argument as identifiable children.
1. from django.db import connection
2.
3. def show_user(request, username):
4.    with connection.cursor() as cursor:
5.        cursor.execute("SELECT * FROM users WHERE username = '%s'" % username)
With this structural view, we can write more precise queries. Rather than searching for any token sequence that looks like a method call, we can ask for calls to a specific method, say execute from the django.db library. Even more useful, we can add a constraint on the argument type. Looking for calls to execute that don’t take a plain string literal as an argument filters out the majority of benign, hard-coded queries and leaves us only with the suspicious cases—like the call that builds its query string using "SELECT * FROM users WHERE username = '%s'" % username. This is the core value proposition: using an AST lets us cut false positives with structural filters rather than regex heuristics.
Following the control flow
An AST models the shape of code, but it doesn’t model the order of execution. To track how a program actually runs across branches and assignments, analyzers build a control flow graph (CFG). In a CFG, each node corresponds to a primitive statement—an assignment, a condition, a call—and the edges connect a statement to its possible successors in the program’s execution.
Consider a simplified snippet where a SQL injection only affects non-admin authenticated users, taking place inside a conditional block.
1. username = request.GET.get("username")
2. if request.user.is_superuser:
3.    sql = "SELECT * FROM users"
4.    cursor.execute(sql)
5. elif request.user.is_authenticated:
6.    sql = f"SELECT * FROM users WHERE username={username}"
7.    cursor.execute(sql)
8. else:
9.    print("404")
Rendering this snippet as a CFG shows the branches clearly. Each node in the diagram maps back to a source line, which makes the three-tier structure of the authentication check visible: the function entry, the branch on the authentication status, and the sink call nested within it.
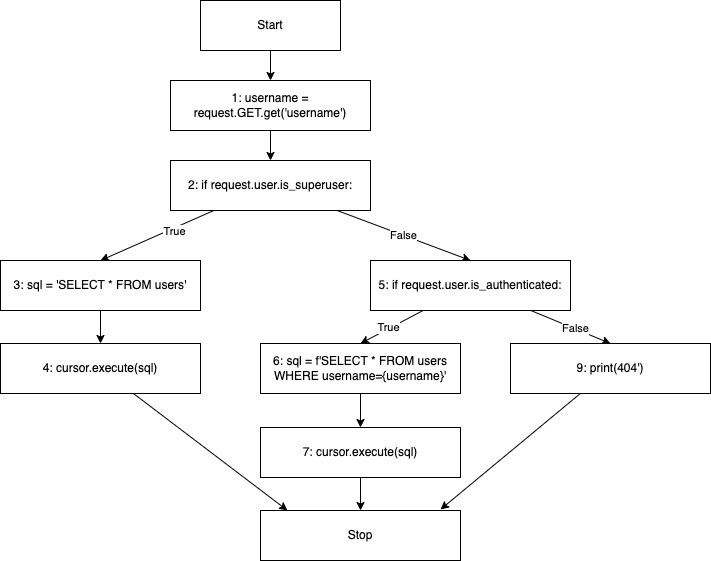
Even with a CFG in hand, finding vulnerabilities is not simply a matter of connecting a bad input to a dangerous call. Take the two method calls across lines 3 and 7 in the CFG above: the structure tells us the logic paths that link them, but it does not yet tell us whether data actually travels along that path.
Taint tracking: the flexible data flow
Pure data flow analysis answers that question by propagating values across the CFG, but it has a hard limitation: it only tracks data whose identity is preserved. When a string is interpolated or concatenated, the result is a new value, and an analyzer tracking only immutable data flow loses the trail.
Taint tracking relaxes that rule. It marks certain sources as "tainted" and propagates that taint marker through transformations that change values but preserve the influence of the original input. In a typical stored SQL injection pattern, the flow does not literally move the username variable into the execute call; it passes through an if condition to concatenation that builds a new string named sql. Value-based data flow analysis would lose track of the variable after the interpolation, but taint tracking sees past the value change and flags the entire path to the sink.
Visualizing this with a near-identical example makes the distinction concrete. The untrusted HTTP parameter username is concatenated into a SQL statement that is subsequently passed to execute.
1. from django.db import connection
2.
3. def profile(request):
4.    with connection.cursor() as cursor:
5.        username = request.GET.get("username")
6.        sql = f"SELECT * FROM users WHERE username={username}"
7.        cursor.execute(sql)
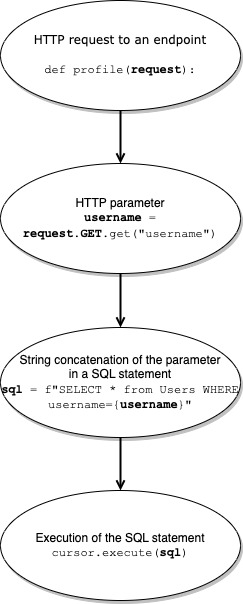
In the diagram, the variable sql isn’t highlighted as part of a strict, value-preserving flow—because the tracked parameter’s value isn’t passed via sql, it’s modified. Under taint tracking’s permissive rule of propagation, however, sql inherits the taint from the interpolation, extending the flow all the way to the sink.
This flexibility delivers the hallmark benefit of modern static analysis: results triage shifts from reviewing every potential source-to-sink pair manually to reviewing only actual taint paths that flow into dangerous functions with no sanitization in between. Coverage for common sanitizers like MySQLdb.escape_string() comes built into many tools; encounters with custom, library-specific sanitization logic will still produce results. Those may be false positives, but they are quick to dismiss if you know the codebase and the sanitizer is in place. Tools typically allow you to bridge this gap by defining custom taint steps and sink or sanitizer rules.
Beyond the core graphs
ASTs and CFGs are the pillars of most analysis engines, but security researchers will encounter additional internal representations when looking at tools’ documentation and their generated results. A call graph models potential inter-function flow—nodes are functions and edges denote the possibility of one function invoking another. This is essential for assessing reachability. The Static Single Assignment (SSA) form, meanwhile, rewrites the CFG so that every variable is assigned exactly once, which significantly boosts the efficiency of dataflow engines.
Security research rarely relies on a single one of these structures in isolation. Sophisticated analyzers operate across several at once—an AST for understanding code constructs, a CFG for tracing execution order, and a call graph for linking those traces across function boundaries—to produce precise analyses that compile into a short list of triage-ready, actionable items.
Static Analysis: From Parsing to Taint Tracking
Static analysis tools of all kinds share a common three-part anatomy. First, a parser converts the source code’s syntax into an internal representation tailored for analysis. Second, that representation is structured to make specific kinds of questions easier to answer. Third, algorithms run over the representation to extract the facts a security reviewer cares about. Because these techniques descend from compiler design, the steps mirror what a compiler does before code generation.
The Parser and Internal Representations
The parser’s job is to turn raw text into abstract syntax. From there, the choice of internal representation shapes what analysis is possible. There is no single canonical form; instead, tools select from a family of representations, each suited to particular questions. The most common ones are:
- The abstract syntax tree (AST), which captures the grammatical structure of the code.
- The control flow graph (CFG), which shows the order in which statements and conditions execute.
- The call graph, which maps which functions invoke which others.
- Static single-assignment (SSA) form, which makes data dependencies explicit by ensuring each variable is assigned exactly once in the representation.
Analysis Properties
Once the representation is built, the actual analysis runs. Analyses are categorized along several axes: they can be sound or unsound, flow sensitive or flow insensitive, and safe or unsafe, and they differ in computational complexity. Choosing the right category is a trade-off between precision and practicality. For a deeper treatment of these distinctions, David Binkley’s paper “Source Code Analysis: A Road Map” is a useful starting point.
Hands-On Challenges
To put this knowledge to work, try the following exercises. Each is designed to build the skill of mapping a vulnerability class to concrete code artifacts.
Challenge 1: Identify Sources and Sinks in a Web Application
Pick an open-source web application in a language you know. Your goal is to find the potential sources and sinks for SQL injection.
- What framework does the project use? If your project is not a web app, what could attack-controlled inputs be?
- What does an HTTP request look like in that framework? Find an actual request-handling function in the codebase.
- What operations are sinks for SQL injection?
- Find a concrete example of a sink in the project.
- Does any identified source flow into a sink?
If you cannot find a project, GitHub’s search can help. For example, search for repositories with a filter like language:python stars:>100 type:repositories. Alternatively, OWASP maintains a directory of intentionally vulnerable web applications in open-source repositories.
Challenge 2: Map Sources and Sinks for a Different Vulnerability
Choose a different vulnerability class from the CWE Top 25 or another entry in the CWE database. For your chosen language, determine what the sources and sinks should be for that weakness. If you get stuck, look up the CodeQL query associated with that CWE number in the CodeQL documentation. Most queries include vulnerable code snippets that make the relevant source and sink patterns easy to identify.
Challenge 3: Analyze a Recent Injection Vulnerability
Think of a recent injection vulnerability in an open-source project that you have heard about.
- What were the sources and sinks for that specific vulnerability?
- Open the project’s repository. Can you trace the flow from source to sink?
To make this easier, find the security advisory for the vulnerability. It should state the version where the fix landed. If the code is hosted on GitHub, you can use the “compare” feature to diff the vulnerable version against the patched one and see exactly what changed.
Sources
- Brian Chess, Jacob West. “Secure Programming with Static Analysis.”
- David Binkley. “Source Code Analysis: A Road Map.” In 2007 Future of Software Engineering (FOSE ’07). IEEE Computer Society, USA, 104–119. https://doi.org/10.1109/FOSE.2007.27
- McGraw, G., “Software security: Building security in.”
- Alfred V. Aho et al. “Compilers: Principles, Techniques, and Tools.”



