A CPU Mystery: ZFS Burning Cycles While Unused
Back in 2017, a microservice team at Netflix approached me with an unusual claim: ZFS was eating over 30% of their CPU capacity. My first instinct was skepticism. Having worked on ZFS internals at Sun Microsystems, I knew it shouldn't consume that much CPU unless something was badly misconfigured. But I've been surprised enough times by strange performance issues to know I needed to check it myself.
Initial Metrics Support the Claim
I started with Netflix's cloud-wide monitoring tool, Atlas, to check high-level CPU breakdowns between usr (user-level applications) and sys (kernel activity). The results were striking: 38% of CPU time was in sys, which is highly unusual for typical cloud workloads at Netflix. Suddenly the team's report didn't seem so far-fetched. The question remained: was this really ZFS, or some other kernel activity?
Normally I'd SSH into instances and use mpstat(1) and perf(1) for deeper analysis. But Netflix had an easier path—a tool that could fetch flame graphs directly from the cloud deployment UI. It was worth jumping straight to a flame graph to see what was actually running.
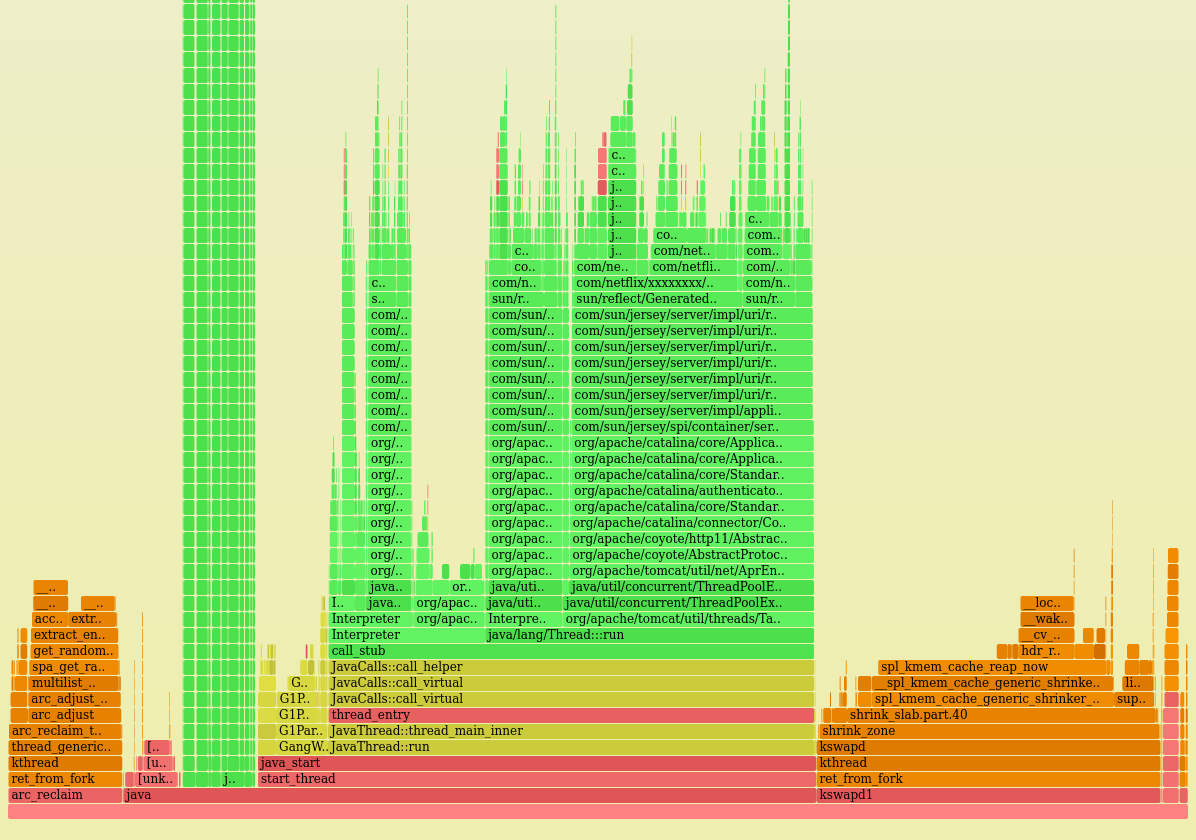
The resulting flame graph from one of the problem instances confirmed the kernel was indeed busy, but the answer was unexpected. Two orange towers dominated the CPU profile.
It Really Is ZFS
Zooming into the left tower showed it clearly: arc_reclaim_thread. This was real ZFS activity. The team was right.
The ZFS Adaptive Replacement Cache (ARC) is the file system's main memory cache. The arc_reclaim_thread runs arc_adjust() to evict memory when the cache grows too large or free memory runs low, keeping a threshold for applications to use. In my time at Sun, I'd seen this thread consume excessive CPU when records were configured far too small (like 512 bytes instead of the default 128 Kbytes), but misconfiguration didn't seem to explain this case. The right orange tower entered spl_kmem_cache_reap_now(), another ZFS memory-freeing function, likely contending for the same locks.
But there was a bigger question: why was ZFS even in use? At the time, Netflix had only one known ZFS deployment—an infrastructure project for containers. My theory was that rapid container churn was forcing the file system to constantly clean old cache entries. The team, however, quickly corrected me: they weren't using containers. Then how were they using ZFS? Their answer stunned me:
"We aren't using ZFS."
That made no sense given the flame graph. arc_reclaim_thread doesn't run for fun—it only evicts pages from the ZFS ARC. If ZFS wasn't in use, there should have been no pages to evict, and no CPU consumption. Nothing about this fit.
The Case Gets Weirder
I checked which ZFS file systems were mounted using cd and ls(1). The output showed nothing—no ZFS file systems were currently mounted. I tried another instance and got the same result. Perhaps containers had been created and destroyed previously, leaving no active file systems. I decided to check the kernel's ZFS statistics via arcstats.
df -h
mount
zfs list
The counters told an unbelievable story: all were zero. ZFS had apparently never been used on these instances. Yet it was consuming 38% of CPU. The team was right all along—ZFS was eating CPU for absolutely no reason. How can a file system not in use consume that much processing power? I'd never seen anything like it.
# cat /proc/spl/kstat/zfs/arcstats
name                            type data
hits                            4    0
misses                          4    0
demand_data_hits                4    0
demand_data_misses              4    0
demand_metadata_hits            4    0
demand_metadata_misses          4    0
prefetch_data_hits              4    0
prefetch_data_misses            4    0
prefetch_metadata_hits          4    0
prefetch_metadata_misses        4    0
mru_hits                        4    0
mru_ghost_hits                  4    0
mfu_hits                        4    0
mfu_ghost_hits                  4    0
deleted                         4    0
mutex_miss                      4    0
evict_skip                      4    0
evict_not_enough                4    0
evict_l2_cached                 4    0
evict_l2_eligible               4    0
[...]
Following the Code Paths
Going back to the flame graph for a closer look, I found the CPU paths led to get_random_bytes() and extract_entropy()—functions I didn't immediately associate with normal ZFS operations. Browsing the source code and change history revealed the culprit.
The ARC maintains lists of cached buffers for different memory types. A "multilist" performance feature had split these lists into one per CPU to reduce lock contention on multi-CPU systems, which should improve performance. But eviction created a problem: if you need to free memory, you have to choose one of those per-CPU lists to work with. Instead of round-robin selection, which would have been a reasonable approach, the developer chose to pick a list at random.
Specifically, using cryptographically secure random numbers.
The kicker: ZFS wasn't even in use. The ARC detected low system memory, triggered arc_reclaim_thread, and set about adjusting its cache size. It would quickly discover the cache was already at zero size and didn't need to do anything—but only after burning a massive amount of CPU selecting a zero-sized list with an expensive random number generator.
I filed this as ZFS issue #6531. The first fix allowed the arc_reclaim_thread to bail out early when ZFS wasn't in active use, skipping list selection entirely. The ARC has undergone many changes since, and the issue hasn't resurfaced.



