Start with the numbers that matter most
A performance budget is just a spending limit — for your site's metrics. Set one, enforce it, and you protect the user experience against regressions while keeping business goals on track. The process is straightforward, and you can define a first budget with a few targeted steps.
Audit your key pages first
If you already have a site, identify the pages with the most impact: highest traffic or main conversion routes. Then run Lighthouse on those pages in a Chrome Guest window to record two milestones:
- First Contentful Paint (FCP) — when the first content appears
- Time to Interactive (TTI) — when the page is reliably responsive
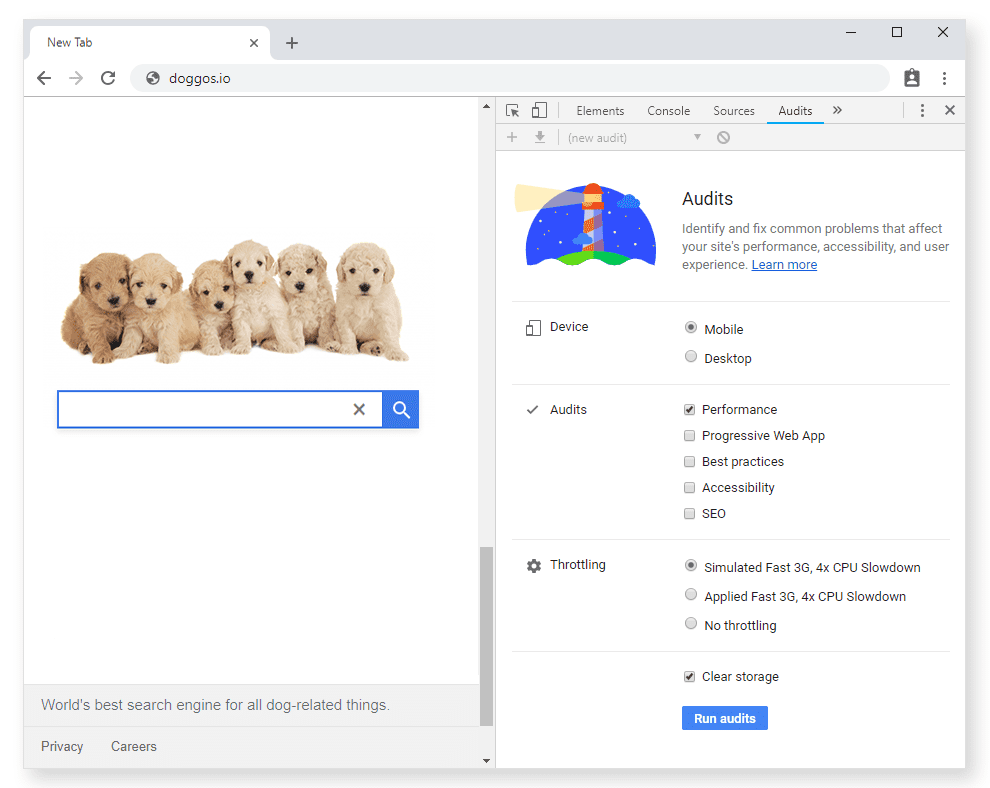
Suppose a dog-themed search engine, Doggos.com, treats the home and results pages as critical. On desktop and mobile, those pages showed the following preliminary timings:
| Desktop | FCP | TTI |
|---|---|---|
| Homepage | 1,680 ms | 5,550 ms |
| Results page | 2,060 ms | 6,690 ms |
| Mobile | FCP | TTI |
|---|---|---|
| Homepage | 1,800 ms | 6,150 ms |
| Results page | 1,100 ms | 7,870 ms |
Benchmark against competitors
Comparable sites reveal what the market already achieves. Reviewing around ten competitors gives you a realistic baseline. Start with Google's related: search operator, or use similar-site tools like Alexa Similar Sites or SimilarWeb.

Since most web traffic today happens on mobile, build that chart first using mobile FCP and TTI for every competitor. Highlight the fastest of the group — that's your reference point.
| Site/Homepage | FCP | TTI |
|---|---|---|
| goggles.com | 880 ms | 3,150 ms |
| Doggos.com | 1,800 ms | 6,500 ms |
| quackquackgo.com | 2,680 ms | 4,740 ms |
| ding.xyz | 2,420 ms | 7,040 ms |

The 20% rule applies here: users only perceive a difference beyond 20% in response time. To stand out, aim at least 20% faster than the best competitor.
| Measure | Current time | Budget (20% faster than competition) |
|---|---|---|
| FCP | 1,800 ms | 704 ms |
| TTI | 6,500 ms | 2,520 ms |
If that target looks unreachable for an existing site, don't overreach. Set the first budget at 20% faster than your current state, then keep tightening with each cycle.
For Doggos.com, that revision looks like:
| Measure | Current time | Initial budget (20% faster than the current time) | Long-term goal (20% faster than competition) |
|---|---|---|---|
| FCP | 1,800 ms | 1,440 ms | 704 ms |
| TTI | 6,500 ms | 5,200 ms | 2,520 ms |
Layer in other metric types
Milestone timings alone are useful but incomplete. Add quantity- and rule-based metrics to make the budget resilient when content changes.
Critical-path resource budget
Try to deliver under 170 KB of compressed, minified critical-path resources. This keeps performance acceptable even on cheap hardware with a slow 3G connection.
Your total page weight should stay well below the current median — more than 1 MB for both desktop and mobile per the HTTP Archive. Depending on your target TTI, acceptable weight varies:
| Network | Device | JS | Images | CSS | HTML | Fonts | Total | Time to Interactive budget |
|---|---|---|---|---|---|---|---|---|
| Slow 3G | Moto G4 | 100 | 30 | 10 | 10 | 20 | ~170 KB | 5s |
| Slow 4G | Moto G4 | 200 | 50 | 35 | 30 | 30 | ~345 KB | 3s |
| WiFi | Desktop | 300 | 250 | 50 | 50 | 100 | ~750 KB | 2s |
You'll adjust the exact numbers by content type. An image-heavy e-commerce page needs stricter JavaScript limits than a mostly-text news portal; ad or analytics scripts add their own payloads. Start from the ranges above, then refine after you measure real user-facing metrics.
Lighthouse score budget
Lighthouse performance scores derive from five metrics that include both FCP and TTI as inputs. Set the score budget to at least 85 out of 100 and wire Lighthouse CI into pull requests to enforce it.
Set priorities by user intent
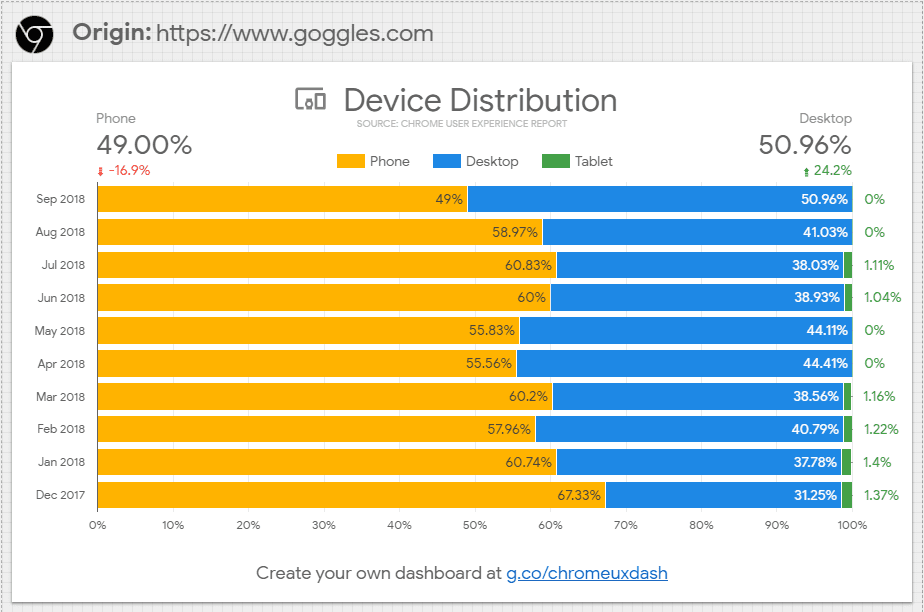
Different journeys demand different budgets. For a news site, readers need content fast — keep FCP low. For Doggos.com, visitors want to click relevant results quickly — low TTI matters more. Favor the metric that matches your audience's primary goal, and check the Chrome User Experience Report dashboard for competitor audience split by device.
Enforce it across the project
The budget only holds if it is part of the build. Integrate it early and keep enforcement running so new changes can't silently push metrics past the limit.



