
When Garbage Collectors Steal Your Frame Budget
Modern JavaScript virtual machines have eliminated much of the raw performance overhead that once plagued web applications. But for teams building intensive real-time experiences — interactive 3D scenes, audio processing, games — the battle for CPU cycles is never over. A 60fps application has just 16 milliseconds per frame to complete all JavaScript work, and every one of those milliseconds is precious. When garbage collection pauses begin eating into that budget, the result is visible jank that can ruin an otherwise polished experience.
This was exactly the plight of the developers behind "Find Your Way to Oz," an interactive WebGL and WebAudio experience. They approached the V8 team with a mystery: occasional freezes with no obvious cause, correlating perfectly with garbage collection pauses that reclaimed roughly 10MB of garbage every second. That volume of garbage was nowhere near justified by the application's design.
What followed was a textbook performance investigation — part forensic analysis, part detective work — that illustrates the systematic approach teams can apply when JavaScript performance goes off the rails.
Understanding What the Garbage Collector Does
V8 (and virtually all modern JavaScript engines) automatically manages memory through generational garbage collection. Newly allocated objects live in a small region called the young generation, while objects that survive multiple collection cycles get promoted to the old generation. Because it's small, the young generation fills up far more frequently — and most objects that die young are cheap to reclaim.
In V8, the young generation consists of two equally sized contiguous memory blocks, only one of which is active at any point. Allocation there is extremely cheap: a cursor simply moves forward by the needed bytes. But once memory runs out, the application halts while collection happens. At that point the two spaces swap roles, and any surviving objects are either copied to the new active space or promoted to the old generation.
The implication is direct: each time your code allocates an object — whether explicitly with new, [], or {} — it moves the application closer to the next pause. For smooth frame rates, keep allocations near zero per frame.
Building a Profile of the Crime Scene
An initial investigation with the Chrome DevTools Timeline Panel served up the classic sawtooth memory graph — a repeating pattern of rapid allocation followed by collection spikes. The pauses in the application always lined up with those collection cycles.
The question was: why was the Oz application generating enough garbage to trigger a 10MB collection every second, when its code followed all the known best practices for performance? The Oz developers weren't novices — they had carefully structured their code around V8's optimization techniques. (One wrinkle: they were writing CoffeeScript that compiled to JavaScript, making code audits harder than they would be with source maps support in DevTools.)
Interviewing the Suspects
With the baseline established, the investigation turned to identifying what could be creating all this garbage.
Unnecessary Allocation
An obvious candidate: For a high frame-rate application, calling new inside the frame loop guarantees GC pressure. The Oz team quickly ruled this out — they knew the consequences and were proud to have a "zero new per frame" policy. Off the list.
Changing Object "Shapes"
V8's optimizing compiler relies on objects maintaining a consistent structure. Adding a property to an object outside its constructor changes that internal "shape" (hidden class), triggering a deoptimization, which can lead to a cycle of deopts and recompiles. But after careful code review, it was confirmed that object shapes were static from construction time onward. This suspect was scratched as well.
Unoptimized Arithmetic
When code runs in its unoptimized, bytecode form, every intermediate computation allocates an actual object. Consider the innocuous snippet:
var a = p * d;
var b = c + 3;
var c = 3.3 * dt;
point.x = a * b * c;
In V8's interpreter, this single assignment can materialize as many as five independent HeapNumber allocations — one for each variable and one for every intermediate product before the final value is bound to a property. While Oz performs thousands of these arithmetic operations per frame, they only become a problem if any of the surrounding functions fail to get optimized by the compiler. So this suspect remained viable only if some function had fallen into an unoptimized state.
Reassigned Property Values
The fourth possibility was more insidious. Storing a freshly computed double into an object property in optimized code triggers an implicit allocation of a HeapNumber to hold that value. Each assignment means a new object. Some code patterns:
sprite.position.x += 0.5 * (dt);
appear trivial, but in a loop executed thousands of times per frame, they can rapidly push the application toward a collection. This candidate was not ruled out. The countermeasure for this behavior is also simple: storing these assignments in a typed array (or a regular array holding only doubles) eliminates the per-write allocation entirely — the backing storage is fixed, and value changes write over the storage without creating additional objects.
The Smoking Gun Approach
The investigation narrowed the likely causes to either unoptimized arithmetic paths or property writes on number-heavy objects. What remains was careful experiment: verifying each candidate's behavior in isolation and measuring whether removing it brought the jank rate down.
This process mirrors what performance teams now embed in their day-to-day tooling. Chrome DevTools and V8's profiling flags allow pinpointing not just which functions run slowly but which allocation sites are hot. Any UI team fighting jank at high frame rates should keep the zero-allocation rule top of mind — but when the evidence suggests otherwise, the next logical step is profiling the allocation path itself.
As the Oz story shows, the answer to a performance mystery is rarely a single cleanup. It comes down to gathering the right evidence, forming solid hypotheses, and isolating the one culprit that, in context, makes the behavior observable and fixable.
Running the Experiments
With two remaining suspects—heap number properties and arithmetic in unoptimized functions—the next step was to instrument V8 directly. The engine ships with built-in logging that can reveal exactly what the optimizer is doing.
Launch Chrome from a clean state with the following flags, then quit it completely:
--no-sandbox --js-flags="--prof --noprof-lazy --log-timer-events"
This produces a v8.log file in the current directory. To interpret it, download the matching V8 source (check about:version in Chrome) and build it, then process the log with the tick processor:
$ tools/linux-tick-processor /path/to/v8.log
Substitute mac or windows for linux as needed, and run from the top-level V8 source directory. The output is a text table showing which JavaScript functions consumed the most ticks:
[JavaScript]:
ticks  total  nonlib   name
167   61.2%   61.2%  LazyCompile: *opt demo.js:12
 40   14.7%   14.7%  LazyCompile: unopt demo.js:20
 15    5.5%    5.5%  Stub: KeyedLoadElementStub
 13    4.8%    4.8%  Stub: BinaryOpStub_MUL_Alloc_Number+Smi
  6    2.2%    2.2%  Stub: BinaryOpStub_ADD_OverwriteRight_Number+Number
  4    1.5%    1.5%  Stub: KeyedStoreElementStub
  4    1.5%    1.5%  KeyedLoadIC:  {12}
  2    0.7%    0.7%  KeyedStoreIC:  {13}
  1    0.4%    0.4%  LazyCompile: ~main demo.js:30
Here, demo.js has three functions: opt, unopt, and main. The asterisk next to a function name (like opt) marks it as optimized; unopt is not.
A second visualization tool, plot-timer-event, produces a PNG timeline:
$ tools/plot-timer-event /path/to/v8.log
The resulting timer-events.png plots execution states against time:
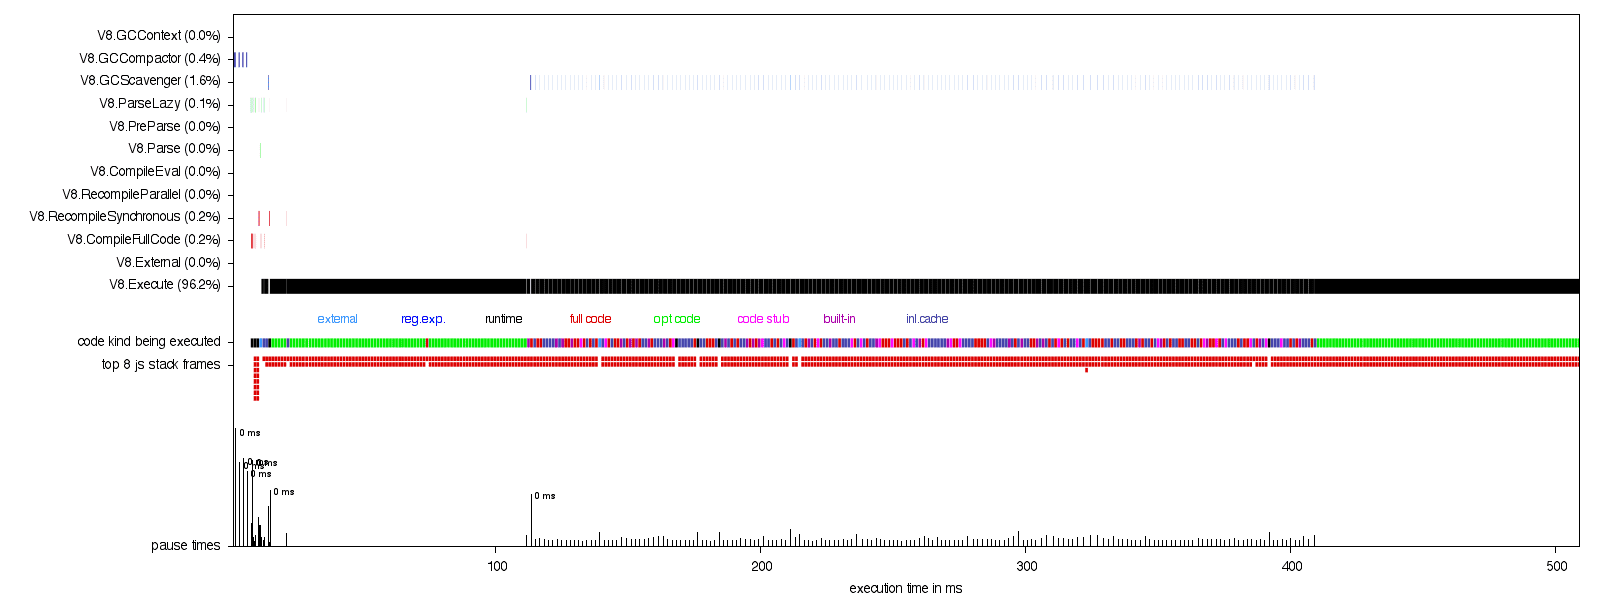
Each row corresponds to a V8 internal state, with vertical marks at each profile tick:
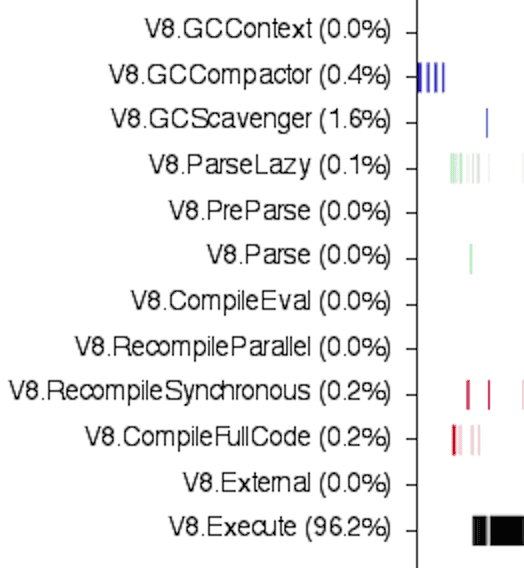
The V8.Execute row shows black ticks for JavaScript execution, V8.GCScavenger shows blue ticks for new-generation collections, and so on. The "code kind being executed" row is the most informative: green means optimized code is running, while a red/blue mix indicates unoptimized execution. A transition from green to mixed and back looks like this:

Ideally, that line goes solid green and stays there—that is the optimized steady state. Unoptimized code always runs slower.
For faster iteration, refactor your app to run under the V8 debug shell, d8. This shortens turnaround times for the tick processor and plot-timer-event tools and reduces noise in the data.
Tracking Down the Culprit
The timer-event plot from the Oz source code revealed a clear pattern: execution transitioned from optimized to unoptimized code, and while in that unoptimized state, many new-generation collections fired. The next screenshot—time stripped from the middle—shows the telltale sign:
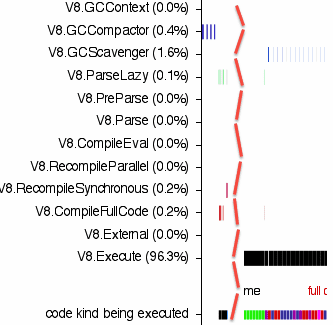
Notice the black execution ticks disappear exactly when the blue GC ticks appear. The script is paused during every garbage collection.
The tick processor output from the same code told a similar story: the top function, updateSprites, was unoptimized. The function where the program spent the most time was also the function V8 refused to optimize. The code in question contained loops like this:
function updateSprites(dt) {
    for (var sprite in sprites) {
        sprite.position.x += 0.5 * dt;
        // 20 more lines of arithmetic computation.
    }
}
The for-i-in construct is a known case that V8 sometimes chooses not to optimize. That heuristic may change in future versions, but today it is a real limitation. To confirm this was the exact reason, a more direct approach was needed.
Confirming the Diagnosis
Running Chrome with the following flag logs all optimization and deoptimization decisions verbosely:
--js-flags="--trace-deopt --trace-opt-verbose"
Searching that log for updateSprites produced the smoking gun:
[disabled optimization for updateSprites, reason: ForInStatement is not fast case]The Fix and the Follow-Up
The solution was straightforward: move the computation into its own dedicated function.
function updateSprite(sprite, dt) {
    sprite.position.x += 0.5 * dt;
    // 20 more lines of arithmetic computation.
}

function updateSprites(dt) {
    for (var sprite in sprites) {
        updateSprite(sprite, dt);
    }
}
Now updateSprite gets optimized, which dramatically cuts the number of HeapNumber objects being allocated and, in turn, the frequency of GC pauses. The same diagnostics can confirm the improvement on the new code.
One nuance remains: the code still stores double values as object properties. If profiling shows that is a bottleneck, switching position to an array of doubles or a typed data array would reduce object allocation further.
The Oz team took the lesson to heart. Armed with the tick processor, timer-event plots, and the optimization log, they hunted down other functions stuck in what they called "deoptimization hell," factored their computation out into leaf functions that V8 would optimize, and picked up additional performance gains along the way.



